CHILLGUY 3D DOWN TREND$CHILLGUY Looks like eyeing for Bollinger lower band around 0.039
At long timeframe like 3D and weekly its still in a down trend
stay cautious :)
Solana

SOLUSDT 1D - Bulls back in control with Golden Cross and channelOn the daily chart, SOLUSDT is forming a bullish continuation structure. After the Golden Cross (MA50 crossing MA200), the price is now pulling back toward the midline of the ascending channel and the 0.5 Fibonacci level at 166.38. This confluence with the broken trendline and 200 EMA makes this zone a prime technical area of interest.
Support: 166.38 (0.5 Fibo), EMA200 (161.77), broken trendline
Resistance: 182.84–189.67 (Fibo 0.705–0.79), 206.54, target - 255.93 (Fibo 1.618)
This retracement looks healthy, supported by higher volume during the prior bullish leg. As long as the 166.38–161.77 zone holds, continuation toward 206.54 and potentially 255.93 is on the table.
Fundamentally, Solana remains a key L1 narrative with strong traction in DePIN and AI-linked dApps. The rising TVL and investor sentiment support the trend.
Watch price action around 166 for confirmation - this is the battleground.

Still bullish My overall bias for Solana is bullish.
It has been a difficult asset to trade, however, I can still see bullish momentum is building up in higher time frames:
Weekly:
1) MACD line (faster line) has finally entered the bull zone since it dropped to $95 on April 25.
2) RSI line (orange one) has entered the bull zone.
3) EMA 5 > EMA21> EMA 55
Daily:
1) EMA 21> EMA55> EMA200
2) MACD lines are still in the bull zone.
3) Stochastic has reached the oversold territory and crossed to the upside.
4) The price is still forming higher high higher low above the ascending trendline.
5) The price has retraced to Fib 0.618 and now it is bouncing up.
6) The daily candle on 2n August closed at Fib 0.618 and yesterday's candle closed above both EMA55 and 200.
As I mentioned in my previous articles, when EMA55 crosses above EMA200, the price often retraces significantly before it starts to move to the upside. So I was prepared for the price to drop to Fib 0.382, 0.5, 0.618 or 0.786. At the moment, Fib 0.618 seems to be working as the lines of support.
The current price action looks good for the bull, however, $185-200 zone has been a very tough area to break. Therefore, I am prepared for a few scenarios:
Scenario 1: The price will move to Fib 0236 zone at $188 area. It fails to break above and drops to retest either the ascending trendline or wicks down to Fib 0.786/$143 area.
Scenario 2: The price will move to Fib 0.236 zone, consolidates in the area and moves up.
Scenario 3: It fails to move above Fib 0.236 level, drops below the ascending trendline and Fib 0.786. If it happens, I need to re assess my bullish bias.
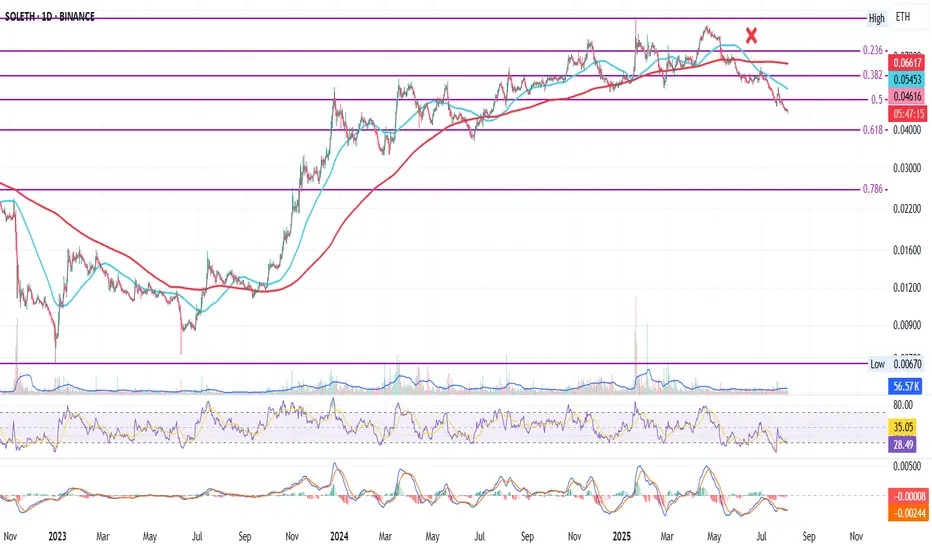
SOL vs ETH: Bleeding Until Catalyst?
SOL/ETH on the Daily
On June 17, 2025, a death cross formed — and since then, SOL has been steadily losing ground to ETH.
Attempts to pause or reverse the trend at the 0.382 and 0.5 Fib levels have failed. Momentum is strong to the downside.
The next potential support is the 0.618 Fib, around 0.04000.
In my view, this is closely tied to Ethereum’s dominance narrative: ETF inflows, real-world assets, stablecoins, Trump support, protocol upgrades — the spotlight is firmly on ETH.
Unless SOL gets its own ETF (which, to my knowledge, it currently doesn't), it’s likely to keep bleeding against ETH — just like other altcoins in similar positions.
Bias: bearish until proven otherwise.
Always take profits and manage risk.
Interaction is welcome.
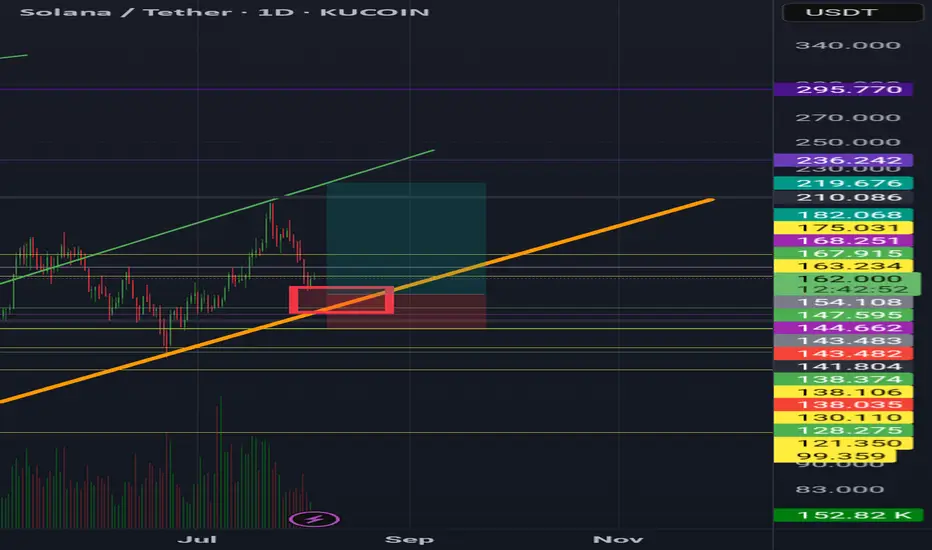
SolanaZol usdt daily analysis
Time frame daily
Position long
Target 219$
Risk rewards ratio >4 👌👈
Red box on the cart is the good erea to entrance long position
Orange uptrend line is a very strong support lines
I guess in this turn of upcoming, solana will reach my target
Solana definition of movementSOL is in a squeeze phase: the price is holding above $163, but meets resistance around $183-186. Indicators show neutral, slightly weak momentum. A break above $186 with increasing volumes will open up potential at $190+; a break below $178 will lead to a deeper correction to $171-170. Until then, it is worth watching the 20-d EMA hold and reactions to it.
SOLANA's Situation, A Comprehensive Analysis !!!The price on the 3d timeframe is within an ascending triangle, which can be promising. If the price breaks this pattern with bullish candles, it could easily rise by the distance of AB=CD .
Best regards CobraVanguard.💚

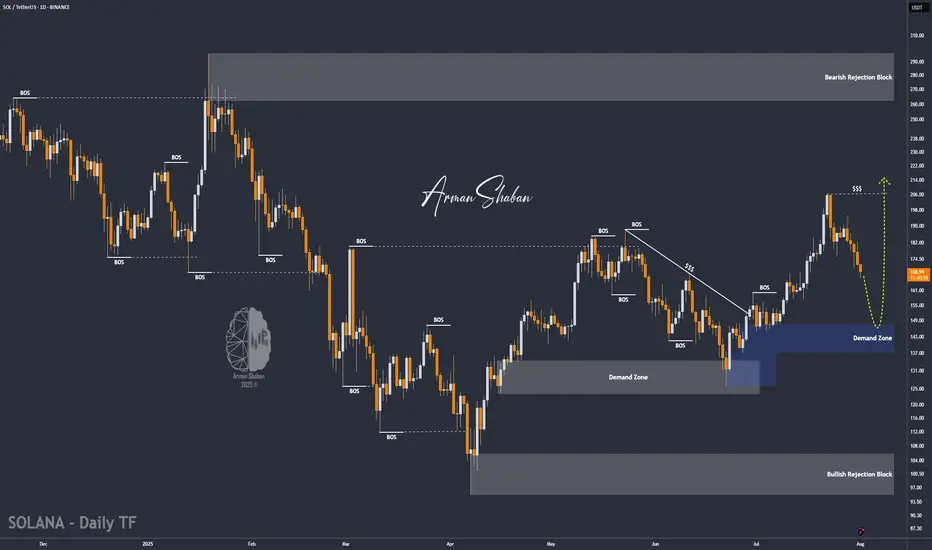
SOL/USDT | SOL Drops 25% – Approaching Key Buy Zone at $136–$148By analyzing the Solana chart on the daily timeframe, we can see that, like the rest of the market, it's undergoing a correction — dropping over 25% from the $206 area so far. Solana is now approaching a highly attractive buy zone between $136–$148, so be sure to closely monitor the price reaction in this range. Bullish targets will be announced soon — stay tuned!
Please support me with your likes and comments to motivate me to share more analysis with you and share your opinion about the possible trend of this chart with me !
Best Regards , Arman Shaban

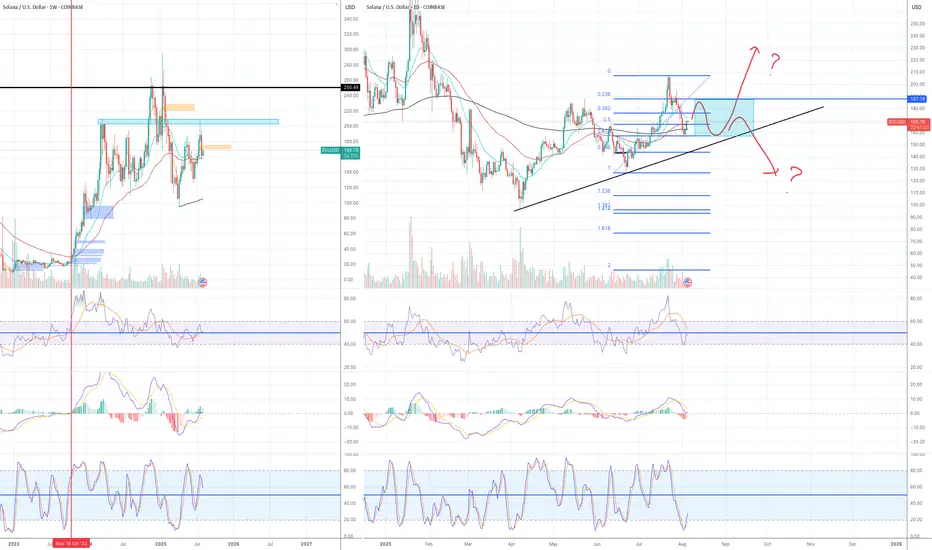
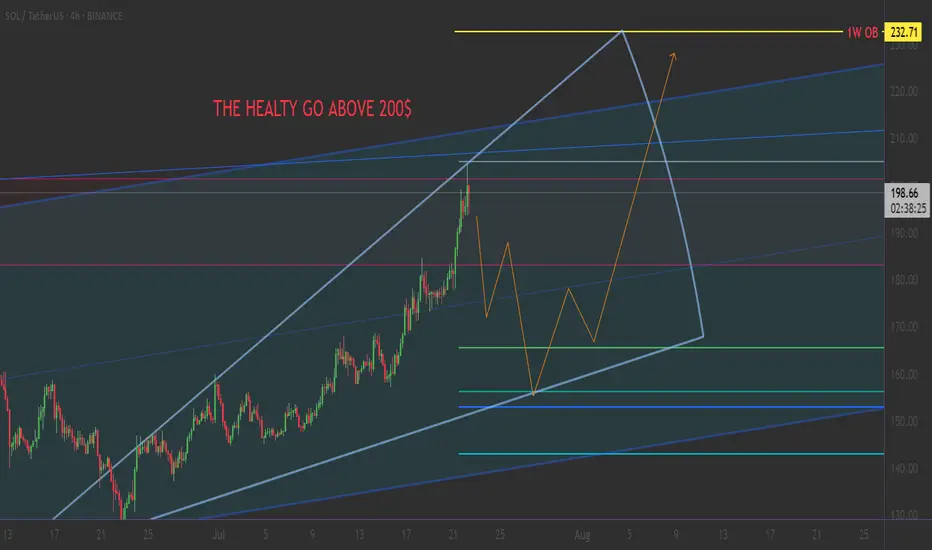
SOLANA $250 INCOMING? or $150 again?We can see a wedge is forming, price is at a major point, break above with a failed break below the resistance - we see high potential for $250.
Failed breakthroughs and a rejection? We see $150 once more.
Thoughts?

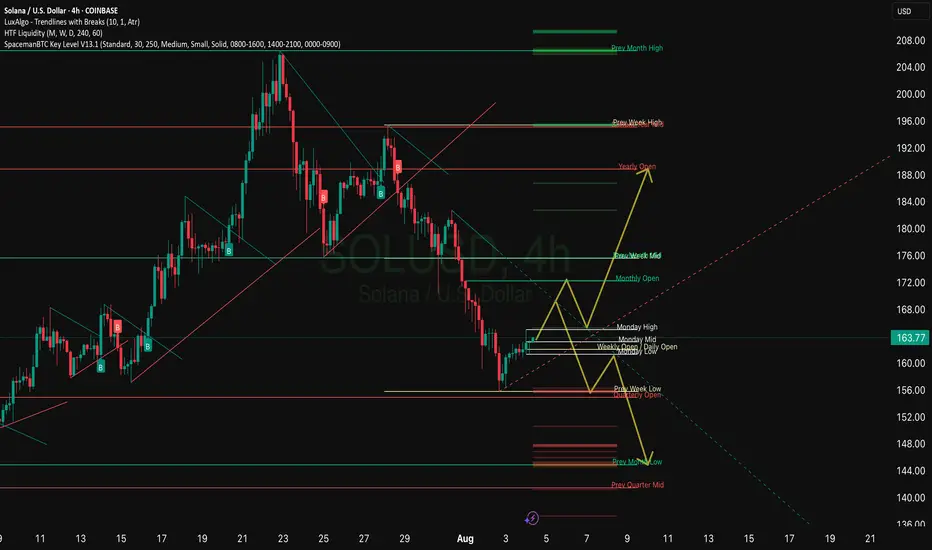
SOLANA: THE ULTIMATE TECHNICAL CONVERGENCE..📊 THE TRADING PLAYBOOK
🛡️ CONSERVATIVE SUPPORT PLAY
Setup: Buy at Fibonacci support levels🚨
Entry: $158-$165 (0.618-0.5 zone) 🌟
Stop: $140 (Below all major support) ❌
Target:
Tp1 : $200(25% gain) 💰
Tp2 : $232 (40% gain) 💰
⚡ Position Size: 3-5% of portfolio ⚡
Time Horizon: 3-6 weeks 🎯
______ NOTE _______
DYOR ⚠️ Not financial advice. This analysis is for educational purposes only. Always do your own research and never risk more than you can afford to lose.
#SOLANA #SOL #SymmetricalTriangle #Fibonacci #Breakout #Crypto #TechnicalAnalysis #AltSeason #DeFi #MemeCoins #TradingSetup
Long-Term Technical Outlook: Critical Decision Point Approaching
The chart illustrates a long-term technical structure where the price has been following an ascending channel after a prolonged bearish trend. However, recent price action indicates a breakdown below the green ascending trendline, raising concerns about a potential shift in market sentiment.
Currently, the $117 level is acting as a pivotal support zone. A sustained breakdown below this level — and more critically, below the red lower trendline — would validate the bearish scenario. This could trigger a deeper correction phase, with downside targets aligned along the red projection path. Such a move may lead to significantly lower price levels in the medium to long term.
🔽 Bearish Scenario:
If the price fails to hold above $117 and breaks below the red trendline, this would confirm the start of a bearish leg. Based on historical structure and projected trajectories, this could result in a descent toward the $93 level initially, with the possibility of extending further downward depending on market conditions.
🔼 Bullish Scenario:
On the other hand, if the price manages to reclaim the green trendline and more importantly, stabilize above the $204 resistance zone, it would signal renewed bullish strength. Such a move would open the path toward higher highs, potentially re-entering the previous upward channel and continuing the macro uptrend.
🧭 The price structure is now approaching a decisive zone, where either a confirmation of bearish continuation or a bullish recovery will likely unfold. Both scenarios have been visually outlined — green lines indicating bullish continuation, and red lines representing bearish momentum.
📌 Note: This analysis is for educational purposes only and should not be interpreted as financial advice.

Solana Update · Retrace, Bears & The Bullish BiasSolana had a retrace in May. Notice the 19-May date on the chart. This retrace produced four weeks red. The bullish move that led to this retrace lasted 6 weeks. The last rise lasted five weeks and the current retrace might last only two weeks, can be less.
We are seeing Solana rising but this rise is not a one-time off event, this is a trend that is developing. An uptrend as a long-term phenomena is different to a short-term bullish moves. A short-term move tends to be really fast, one strong burst and that's it. A long-term move is different. Instead of seeing 2-3 candles and Solana trading at $1,000, we see dozens and dozens of candles with prices slowly rising. There are strong fluctuations but the end result is always up. And that's how you see the fluctuations on the chart.
Solana moved up and then immediately started to retrace. Then another rise and another retrace again. This retrace will end and prices will continue to grow long-term. The bulls are in. The bull market is on. Solana, Bitcoin, Crypto and the rest of the Altcoins market is going up.
Namaste.

The next levels for Solana coinIn this video I recap the previous video and discuss what may be next after the current retracement .
I reveal some important levels that sit below as well as the relationship with the Eth/Btc chart.
Tools used vwap, Fibs and volume profile .

SOLANA BULLISH MEGAPHONE PATTERN LOADING! solana continues to move step by step towards higher levels within the bullish megaphone pattern, which will make movements towards ATH and more inevitable in the coming period

SOL/USDT | NFP Volatility Could Trigger Drop Toward $154!By analyzing the Solana chart on the daily timeframe, we can see that the price is currently trading around $169. If it fails to hold above the $168 level, a deeper drop could follow. With the upcoming NFP data release, increased volatility is expected across the markets. If Solana begins to decline, the potential correction targets are $163, $157, and $154. Watch the $145–$154 zone closely for a possible bullish reaction and buy opportunity.
Please support me with your likes and comments to motivate me to share more analysis with you and share your opinion about the possible trend of this chart with me !
Best Regards , Arman Shaban
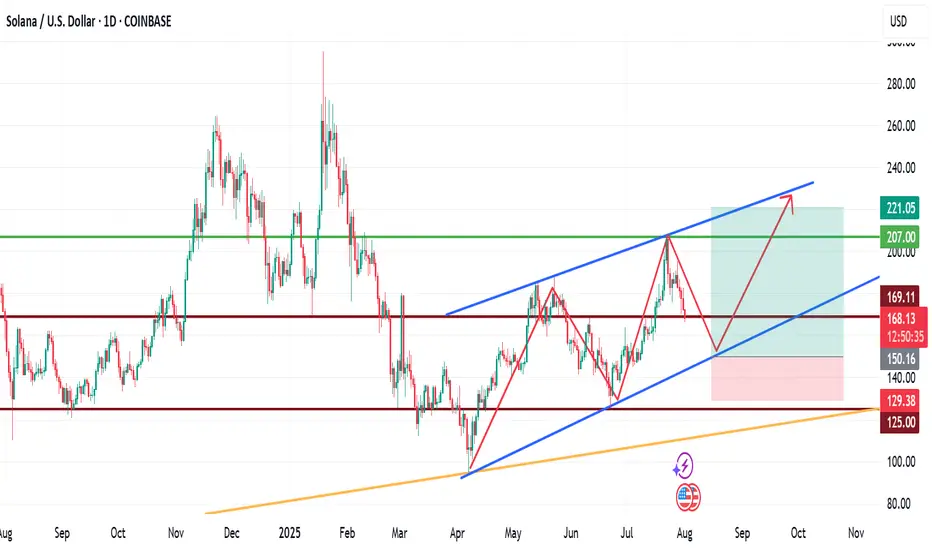
My View for SOLANA next moveMy View for SOLANA next move.
Technically, SOL has been trading within a channel for a while now, with the formation of HHs and HLs.
If fundamentals play out positively long to mid-term, we are likely to see SOLNA fall to $150 zone before another upward leg forms. This leg may rally to as high as $220.
Trade with care.
If you found this helpful, please connect with me.
Like, comment and share
Very Bullish!!
Solana chart looks very bullish. The price is currently dropping but I think it is a very healthy correction.
Weekly chart:
1) all momentum indicators just entered the bull zone.
2) The chart is forming higher highs.
Daily:
1) EMA55 finally crossed EMA200. The last time they crossed was October 2023 (see red vertical line in the chart) and it was the beginning of the macro bull trend.
2) Momentum indicators have reached overbought territory and crossed to the downside, however, given weekly momentum indicators have just entered the bull zone, this move is likely to be corrective action.
3) When EMA55 and EMA200 cross, the price often retraces initially to EMAs (21, 55 or 200). Once it completes the pull back, I anticipate the price to move to the previous ATH and beyond.
This is the time when high leverage trading volume increases.
Be careful not get wicked out. Focus on monthly/weekly/daily charts and ignore the noise in the lower timeframes.

Still bullish in the higher time frames Solana has been struggling to break and stay above $170-200 zone this cycle.
It has been a very difficult asset to trade, however, I can see more bullish setups than bearish setups in higher timeframe charts.
Monthly:
1) July monthly candle closed above Fib 0.618 and formed higher high higher low.
2) RSI and MACD are still in the bull zone.
3) Stochastic are in the bear zone, but they are pointing to the upside.
Weekly:
1) EMA21 is still above EMA55.
2) The current weekly candle is forming bearing engulfing candle, however, there are two more days before it closes. It is still above EMA 21.
3) RSI orange line (RSI based moving average) is moving upwards and entering the bull zone.
4) MACD is about to enter the bull zone.
5) Stochastic hasn't reached overbought territory yet.
6) The set up of these three momentum indicators is very similar to the set up in Oct 23 before Solana started a massive bull trend. (see red vertical line)
Daily:
1) EMA21>EMA55>EMA200
2) As I said in the previous articles, EMA 55 and 200 don't cross easily. But when they do, the price often pulls back significantly before it starts to move in the direction of the trend.
3) Daily candle broke below EMA21, however, the price is reacting strongly to EMA55.
4) The price is still higher high higher low.
I will wait and see if the price is going to bounce off from $143 -157 region. (see blue rectangular block).

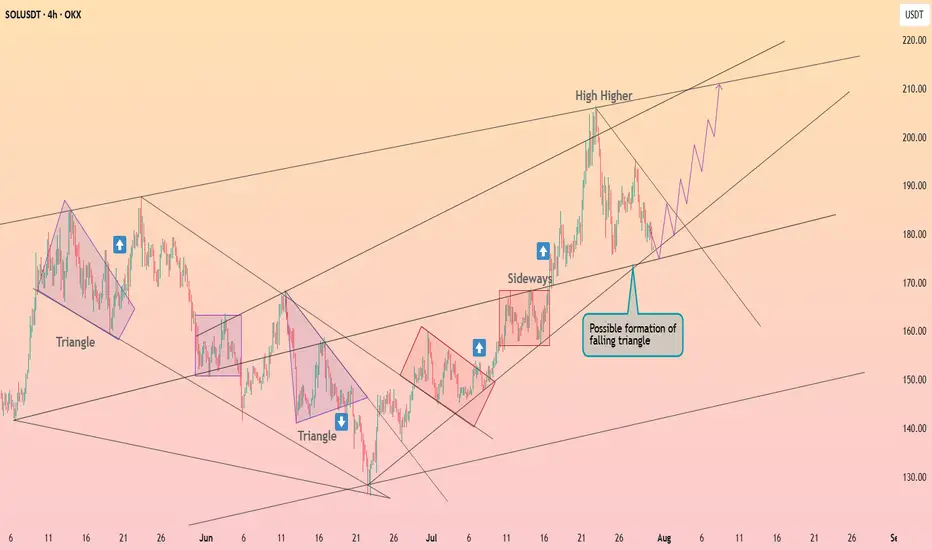
Solana is forming the falling triangle ┆ HolderStatOKX:SOLUSDT is compressing into a possible falling triangle, with support around 180–185 and upward projections pointing toward 210+. The chart has repeatedly shown triangle breakouts into strong rallies. As long as the lower trendline holds, the upside setup remains valid.
SOLANA could have a major retracement Solana completed a major ABC correction into a supply zone on the higher time frame (HTF), taking out the previous quarter’s highs.
On the daily chart, the RSI is overbought and signals the potential for a significant retracement.
Price action on the 4-hour chart shows a series of lower highs, indicating a bearish trend. If Solana fails to break above the previous high and trigger a market structure shift, the downtrend is likely to continue, leading to a deeper retracement on the higher time frames.

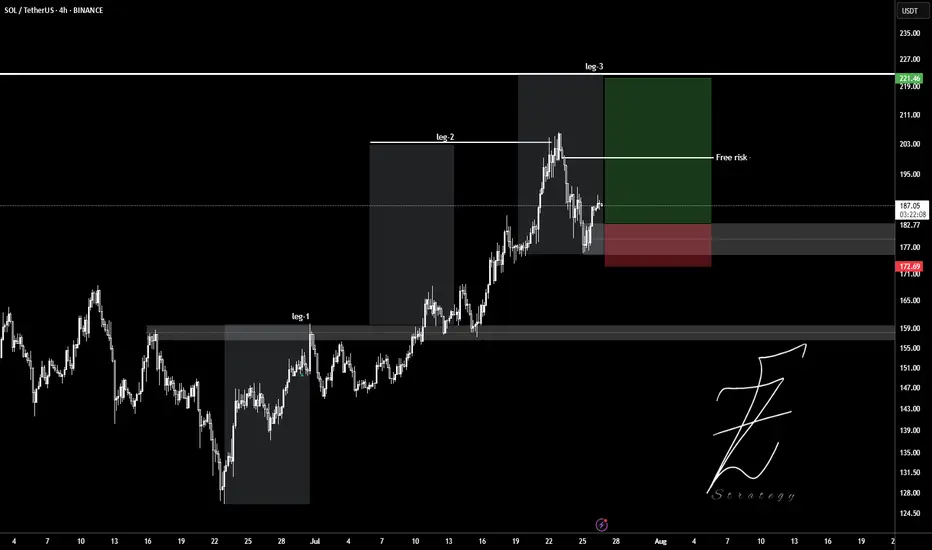
SOLUSDTWait for pollback to 180$ level and ready to get buy position.
Target set in leg2 and leg3.
Entry: 182
Stop: 177
Tp: 190 - 200 - 210 - 220
Please control Risk management.
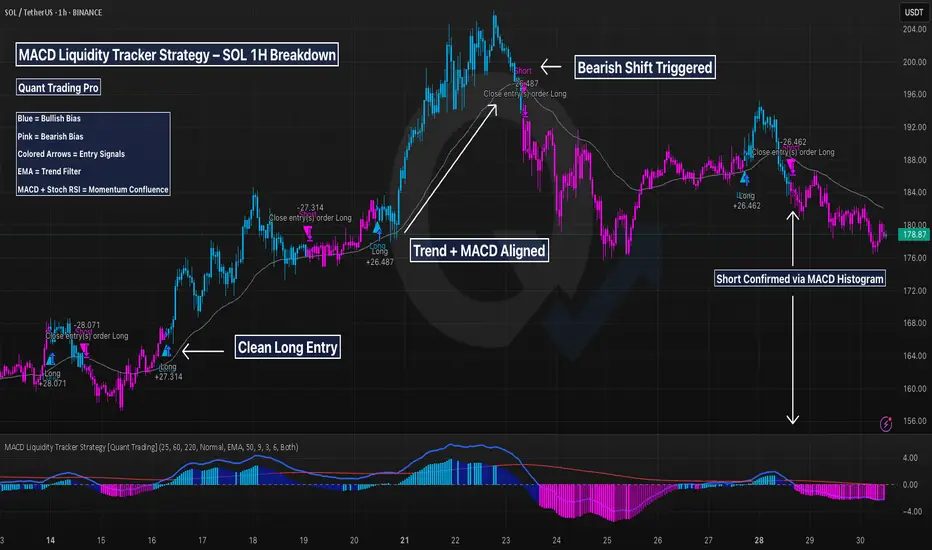
SOL 1H – How This MACD Strategy Filters Noise & Times SwingsThis chart showcases the MACD Liquidity Tracker Strategy applied to Solana’s 1H timeframe — designed to help traders capture clean trend moves while avoiding noisy whipsaws.
The system combines:
✅ MACD momentum filtering (25 / 60 / 220)
✅ 9 & 50-period moving average confirmation
✅ Stoch RSI confluence
✅ State memory logic to reduce false flips
🔍 Strategy Breakdown:
Entry Conditions:
Buys trigger when MACD histogram shifts bullish, the trend filter confirms, and momentum aligns with Stoch RSI. Shorts trigger on the inverse.
Visual Context:
Blue candles = Bullish state
Pink candles = Bearish state
Gray line = Confirmation filter (EMA)
Performance Example:
Caught two major long legs: +27.31 and +26.46
Avoided most chop through clear color-shifting logic
Recent short called the local top with MACD + trend confluence
📌 Why It Works:
The strategy focuses on structure first, signal second — letting trend context and MACD compression guide entries. Unlike traditional crossovers, this approach uses liquidity-aware thresholds to reduce noise and keep traders in the right trend longer.
🧠 Ideal For:
Swing traders on LTFs (15m–4H)
Crypto traders wanting cleaner confirmation
Anyone backtesting with QuantTradingPro or building a trend-following system
This chart shows how combining indicators into a rules-based system can help you trade with clarity — not emotion.
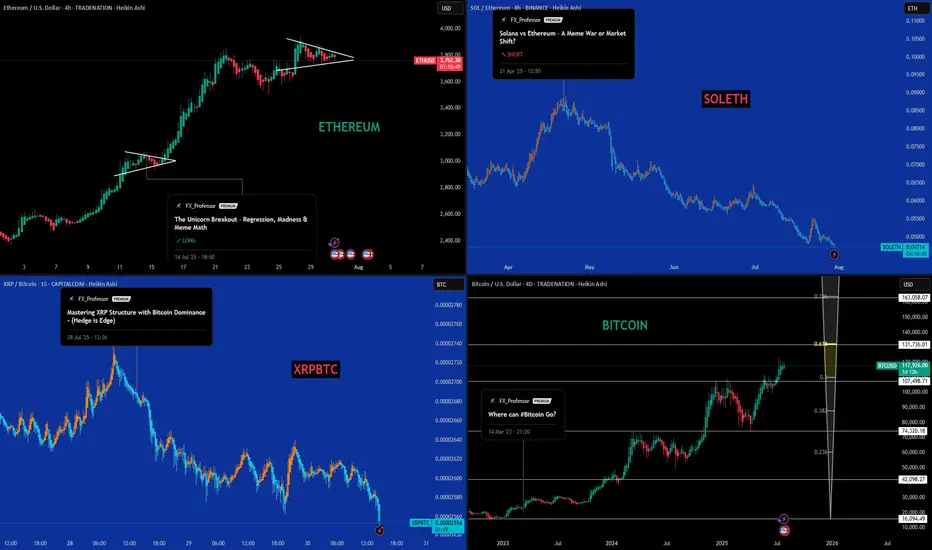
ETF News Meets the Charts: ETH, BTC, XRP, and SolanaFirst you probably want to watch this video:
📊 ETF News Meets the Charts: ETH, BTC, XRP, and Solana 🔥🚀
The SEC’s new in-kind ETF ruling is a macro-level reset. But as always — we bring it back to the charts 📉🧠
Here's the visual breakdown of what I'm watching and why:
🏛️ ETF Approval = Real BTC/ETH Usage Starts Now
✔️ ETF issuers can now create/redeem with actual Bitcoin & Ethereum
✔️ Real spot demand, better arbitrage, and tighter price tracking
✔️ TradFi goes crypto-native — this changes how ETFs settle
But the market? Shrugged.
That’s why we watch price structure — not headlines alone.
📈 What the Charts Are Telling Us:
🔷 Top Left – Ethereum (ETHUSD)
Breakout triangle forming after the unicorn setup at $2,912.
Momentum building for the third breakout attempt at $4,092
🔥 Fuse lit. Target: $6,036
🔷 Top Right – SOLETH
Solana bleeding against Ethereum — just as forecasted months ago.
Rust tech, but memecoin dilution is hurting its institutional appeal. Solana will keep paying for their mistakes and damage done to Crypto!
🔷 Bottom Left – XRPBTC
Wedge breakdown playing out. XRP continues underperforming.
This chart was paired with a BTC dominance hedge — and dominance rose right after. XRP and dark pools is something I will cover..No, i don't like XRP, sorry.
🔷 Bottom Right – Bitcoin (BTCUSD)
Fib extension points to next possible macro leg:
🚀 0.618 = $131,736,
🟡 Final cycle target zone near $163K (or more? or 130k max?..we will find out)
🇨🇳 China: Rumor or Tumor?
Unconfirmed sources say China may be prepping a Bitcoin move. But let’s stay grounded:
🧠 It’s a rumor. Or a tumor.
There’s a 40% chance we get bad news instead — so keep your expectations realistic.
Still, if true, it could mean:
BTC in reserves
Regulated mining zones
Digital Yuan–BTC integration
🧯 Nothing official yet. But timing near the BRICS summit makes it worth watching.
🧠 Key Altcoin Narratives:
🔹 Ethereum L2s (ARB, OP, BASE) – ETF gas pressure = L2 scalability play
🔹 DeFi (UNI, AAVE, LDO) – TradFi flows into real DeFi utility
🔹 Staking Derivatives (LDO, RPL) – Institutions love yield
🔹 Oracles (LINK) – Real-time price data needed for ETF tracking
🔹 BTC Bridges (ThorChain, tBTC) – Infrastructure plays if BTC moves on ETH rails
🚫 What I’m Not Touching:
❌ Memecoins
❌ GameFi
❌ Ghost Layer 1s
📽️ Full breakdown is in my latest video — check it out from the video ideas tab for full context.
Stay sharp. Stack smart. Structure > noise.
One 💙 Love,
The FX PROFESSOR
Disclosure: I am happy to be part of the Trade Nation's Influencer program and receive a monthly fee for using their TradingView charts in my analysis. Awesome broker, where the trader really comes first! 🌟🤝📈