Solana

SOLUSDTAfter achieving the $300 target, the asset underwent a healthy correction. The $150 zone is an important level for buyers. If it holds, Solana can continue its uptrend with targets of $500, potentially forming an ending diagonal

SOLUSDT - Long Trade IdeaTrade Details:
Entry : Buy at the current market price or place a buy limit at $160
Stop Loss : $152
Take Profit :
Reason for Trade:
SOL is showing strong bullish momentum and trading near a key support level.
Potential rebound from the demand zone around $160.
Favorable risk-to-reward setup with a tight stop-loss.
Disclaimer : This trade plan is for educational purposes only and not financial advice. Always conduct your own research and risk management before trading.

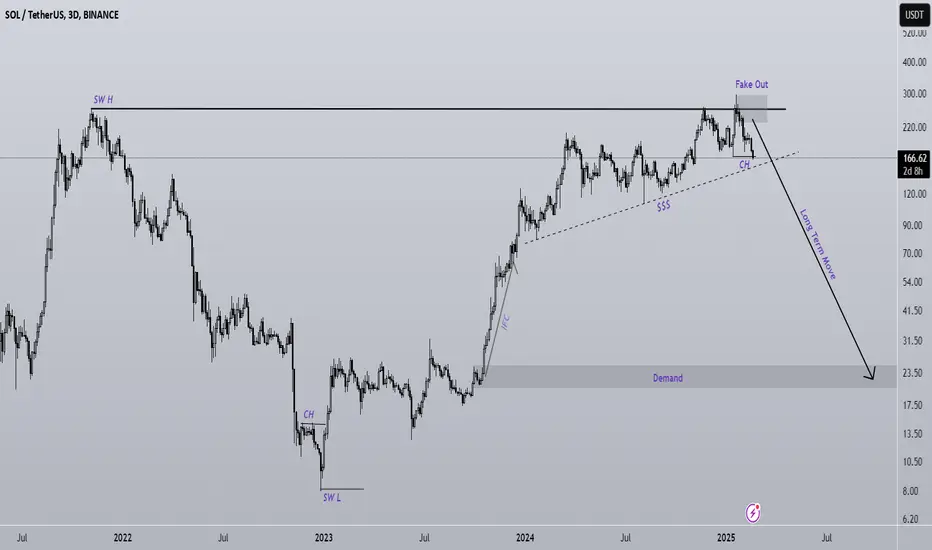
The bearish superwave of SOL has begun (3D)It seems that the The bearish superwave of SOL has begun.
A large liquidity pool has formed below the price, which is likely to break soon.
The all-time high has been broken falsely. This could lead to heavy drops in the weekly timeframe.
In the mid-term and long-term, Solana appears bearish.
Do not enter the position without capital management and stop setting
Comment if you have any questions
thank you
SOLANA Loss of trend line support SOLANA price action sentiment appears bullish, supported by the longer-term prevailing uptrend. The recent intraday price action appears to be an intraday dip below rising support trendline zone.
The key trading level is at 156.00 level, the previous consolidation price range and also the rising support trendline zone. A corrective pullback from the current levels and a bullish bounce back from the 156.00 level could target the upside resistance at 184.50 followed by the 200.00 and 210.70 levels over the longer timeframe.
Alternatively, a confirmed loss of the 156.00 support and a daily close below that level would negate the bullish outlook opening the way for a further retracement and a retest of 150.00 support level followed by 140.00.
This communication is for informational purposes only and should not be viewed as any form of recommendation as to a particular course of action or as investment advice. It is not intended as an offer or solicitation for the purchase or sale of any financial instrument or as an official confirmation of any transaction. Opinions, estimates and assumptions expressed herein are made as of the date of this communication and are subject to change without notice. This communication has been prepared based upon information, including market prices, data and other information, believed to be reliable; however, Trade Nation does not warrant its completeness or accuracy. All market prices and market data contained in or attached to this communication are indicative and subject to change without notice.

SOLUSD: Libra crash is a buy in disguiseSolana is suffering heavy losses these past few days due to the prevailing news regarding Libra and has turned oversold on its 1D technical outlook (RSI = 30.523, MACD = -8.449, ADX = 53.479). Since the long term pattern is a Channel Up and the price is headed for its bottom, while the 1D RSI is at 30.000, which has been a buy signal for over 1 year, this is technically a buy opporutnity in disguise. The similar buy signal of June 23rd targeted the R1 level at the top of the corrective Channel. Go long, TP = 260.00.
## If you like our free content follow our profile to get more daily ideas. ##
## Comments and likes are greatly appreciated. ##

NothingThis is the result of trusting certain politicians !!
Following the crowd isn't always the right move! It might seem bold, but if you take a look at the market, you'll see that even professional analysts have made mistakes multiple times. Still, when the big names on Wall Street say something, everyone listens because it's much easier to rely on an expert's words than to think and make decisions on your own.
If you want to rely solely on yourself, well, your success is yours, but if you fail, you can't blame anyone but yourself. People naturally like to follow others, often without even realizing it. That's why many traders use mechanical trading systems to take decision-making out of their own hands and avoid hesitation.
If you like support me...

SOLANA price is retesting for another bull run?#solana #sol price is now again testing the major support zone. Also, this may be the retest of CRYPTOCAP:SOL price to have another bull run. If #solusd loses 140 usd region , then the invalidation of bullish retest will occur.

SOL Retesting the Descending ChannelBINANCE:SOLUSDT drops back to retest the descending channel.
The last two times it touched this level, it held and bounced up.
Let’s see if it can hold again this time—if not, it might drop to $146.
From the last two experience of bouncing back, we might know if it can hold this key support within a week.
🔴 Read my signature & publications for more info you don’t want to miss.
🔥 for more future "guesses" like this!

SOL/USDT – Critical Reversal or Major Breakdown?🚀 Key Market Insight:
Solana ( BINANCE:SOLUSDT ) is testing a high-stakes demand zone at $156-$162, aligning with major trendline support and previous liquidity grabs. This level will dictate the next big move—a strong bounce could fuel a rally, while a breakdown may trigger a deeper correction.
🛑 Key Levels to Watch:
✅ Support Zone: $156-$162 – Holding above = potential reversal.
🚨 Break Below $154: Could lead to $145-$135 and lower targets.
⚡ Resistance to Reclaim: $182, $195, $204, $212, and $219.
🧠 What to Look For:
🔹 Bullish Signal: Price reclaims $170+ with strong volume → Higher targets unlocked.
🔹 Bearish Signal: Price fails to hold $154 → Expect deeper downside.
🔹 Liquidity Trap? Smart money may hunt stop-losses before a reversal— watch for fakeouts .

Solana Breaks Key Support Level: Is It Time to Sell...?Solana has recently broken through the critical support level of $180 on the daily timeframe, signaling potential further downside. Traders are now faced with whether to take a short position immediately or wait for a retest of the broken support.
For those looking to enter a short trade, the ideal entry zone lies between the $170 and $180 range. With this strategy, it’s recommended to place a stop-loss at $190 to limit potential losses. The primary target for this short trade would be the next major support level around $120, offering a substantial downside potential.
As with any trading decision, caution is advised. Waiting for a retest could offer a better risk-to-reward ratio while entering now, allowing you to capitalize on the initial drop. Stay alert to market movements and adjust your strategy accordingly.

$SOL: warning!**🚨 CRYPTOCAP:SOL Analysis: Major Unlock & Market Impact 🚨**
📅 **March 1st Unlock:**
Approximately 11.16 million SOL tokens (~$2 billion) are set to be released into the market.
🔗 Source: (www.eblockmedia.com)
### **What’s Happening with CRYPTOCAP:SOL ?**
After the $TRUMP pump, Solana faced a significant pullback, which was expected after such hype. However, a more concerning effect of the meme craze is the liquidity drain from the Solana ecosystem.
🔻 **Liquidity Issues:**
- Rug pulls often result in selling SOL for cash, CRYPTOCAP:USDT , or even $CRYPTOCAP:BTC.
- Exchanges like Raydium and Meteora made huge profits from fees in SOL and typically "sell to cash out".
This has led to a liquidity squeeze, causing a prolonged consolidation.
📉 **Technical Outlook:**
- Daily timeframe: Consolidation appears to be ending, and MACD is about to cross bullish, signaling a short-term relief for 1-2 weeks.
- Weekly timeframe: The bearish divergence remains strong and still needs to play out.
- A double top bearish pattern is identified, likely to push the price down.
⚠️ **March 1st Unlock - The Biggest Bearish Factor**
While 11M SOL represents only 2% of circulating supply, it comes at a bad time, adding selling pressure just as the ecosystem struggles with bearish sentiment.
### **Price Outlook:**
🛑 Short-term impact: Likely downside pressure.
✅ Long-term: Solana remains a solid and popular blockchain—it will recover.
**📉 Price Targets:**
- $160 or lower seems likely.
- Worst-case scenario: $120 , which is a major support level.
💡 Potential Buy Opportunity for long-term holders!
**DYOR!**

SOL Biggest Bargain Buy Opp at 50WMAI wrote my thesis on Solana in July 2023 when it was at $25 and memecoins weren't even a thought.
No one even knew what BONK was, but the developer community was thriving, and all the best dApps were being built there.
Now that people are tired of rinsing themselves clean at the casino, it's funny to see them call CRYPTOCAP:SOL ded ~$180💀
SOL is up 625% since I first wrote about it 😂
The blockchain has tremendously improved in every metric, with a plethora of new advancements on the near horizon, including Firedancer 🔥
Buying SOL here at the 50WMA is an absolute gift.
Target is still, and always will be $700-850 within the next 9 months.

$SOL Textbook Bounce off 50WMAI’m not a psychic, just one of the best technicians out there 🤓
I wish I had an account like me to follow in 2017 😜

sol\eth bearish divergenceCRYPTOCAP:SOL \ CRYPTOCAP:ETH Bearish divergence!
Money earned from the casino begins to return to the real store of value!

TradeCityPro | JUPUSDT Is Solana the best dex?👋 Welcome to TradeCityPro Channel!
Let's go together and analyze one of the best dexes of these days, Solana, which handles a high number of transactions and has relatively good performance, because I myself would like it to be one of the coins in my basket!
🌐 Overview Bitcoin
Before starting the analysis, I want to remind you again that we moved the Bitcoin analysis section from the analysis section to a separate analysis at your request, so that we can discuss the status of Bitcoin in more detail every day and analyze its charts and dominances together.
This is the general analysis of Bitcoin dominance, which we promised you in the analysis to analyze separately and analyze it for you in longer time frames.
📊 Weekly Timeframe
We don't have many candles on the weekly time frame, and the reason is that this coin is new and its dex space, but being in this range box is also quite acceptable for this coin.
In the weekly box we are in, there is some sellers' pressure due to the higher selling volume, but since we are in the range box, it doesn't make much difference to us and we can take a position from whichever side it comes out.
To buy again now, after the box ceiling and 1.2535 break, even if you participated in its private sale, it makes sense to cash out some of your tokens and exit, but your main exit point after the break is 0.6951 and you can cash out!
📈 Daily Timeframe
On the daily time frame, we are still in the box range, but we were rejected earlier than the resistance of 1.2681 and are forming lower ceilings and are on the important support of 0.7903
What happened is that after we did not reach our main trigger spot, which was 1.2681, the events of the Trump and his wife's token launch occurred, which both increased the trading volume on these two tokens in this dex and caused fluctuations on this token that these fluctuations can be ignored!
We are on the important support of 0.7903 and this support will essentially be a trigger before the main support trigger and its precursor, and we can open short positions by breaking this level. For buying, the sellers' power is currently very high and we need a change in momentum, which we will update this analysis whenever it happens!
📝 Final Thoughts
Stay calm, trade wisely, and let's capture the market's best opportunities!
This analysis reflects our opinions and is not financial advice.
Share your thoughts in the comments, and don’t forget to share this analysis with your friends! ❤️

SOL The big rotation beginsRug pulls... Allegations against creators and influencers creating meme coins powered by Solana... Developers abandoning a project after pocketing investor funds... The monthly transaction fees spend on SOL are at an all-time high... The rise of dissatisfaction of participants looking for quick profits in the Solana casino won't stop...
All this overrides every fundamental partnership and achievement of the whole blockchain ecosystem and leaves a sour taste in the crypto community's mouth.
More and more people seeking out for longevity: roadmaps, partnerships and active development, and especially third-party code audits regarding red flags in meme coin projects.
Big investors and institutions took profit at the double-top and swapped to other blue-chip coins like ETH or BNB which on-chain activity has just risen steadily over the last weeks while becoming the more safer bets for the upcoming bullrun.
This dump of SOL is just the beginning of what is to come and it just depends on how fast it's gonna come down.

SOLANA is cooked here!SOLANA looks cooked at this point! I’m expecting a massive 70%-90% correction here—any upside from here is just a dead cat bounce. After a +3600% run from the bottom, Solana needs a serious nap before it even thinks about running again. 🚑😂

SOLANA ($SOL) – ROARING REVENUE & FIREDANCER POTENTIALSOLANA ( CRYPTOCAP:SOL ) – ROARING REVENUE & FIREDANCER POTENTIAL
(1/7)
Ecosystem Revenue: Solana’s Q4 2024 app revenue surged +213% to $840M (vs. $268M in Q3), largely driven by meme coin mania. Network revenue reached new highs—$517M in app revenue & $552M in real economic value in January alone! Let’s dig in. 🚀
(2/7) – ONCHAIN ACTIVITY
• DEX Volume in Jan: $339B
• Stablecoin supply: $11.4B
• TVL: $8.6B—all-time highs
• 18 Firedancer validators deployed in Q4, boosting transaction capacity
(3/7) – SECTOR SNAPSHOT
• Market cap: ~$88.6B (late Dec 2024)
• SOL token trades around $200–$300 per recent posts
• Some speculate SOL could hit $500–$1,000—strong fundamentals + revenue growth might point to undervaluation vs. Ethereum ⚖️
(4/7) – COMPETITIVE EDGE
• Outperforms many L1 peers in transaction volume, speed, and revenue
• Handles more transactions than all other chains combined (per X posts)
• DEX volume +150% to $3.3B daily in Q4—low fees & high throughput = user magnet 🕹️
(5/7) – RISK FACTORS
• Market Volatility: Crypto’s rollercoaster can swing SOL prices wildly
• Regulatory: US policy changes, token classification → potential headwinds
• Competition: Ethereum scaling (rollups) & new L1s (Aptos, Sui) loom
• Technical Risks: Firedancer delays or issues = potential network reliability concerns
(6/7) – SWOT HIGHLIGHTS
Strengths:
High TPS + low fees → leading L1 contender
Robust ecosystem growth (TVL, DEX, stablecoins)
Strong revenue: $840M Q4 app rev, $517M in Jan alone
Weaknesses:
Heavy reliance on meme coin activity for recent revenue
Centralization worries due to validator concentration
Opportunities:
Solana ETF approval → institutional inflows 🌐
Firedancer aiming for 1M TPS, tech superiority
Expansion into DePIN, PayFi → new revenue streams
Threats:
US regulatory clampdowns
Ethereum’s scaling solutions & emerging L1 competition
Meme coin hype dying down, revenue from speculation dips
(7/7) – Is Solana undervalued or overhyped?
1️⃣ Bullish—Firedancer + revenue surge = unstoppable 🚀
2️⃣ Neutral—Impressive growth, but watch the meme factor 🤔
3️⃣ Bearish—Competition, centralization concerns… pass 🐻
Vote below! 🗳️👇

Solana Bird's eye viewSolana to me is showing basic high volume crypto chart patterns, to be just a bunch of breaks and retest with easy r:r, pump.fun and these crazy kinda criminal events happening onchain non the less id say much higher but thats just in due time

SOLANA outlook The Week Ahead 17th Feb 25SOLANA price action sentiment appears bullish, supported by the longer-term prevailing uptrend. The recent intraday price action appears to be a sideways consolidation towards the rising support trendline zone.
The key trading level is at 175.00 level, the previous consolidation price range and also the rising support trendline zone. A corrective pullback from the current levels and a bullish bounce back from the 175.00 level could target the upside resistance at 221.20 (20 Day Moving Average) followed by the 242.80 and 260.60 levels over the longer timeframe.
Alternatively, a confirmed loss of the 175.00 support and a daily close below that level would negate the bullish outlook opening the way for a further retracement and a retest of 155.50 support level followed by 136.99.
This communication is for informational purposes only and should not be viewed as any form of recommendation as to a particular course of action or as investment advice. It is not intended as an offer or solicitation for the purchase or sale of any financial instrument or as an official confirmation of any transaction. Opinions, estimates and assumptions expressed herein are made as of the date of this communication and are subject to change without notice. This communication has been prepared based upon information, including market prices, data and other information, believed to be reliable; however, Trade Nation does not warrant its completeness or accuracy. All market prices and market data contained in or attached to this communication are indicative and subject to change without notice.

SOLANA, NEED PUSH ? THEN WHAT WILL BE THE AVG. PRICE ?As per chart price hovering in support but between a range.
CRYPTOCAP:SOL buyers holding money. Need new buyer's ?

#Solana ! What do you think ?As per the chart price are struggling so far. Almost look sideways fo investors not for Intraday traders. Keep eye 👀 on SOLA-ANA.
🪙
#solana
