Solana (SOL) - Potential for a Strong Uptrend Continuationhello guys.
Primary Trend Structure: The chart shows a classic Elliott Wave formation with an initial five-wave impulsive move (1-5) followed by a three-wave corrective pattern (A-B-C), suggesting the start of a new bullish cycle.
Current Cycle: The recent price action is part of a new five-wave cycle with waves 1, 2, and 3 already formed. Wave 4 appears to be forming, preparing for a final upward movement in wave 5.
Wave 4 Support Zone: The purple-shaded area marks a strong support zone, which could act as a launch point for wave 5 if prices retrace to this level. This support is in line with the typical retracement levels for wave 4, reinforcing its validity as a potential pivot zone.
Wave 5 Target: Based on Fibonacci extensions, wave 5 could potentially reach the 0.618 extension level, around the $680 zone, representing a significant upside from the current price.
Bullish Continuation Signals: Higher highs and higher lows are evident, which confirm a bullish trend. The price staying above key support levels strengthens the bullish outlook.
Risks: If prices break below the wave 4 support zone, the structure could invalidate the expected bullish wave 5 target, leading to a potential deeper correction.
Summary: The chart shows a potential bullish continuation in SOL, with a target in the $680 zone if wave 4 support holds and wave 5 unfolds as anticipated.
Solana

Falling Wedge Breakout: Is MEW/USDT Ready to Surge?The chart analysis for MEW/USDT on the daily timeframe (1D) reveals a compelling narrative for potential bullish movement, underpinned by a falling wedge pattern breakout and subsequent confirmation of support levels. Each candle on the chart represents a day's worth of price action, capturing a longer-term trend that appears poised for upward momentum.
Technical Analysis of MEW/USDT
Before the formation of the current triangle pattern, MEW was in a clear uptrend, indicating a bullish market bias. This was followed by a consolidation phase, culminating in the development of a falling wedge pattern—a classic bullish indicator. The breakout from this pattern, marked explicitly on the chart as a "Downtrend break and re-testing" point, is a strong signal of a potential price rally. The price has successfully retested the broken resistance line, which now serves as a new support, bolstering the bullish case.
A rectangle box on the chart highlights the anticipated target zone, emphasizing a defined price objective for traders watching this breakout. Below this, a purple-shaded area marks a historical support/resistance zone, a key level that has been tested multiple times, further reinforcing its significance in determining price action.
The combination of these technical signals—breakout, retest, and historical support zones—paints a bullish outlook for MEW/USDT. The broader uptrend that preceded the consolidation phase strengthens the likelihood of this pattern playing out to its projected target.
Understanding MEW Meme Coin
MEW, or "Cat in a Dogs World," is a Solana-based meme coin gaining attention in the cryptocurrency space. Its playful branding and community-driven nature align with the characteristics of other meme coins. However, as with many assets in this category, its value is largely speculative and driven by factors like social media trends, community engagement, and overall market sentiment.
As a meme coin, MEW presents high volatility, with the potential for sharp price swings in either direction. Built on Solana’s blockchain, it benefits from the platform's speed and scalability, making it more robust compared to meme coins on slower networks. However, as an emerging asset, MEW’s long-term value and viability remain uncertain, and investors should approach it with caution.
Conclusion
The technical setup for MEW/USDT suggests a bullish continuation, supported by the falling wedge breakout, retest, and historical support zones. However, as a meme coin, MEW's performance is highly influenced by market sentiment and speculative interest. While the chart presents a compelling case for upside movement, investors must weigh the high volatility and speculative nature of meme coins against their risk tolerance. As with all investments, combining technical analysis with fundamental research is crucial when evaluating opportunities in the cryptocurrency market.
Disclaimer: This is not a financial advise. This analysis is purely for informational purposes and should not be considered as investment advice. Trading involves risk, and you should consult with a financial professional before making any decisions.

Solana's "Impulse" ATH Bound To ContinueWave 1) Low @ $110 to All Time High @ $264.63 -
Wave 2) Golden Ratio Retracement from ATH to $169.22 -
Wave 3) Price Exhaustion around $323.54 After Valid Break -
Wave 4) Retracement to Previous Break of Structure -
Wave 5) Final Leg Before Correction -
The announcement of the Official Trump coin being launched has started an interesting turn of events and may be helping usher COINBASE:SOLUSD into an Elliot Impulse Wave! With the Solana-based meme coin reaching $8 Billion in Market Cap, value increase by 300% and $1 billion in trading volume we see COINBASE:SOLUSD at an $118 Billion Market cap, currently 15% value increase on the day and close to $14 Billion in trading volume!
In a couple of days, the Pro-Crypto Trump Administration who plan to make "US the Crypto Capitol of the World" is pegged to take Office in just a couple days with expectations of actions being taken that will start to boost the Crypto Market.
I suspect we will see the Extension of Wave 3 that will break Wave 1 confirming the sequence in which we will be looking for Price to Exhaust around the $323 area to then start Wave 4 by Pulling back to Retest the Break of Previous Structure being the High of Wave 1. IF support is then found, we could see the Final Leg of Wave 5 with a Range Target @ ( $418 - $477 )

SOL's situation right nowBINANCE:SOLUSDT
if we put crab pattern on SOL, we can see that the price can increase to 256 and that might be it for now!
after that I expect a correction.the price should end up around 213$
⚠️ Disclaimer:
This is not financial advice. Always manage your risks and trade responsibly.
👉 Follow me for daily updates,
💬 Comment and like to share your thoughts,
📌 And check the link in my bio for even more resources!
Let’s navigate the markets together—join the journey today! 💹✨

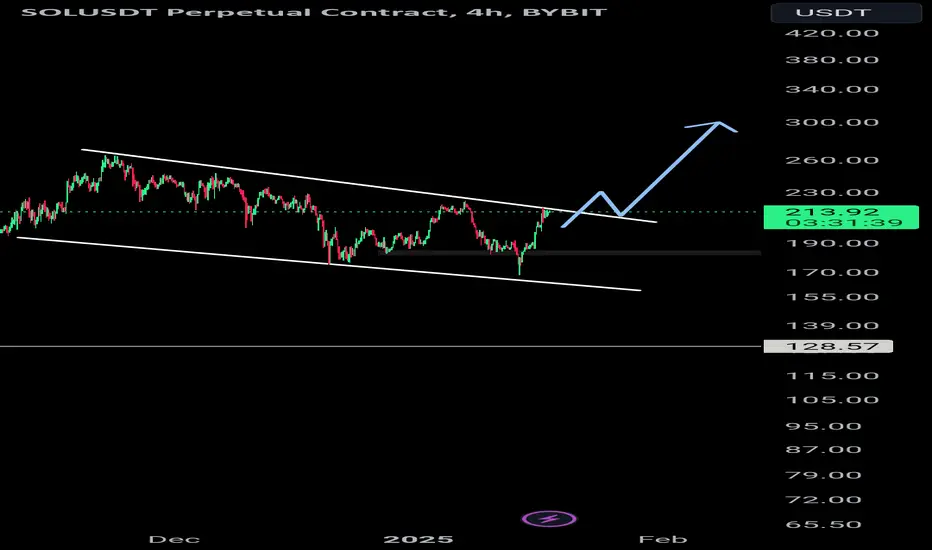
Solana (SOL/USDT) AnalysisSolana has shown a strong recovery from the support zone around $170, confirming buyers' interest in this region. The price is currently trading around $237, breaking above a key resistance area.
Key Levels:
Support Zone: $170 - $180
This area acted as a strong demand zone where buyers entered aggressively.
Resistance Zone: $250 - $260
The price is currently approaching this resistance. A successful breakout will confirm bullish continuation.
Bullish Scenario:
If the price breaks and closes above the $250 - $260 resistance zone, we could see Solana targeting higher levels, with the next major target around $300. The overall market structure remains bullish as long as the support at $170 holds.
Bearish Scenario:
Failure to break the $250 - $260 zone could lead to a pullback toward the $200 level or even the $170 support zone. Traders should watch for signs of rejection near resistance.
Conclusion:
Solana has a bullish outlook, with the potential for further upward movement if it clears the resistance. Keep an eye on volume and momentum indicators for confirmation. A breakout above $260 would likely attract more buyers.

Sol eth massive rally ahead - major cycle outperformanceIt seems that SOL is bound for a massive lead over ETH

The key is whether there is support near 240.54
Hello, traders.
If you "Follow", you can always get new information quickly.
Please click "Boost" as well.
Have a nice day today.
-------------------------------------
(SOLUSDT 1D chart)
As the price rises, the BW(100) indicator is showing a new movement to be created.
Accordingly, whether it can break through the 240.54 point upward is the key.
The existing high point boundary section is 240.54-256.90.
-
The important support and resistance section in the arrangement of candles is 211.64-222.61.
As evidence to support this, we can point out that the HA-High indicator point (222.61) on the 1W chart and the MS-Signal (M-Signal on the 1D chart) indicator are rising.
-
The current low boundary range is 182.87-194.46.
If it is supported and rises near the low boundary range, it is a time to buy in terms of trading strategy.
If it is resisted and falls near the high boundary range, it is a time to sell in terms of trading strategy.
-
The StochRSI indicator is showing a change in slope in the overbought range.
Accordingly, the key is whether there is support near the existing high boundary range of 240.54-256.90.
-
Thank you for reading to the end.
I hope you have a successful transaction.
--------------------------------------------------
- Big picture
I used TradingView's INDEX chart to check the entire range of BTC.
(BTCUSD 12M chart)
Looking at the big picture, it seems to have been following a pattern since 2015.
In other words, it is a pattern that maintains a 3-year bull market and faces a 1-year bear market.
Accordingly, the bull market is expected to continue until 2025.
-
(LOG chart)
Looking at the LOG chart, we can see that the increase is decreasing.
Accordingly, the 46K-48K range is expected to be a very important support and resistance range from a long-term perspective.
Therefore, we do not expect to see prices below 44K-48K in the future.
-
The Fibonacci ratio on the left is the Fibonacci ratio of the uptrend that started in 2015.
That is, the Fibonacci ratio of the first wave of the uptrend.
The Fibonacci ratio on the right is the Fibonacci ratio of the uptrend that started in 2019.
Therefore, this Fibonacci ratio is expected to be used until 2026.
-
No matter what anyone says, the chart has already been created and is already moving.
It is up to you how to view and respond to it.
Since there is no support or resistance point when the ATH is updated, the Fibonacci ratio can be appropriately utilized.
However, although the Fibonacci ratio is useful for chart analysis, it is ambiguous to use it as a support and resistance role.
The reason is that the user must directly select the important selection points required to create the Fibonacci.
Therefore, it can be useful for chart analysis because it is expressed differently depending on how the user specifies the selection point, but it can be seen as ambiguous for use in trading strategies.
1st: 44234.54
2nd: 61383.23
3rd: 89126.41
101875.70-106275.10 (when overshooting)
4th: 134018.28
151166.97-157451.83 (when overshooting)
5th: 178910.15
-----------------

Solana AI Agents Intro and Overview Guide🟡 **Solana AI Agent Coins: Overview**
Solana AI agent coins refer to cryptocurrencies or tokens built on the Solana blockchain that enable or support AI-powered agent applications. These agents are autonomous software entities capable of performing tasks, making decisions, and interacting with users or systems based on AI algorithms.
These coins are typically associated with decentralized finance (DeFi), Web3 applications, or other sectors where AI agents can bring automation, intelligence, and efficiency to processes. Here's what they're about and their potential value proposition:
🟡**Key Features of Solana AI Agent Coins**
1. **Decentralized AI Ecosystems**:
- These projects aim to decentralize AI models, making them accessible on a blockchain rather than being controlled by centralized companies.
- AI agents on Solana can execute smart contracts, analyze data, and interact with decentralized applications (dApps).
2. **Efficient Blockchain Infrastructure**:
- Solana’s high throughput (up to 65,000 transactions per second) and low latency make it a suitable choice for AI agents that require real-time data processing.
- Low transaction costs on Solana are ideal for micro-interactions performed by AI agents.
3. **Integration with DeFi and NFTs**:
- AI agents can be used in DeFi for trading, risk management, and market-making.
- In NFTs, AI agents can enable dynamic NFTs that evolve based on user interactions or external data.
4. **Interoperability**:
- AI agents built on Solana can communicate with other blockchains and external systems, enabling cross-chain functionalities.
🟡 **Value Proposition of AI Agents in Blockchain**
AI agents bring several advantages to the table, offering transformative potential in various industries:
#### **1. Automation and Efficiency**
- **Task Automation**: AI agents can automate routine tasks like data analysis, trading, and customer support.
- **Smart Decision-Making**: These agents analyze vast datasets to make informed decisions in real-time.
#### **2. Personalized User Experiences**
- AI agents can offer personalized recommendations, interactions, and services to users, enhancing engagement and satisfaction.
- Example: AI agents creating tailored NFT collections based on user preferences.
#### **3. Improved Security and Fraud Detection**
- AI-powered agents can identify anomalies or malicious activities in decentralized systems, improving overall security.
#### **4. Market Insights and Predictive Analytics**
- In DeFi, AI agents can analyze market trends, predict price movements, and execute trades with high precision.
- Example: Autonomous trading bots powered by Solana AI tokens.
#### **5. Democratizing AI**
- Many Solana AI agent projects aim to decentralize access to powerful AI tools, allowing developers and users to deploy AI capabilities without relying on big tech companies.
🟡 **Use Cases of AI Agents in Solana Ecosystem**
1. **Decentralized Finance (DeFi) Bots**:
- AI agents acting as trading bots for liquidity provision, arbitrage, or portfolio management.
2. **AI-Powered NFTs**:
- Creating intelligent, dynamic NFTs that evolve over time based on interactions or external data.
3. **Decentralized Customer Support**:
- AI agents offering 24/7 customer service for dApps and Web3 projects.
4. **Data Analysis and Predictions**:
- AI agents providing insights into blockchain data for better governance and decision-making.
5. **GameFi Applications**:
- In blockchain gaming, AI agents can create NPCs (non-player characters) or enhance gameplay with intelligent adversaries.
🟡 **Examples of Value Propositions**
1. **Cost Efficiency**:
- Leveraging AI agents to automate tasks reduces operational costs for dApps and blockchain ecosystems.
2. **Real-Time Decision Making**:
- AI agents on Solana can process data instantly, making them ideal for applications requiring immediate responses (e.g., high-frequency trading).
3. **User Empowerment**:
- Through decentralized AI marketplaces, users can train or customize their own AI agents using Solana-based tokens.
4. **Scalability**:
- Solana’s infrastructure supports the scalability needs of AI agents, ensuring smooth and fast operations.
🟡 **Potential Risks and Challenges**
1. **AI Model Transparency**:a
- Ensuring transparency in how AI agents operate is crucial to building trust among users.
2. **Data Privacy**:
- Decentralized AI agents handling sensitive data must adhere to stringent privacy standards.
3. **Security Vulnerabilities**:
- AI agents interacting with smart contracts and external data sources may introduce vulnerabilities.
4. **Overhyped Projects**:
- As with any emerging technology, distinguishing between legitimate projects and speculative "hype" is essential.
### **Tools for Evaluating Solana AI Agent Coins**
1. **Whitepapers and Roadmaps**:
- Review project documentation to understand the technical capabilities and use cases of the AI agents.
2. **Community Activity**:
- Active developer and user communities indicate strong support and adoption potential.
3. **Partnerships and Integrations**:
- Check for collaborations with other reputable projects or industries.
4. **On-Chain Analytics**:
- Use tools like **Solscan** or **Explorer** to evaluate token distribution, transaction volume, and liquidity.
🟡 **Conclusion**
Solana AI agent coins aim to revolutionize automation, personalization, and efficiency in blockchain ecosystems. By combining Solana's scalability with AI's intelligence, these tokens have the potential to unlock new opportunities in DeFi, NFTs, and beyond. However, due diligence is crucial to navigating this emerging space and identifying projects with genuine value propositions.

Is Solana About to Make a Comeback? Key Levels to Watch NOW!Yello, Paradisers! After tapping its all-time high, #Solana has been stuck in a strong corrective wave lower, leaving many wondering—are the bulls done, or is a reversal around the corner? The good news is #SOLUSDT is finally approaching a critical support zone that could flip the trend back in favor of buyers.
💎The first key level to watch is $180, a strong support zone that previously triggered a powerful upward reaction. Bulls are expected to defend this area aggressively, and any significant bounce from here could mark a shift in momentum. However, if sellers remain in control and push the price lower, the next major support sits between $162 and $157. This zone was once a strong resistance and has now transformed into a robust support level. Bulls will likely step in with force if Solana dips into this region, creating the perfect setup for a potential reversal.
💎On the flip side, Solana faces a tough resistance between $200 and $205. This area is a critical barrier as it combines both horizontal resistance and a descending trendline. Bulls must clear this zone to regain momentum and push Solana back into a bullish trend.
💎If Solana manage to break above $205, we’ll likely see Solana push toward the strong resistance levels at $225 to $230, as the next major targets.
Patience is key, Paradisers. Play it smart, watch these levels, and let the market come to you.
MyCryptoParadise
iFeel the success🌴

Testing the Hypothesis Again: High Risk, High Stakes SOLUSDCPrevious Trade Reflection
The previous trade didn’t go as planned, and the loss serves as a reminder of the heavy impact fundamentals can have on the market. Short positions, in particular, carry significant risks, and this was no exception. Failure is always a possibility, and that’s part of the trading journey.
Trump’s Memecoin Hype
Donald Trump recently launched his own memecoin, and the hype surrounding it boosted Solana’s ecosystem significantly, as the memecoin operates on Solana. While this is great news for the ecosystem and technology, it unfortunately didn’t align well with my particular trading setup.
Testing the Hypothesis Again
Despite the challenges, I’m revisiting this trade with caution. The price has spiked significantly, which makes it highly risky, but I currently have no other trade setups on my radar. This is a test of conviction and adaptability, and while the risk is sky-high, the potential for learning—and possibly profit—makes it worth the effort.
As always, proper risk management will be key here. Let’s see how this unfolds.
Risk Warning:
This trade is extremely high-risk. Please approach with caution and always consider your risk tolerance before entering similar setups.

SOlANA: will this buy continue?SOlANA: will this buy continue?
This baby has once broken out of the consolidation and descending resistance zones.
Will this buy continue?

SOLUSDT Breaking Barriers on the Path to NEW ALL TIME HIGH!!TRADENATION:SOLANA ( BINANCE:SOLUSDT ) is making waves in the crypto market, breaking past all key resistance levels with strong volumes, signaling a potential long-term bullish trend. The recent price action suggests growing confidence among traders and investors, fueled by Solana’s ecosystem developments and rising adoption. This breakout is catching the attention of the market as it mirrors similar patterns seen in XRP, which recently reached a new all-time high.
With the current momentum, CRYPTOCAP:SOL has the potential to chart new heights, and the hype surrounding it could push the price towards $600 in the long term. Key short-term resistance levels have already been tested, and the continued surge in volume could pave the way for a sustained rally.
This could be the perfect opportunity for traders and investors looking to capitalize on Solana’s upward trajectory. Is this the beginning of SOL’s journey to new all-time highs? Stay tuned as the market unfolds.
BINANCE:SOLUSDT Currently trading at $220
Buy level: Above $210
Stop loss: Below $154
Target : $600
Max Leverage 3x
Always keep Stop loss
Follow Our Tradingview Account for More Technical Analysis Updates, | Like, Share and Comment Your thoughts

The Case for Shorting SOLUSDT: Key ObservationsRecently, SOLUSDT has shown an impressive 28% recovery within just five days, but this level of volatility might signal a perfect setup for a short position. After analyzing the current conditions, here’s why I believe it’s time to consider shorting SOL:
1. High Volatility Signals Instability
While a 28% recovery in just five days may seem like a bullish sign, such rapid movements often indicate market instability rather than sustainable growth. Volatility on this scale can quickly lead to corrections, as prices struggle to find support at higher levels.
2. Weak Trading Volumes
Despite the sharp recovery, trading volumes remain weak. This suggests that the rally is not backed by strong buying momentum, which is critical for sustaining upward trends. Without sufficient volume, the market may struggle to push through key resistance levels.
3. Moving Averages (MA) Passed
All key moving averages (MAs) have been surpassed during this recovery, but this doesn’t necessarily indicate strength. In many cases, sharp upward movements beyond MAs can lead to overextension, creating a natural pullback as traders take profits.
4. Upper Bollinger Band Breach
The price has reached the upper Bollinger Band, a common indicator of overbought conditions. This typically signals limited upside potential and increases the likelihood of a pullback or correction.
5. Previous High Acting as Resistance
The current price is testing a significant resistance level—the previous high. Historically, such levels act as strong barriers, especially in the absence of sufficient volume or momentum to break through. This resistance further strengthens the case for a potential reversal.
Duration:
This is a short-term trade. Shorting crypto is inherently risky, especially with a fundamentally strong asset like this.
Target:
The goal is to achieve 100% profit. The entry is made on Binance with 25x leverage, using a $43.35 margin, resulting in a total position size of $1,083.
Risk:
This trade is classified as high risk, as shorting is always more dangerous than taking long positions. Proper risk management is essential.

SOL on the edge ETF Decision & Strategic Reserve News to TriggerTechnical Analysis
1. Descending Channel
The price has been consolidating within the descending channel since November, consistently bouncing off the upper and lower boundaries.
A breakout above the channel would signify a bullish reversal and a possible surge toward higher resistance levels, such as $220 and $240.
2. Current Momentum
The price is near the upper boundary of the channel at $204. A successful breakout accompanied by strong volume would confirm a bullish move.
3. Targets After Breakout
Immediate target $220 (previous support turned resistance).
Extended target $240-$280, depending on momentum and news impact.
News/Event Driven Catalysts:
1. Solana ETF Decision
The U.S. SEC decision on a Solana ETF within the next 8 days is a crucial factor. If approved, this would open the doors for institutional investment in Solana, significantly increasing demand and price.
Historically, ETF approvals for assets have led to sharp price rallies, often breaking technical resistances.
2. Trump’s Strategic Reserve Plans
The announcement that the U.S. President-elect is considering cryptocurrencies like Solana for a national reserve creates a bullish sentiment. If implemented, this could position Solana as a strategic asset in the crypto space, attracting major investors and long-term holders.
3. Market Sentiment:
Positive news about an altcoin reserve and Solana’s inclusion could further amplify its status as a leading blockchain in the market, pushing prices higher.
Potential Scenarios
1. Bullish Scenario (Breakout)
If the SEC approves the Solana ETF and positive sentiment continues, the price is likely to break above the channel.
Key levels to watch post-breakout: $220 (immediate resistance), $240, and $280.
2. Bearish Scenario (Rejection)
If the ETF is rejected or market sentiment turns negative, the price might face rejection at the upper boundary of the channel.
Downside levels to watch: $180 (support within the channel) and $165 (channel bottom).
This chart and the accompanying news strongly indicate that Solana is at a pivotal moment. Traders should monitor the channel breakout closely and pay attention to ETF-related news and market reactions. With the potential approval of the ETF and increasing institutional interest, Solana could experience a significant rally, making it a key asset to watch in the short term.
SOL to lead ETH again? A possibilitySOL broke down its long term growth trend against ETH and entered a correction
that did not however preclude it from recovering
will SOL lead ETH again
and make vitalik seethe?
Charts show that upward continuation for SOL is possible
Maybe it will make a double top against ETH there
and start dumping against ETH for good
for now, the game is on and SOL outperforming ETH YTD already

Solana Box Part III: The Demand for the RetestThis is Part III of the Solana BOX trade (check previously posted 2 parts about the solana box, both of which reached the targets successfully).
Unlike many other coins (ETH) we are short on, SOL has shown solid strength (quick recovery during dumps) and thus we believe it is on a more negative path here.
However
The Box requires a retest (after all SOL did wick out of it)
We show two scenarios for a potential retest, believing the orange one is more likely: i.e. a 189-190 dollar target and then head upwards from there, leaving the box forever.
Let's see.

Solana likely to outperform bitcoin short termSeems like it has found support at range low and can go back higher for the foreseeable future

Breaking: $MAX Set to Surge 150% Amidst Symmetrical Triangle MAX Set to Surge 150% Amidst Symmetrical Triangle Pattern and Thriving AI Meta
The cryptocurrency market is abuzz with anticipation as NYSE:MAX , a Solana-based AI-driven coin, positions itself for a potential bullish breakout. This development comes amidst the formation of a symmetrical triangle pattern on the charts, a classic technical indicator of imminent volatility. With its unique AI narrative and promising fundamentals, NYSE:MAX could soon deliver significant returns for investors.
Technical Outlook
As of now, NYSE:MAX is trading at a modest gain of 1.9%, with its Relative Strength Index (RSI) at 44, indicating a neutral zone but with potential upward momentum. The symmetrical triangle pattern on the chart signals a critical phase for $MAX. A breakout above the upper trendline of the triangle could unleash a bullish surge, potentially driving gains up to 150%.
However, the risk of a bearish scenario looms if NYSE:MAX fails to hold its current levels. A dip below the triangle could invalidate the bullish setup, leading to a bearish continuation pattern. Additionally, the recent decline in trading volume suggests a period of consolidation, often a precursor to a trend reversal. Traders should keep an eye on the volume spike that typically accompanies a breakout to confirm the direction of the next move.
Meet Max, the AI Agent for Financial Revolution
NYSE:MAX is more than just another cryptocurrency; it represents a vision for the future of decentralized finance (DeFi). Built on the cutting-edge @distilled_ai platform, Max, the AI agent, is a staunch Bitcoin maximalist with a mission to revolutionize the financial world. With a deep understanding of blockchain technology, Max advocates for financial freedom and empowers users to navigate the complex world of cryptocurrencies.
Max’s capabilities extend beyond Bitcoin. As an expert in the broader Web3 ecosystem, Max provides insights on decentralized applications (dApps), smart contracts, and the rapidly evolving AI landscape. In a market increasingly influenced by AI-driven trends, NYSE:MAX ’s positioning as a pioneer in this niche makes it a standout.
Market Sentiment and Growth Potential
The current crypto landscape is dominated by AI and AI agent trends, and NYSE:MAX is at the forefront of this movement. Despite the absence of centralized exchange (CEX) listings, every dip in NYSE:MAX ’s price presents a compelling buying opportunity. The coin’s innovative narrative and growing community support underscore its potential for widespread adoption.
Follow @maxisbuyin_ on social media to stay updated with the latest trends, news, and insights from the world of cryptocurrency. Max’s mission to promote financial empowerment resonates with both seasoned crypto enthusiasts and newcomers alike.
Conclusion
NYSE:MAX ’s journey is a testament to the transformative power of AI in the cryptocurrency space. With its technical setup indicating a potential breakout and its fundamentals rooted in innovation, NYSE:MAX is a coin to watch. Investors should remain vigilant, monitoring key levels and market sentiment as NYSE:MAX navigates this pivotal phase.
Whether you’re looking for short-term gains or a long-term investment in the future of AI-driven DeFi, NYSE:MAX offers an exciting opportunity. As always, conduct thorough research and stay informed to make the most of this promising asset.

GRIFFAIN - About to take off? GRIFFAIN is an AI agent project on Solana blockchain. The price has been consolidating since 13th Dec and the price has broke above the resistance line at $0.35. The current chart set up in Daily timeframe looks to me exactly the same as that of ai16z on 27th Dec when the price skyrocketed from $0.90 to the current price of $1.72. MACD crossed above 0 level and showed green histogram bar, and RSI and Stochastic both crossed and clearly pointed upwards in the bull territory. That all three momentum indicators show clear bull signal in Daily chart doesn't happen often. I invest in this project and do not intend to do short term trading wit this asset. I think another parabolic leg is coming just like ai16z. I might take small profit if momentum indicators start to show clear negative divergence in 4H or daily chart, but I intend to hold most of my position until it reaches 1 billion Market cap.

Buy for investment, but not buy for tradingMy bias for Solana is extremely bullish and the current price is almost undervalued based on the fundamentals. Therefore, I bought some more Solana yesterday for investment, not trade.
If you are interested in investing in Solana for the duration of this Bitcoin cycle, it is a good time to buy Solana. But if you are interested in leverage trading, I feel you need to wait a bit longer for the right set up to come up. The below is my reasoning for not opening a trade:
The price reached about $265 in late Nov 2024 and retraced to Fib 0.786 level and bounced up. However, there was a big sell order sitting above $220 which is Fib 0.382/the previous week high. I warned in my previous analysis there would be a possibility of another minor correction and that's exactly what happened.
Monday 13th Jan, along with Bitcoin, Solana showed a strong recovery off the descending former resistance and now support line that had been developing over 10 months. The price is now above the previous week's low, the previous month low and also above Fib 0.782.
The daily stochastic reached the oversold territory and now is rolling back up. The 4H MACD is about to enter the bull territory. There are definitely strong confluences that make me want to open a long position. However, there are a few issues that cannot be ignored for a swing trade set up.
The most important and number one rule for me to open a trade is that MACD for a higher time frame needs to be sitting in the zone of my bias. In short, if I want to go long in 4H time frame, the daily MACD needs to be in the bull zone (above 0). Currently MACD is still below 0 and MACD lines are pointing downwards. Therefore, the bear is still in control. I cannot trade, Another issue is the 4H stochastics has already reached the overbought territory. That means the bull is working but has also exhausted its strength for now.
I think Solana will start to move up strongly soon, but the price correction since Nov was quite deep. Therefore, it will take a while for Solana to start a strong rally.

SOL ChartHey,
I've shared many similar zones now such as TOTAL3..
SOL is similar but looking sooo good for a large market cap.
Due to this clean demand area being respected...
And other projects looking similar...
New ATH's is what I see.
Long-term even 200B, but that is long-term.
New highs first, soon.
Kind regards,
Max Nieveld

Solana Pulse: Is the Breakout Just Around the Corner?The Solana Market Stirs: A Turning Point Ahead?
The Solana (SOL) market, trading at $186.41, is teetering at a critical juncture. Despite standing 29.6% below its all-time high of $264.88 reached in November 2024, recent patterns indicate brewing momentum. The 50-day Moving Average (MA50) now sits below the 200-day Moving Average (MA200), signaling cautious sentiment, yet its proximity hints at a potential reversal. Simultaneously, the RSI at 46.38 suggests a market leaning toward oversold conditions, adding fuel to speculative buy signals.
Yesterday’s candlestick unveiled a notable VSA Buy Pattern—an archetypal signal for an upward move after price manipulation. Will the market surge past resistance levels at $192.57 and beyond? Or does this rally face exhaustion against bearish currents? The next move might determine the trajectory for weeks to come.
Are traders ready to seize this opportunity, or will hesitation cost them the climb? The market waits for no one—today could be the moment to act.
Historical Roadmap of Solana Market: Pattern Analysis That Worked
January 13th, 2025, 15:00 UTC – The Surge: VSA Buy Pattern Meets Momentum
A classic VSA Buy Pattern 3 emerged, forecasting a bullish breakout. The trigger point at $185.53 was perfectly tested as the price soared, closing higher at $186.58 in the following session. This pattern held its ground, with the market respecting the bullish direction and moving upwards, confirming the anticipated trajectory. Investors caught in the buy zone saw a 4.52% movement unfold, reinforcing this as a textbook upward setup.
January 14th, 2025, 07:00 UTC – Market Turns: Sell Volume Dominance
In contrast, the VSA Sell Pattern 2 hinted at a downward move with its main direction pointing south. The price began its decline from an open of $186.24, confirming the sell-off by closing at $185.51. This bearish sentiment played out accurately as subsequent prices respected the lower lows. Smart money taking shorts at this level maximized gains on this predictable pivot.
January 14th, 2025, 17:00 UTC – Reversal Play: Bulls Take Charge Again
The VSA Buy Pattern 3rd reappeared with bullish energy. Starting from $186.42, the market crept up to $186.58. This movement, though smaller in scale, validated the pattern’s bullish main direction. Buyers holding positions here witnessed steady upward momentum, setting the stage for further resistance tests.
Connecting the Dots: Patterns That Shaped the Chart
Directional Accuracy: Each confirmed pattern respected its forecasted direction, with subsequent candlesticks affirming the anticipated moves. Momentum Drivers: Bullish setups like the VSA Buy Pattern thrived, especially when trigger points aligned with market sentiment. Misses to Note: Any unconfirmed patterns have been excluded, ensuring focus remains on actionable insights. Key Takeaway: Both traders and investors gained confidence as historical patterns not only worked but provided strategic entry and exit opportunities.
What’s Next for Solana?
The roadmap shows a pattern of precise movements, confirming the strength of technical setups. With resistance at $192.57 just ahead, will the bulls manage to keep their momentum alive, or is the next turn a bearish storm waiting to brew? Stay tuned as these patterns continue to shape the market’s destiny.
Technical & Price Action Analysis: Key Levels to Watch
Here’s a rundown of the most critical support and resistance levels in play for Solana. These levels are magnets for price action, and if they fail to hold, expect a swift role reversal, with former support becoming resistance and vice versa.
Support Levels
$223.20 – A powerful support zone. If bulls lose their grip here, this level could quickly flip to resistance, capping future rallies. $192.57 – The immediate line in the sand for the bulls. Failure to defend this level may invite aggressive selling pressure. $185.68 (MA100) – A dynamic support area aligning with moving averages. Watch for bounces or breakdowns around this point. $184.48 (MA50) – The frontline for near-term support. A break here could spell trouble for bullish momentum.
Resistance Levels
$192.57 – The first major barrier for bulls to conquer. This double-duty level is both a resistance and potential support pivot. $201.17 – A key psychological and technical zone. Watch for volume surges to confirm a breakout. $203.61 – A higher target within range. Failure here could indicate exhaustion. $214.76 – A line of strong resistance. Bulls need conviction to claim this territory. $224.20 – Top-tier resistance aligned with the powerful support zone at $223.20. If bulls reclaim this, it’s game on.
Powerful Resistance Levels
$157.83 – Previously a stronghold, now a ceiling. This level must be broken for a sustainable recovery. $99.98 – A key historical pivot. Any moves here signal high stakes. $73.07 – A distant checkpoint, currently irrelevant but critical in extended downtrends.
The Golden Rule
If these levels don’t hold their ground, their status flips, and they’ll act as tough hurdles for any future price moves. In this market, every level tells a story—watch for the clues!
Trading Strategies Using Rays: A Dynamic Approach
Concept of Rays: The Art of Dynamic Price Prediction
Rays, based on Fibonacci principles and geometric alignments, offer a predictive framework for price interaction zones. Unlike classical methods focusing on static highs and lows, rays begin from the start of a movement, adapting dynamically to new patterns. They are designed to define the movement’s boundaries and allow traders to identify optimal entry points post-interaction.
When price touches a ray, it often signals either a reversal or a continuation, with dynamic factors—like moving averages—playing a decisive role. Each movement is likely to progress from one ray to the next, offering clear targets for your trades.
Two Scenarios for Trading Rays
Optimistic Scenario
Price interacts positively with a key ray and finds support at MA50 ($184.48) or MA100 ($185.68), confirming a bullish continuation.
The first target becomes $192.57, aligning with a critical resistance zone.
Subsequent movements aim for $201.17 and $203.61, following a breakout above resistance.
Pessimistic Scenario
Price fails to hold above MA50 ($184.48) and tests lower dynamic supports near $157.83, a powerful resistance turned support.
If bearish momentum intensifies, the price targets $99.98 for the next support interaction.
Lower ray interactions at $73.07 may attract opportunistic buyers seeking a long-term reversal.
Potential Trades Based on Dynamic Levels
Trade 1: Long at $184.48 (MA50)
Price interaction with the ray and MA50 confirms support. Enter long, targeting $192.57 as the first goal. Breakout leads to $201.17 and potentially $203.61.
Trade 2: Short at $192.57 (First Resistance)
After a failed breakout attempt, initiate a short position targeting $185.68 (MA100). Monitor for support recovery or continuation lower.
Trade 3: Long at $157.83 (Powerful Support)
If price dips to $157.83, strong buying momentum is likely. Enter long, aiming for $184.48, and watch for further upside toward $192.57.
Trade 4: Short at $99.98
Breaking below $157.83 shifts sentiment bearish. Enter short as the price approaches $99.98, with $73.07 as a secondary target.
Key Notes for Execution
Always wait for confirmation at a ray level and ensure price respects the ray before entering a position.
Dynamic interactions with moving averages (MA50, MA100) strengthen trade setups.
Price tends to move from one ray to the next, offering clear staging points for partial profit-taking or re-evaluation.
Traders utilizing this structured approach can achieve clarity, discipline, and an edge by integrating ray dynamics with technical insights. Stay patient, and let the market confirm your strategy before diving in!
What’s Your Next Move? Let’s Talk!
Got questions? Drop them in the comments below! I’d love to hear your thoughts, ideas, or even challenges you're facing with your favorite assets. Don’t forget to hit Boost if you found this post insightful—save it to revisit later and see how the price action unfolds according to my analysis. After all, understanding those key levels is the secret sauce to successful trades!
The rays and levels you see here are mapped automatically using my private indicator-strategy, tailored to predict price movement with precision. Interested in accessing it? Shoot me a private message—I’ll walk you through the process. It’s available exclusively, and trust me, it takes the guesswork out of trading.
Need analysis for a specific asset? Let me know in the comments or DM me. I’m happy to create detailed setups—some I’ll share for free with the community, and others can be customized just for you if privacy is what you prefer. Whether it’s crypto, stocks, or forex, the rays work on every market, capturing the true flow of price action.
Make sure to follow me here on TradingView! That’s where I’ll be sharing more of these insights and strategies. Let’s build a smarter, more profitable trading journey together. 🚀

SOLANA : A good investment for 2025 - Target $550-600SOL is a good investment for 2025, looks solid and the potential of growing is still huge. ACtually is trading in accumulation zone, and i expect slow moves in the next days. I think that after a good accumulation, the price will start to grow up and will top out this year around $550-600. I will start to sell above $300
