Solana to $260?SOL is testing previous resistance as support around $180.
Reclaiming $184 could signal a test of last week's highs around $206.
Claiming $206 as support could signal a push towards $260.
Losing $180 could signal a retracement towards $165 or 1D 200MA.
Solana

Solana maintains its upward structure ┆ HolderStatBINANCE:SOLUSDT is bouncing from the $170–172 zone, building higher lows just below resistance at $180. The structure is shaping into a rounded bottom with signs of accumulation. If SOL clears $180 with volume, targets lie at $188 and beyond. Trend remains bullish as long as price stays above the local demand zone.

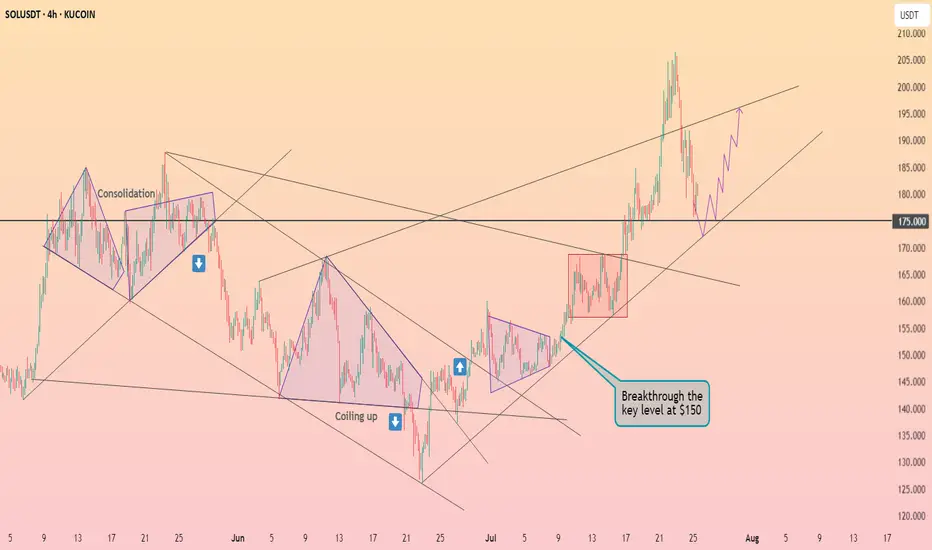
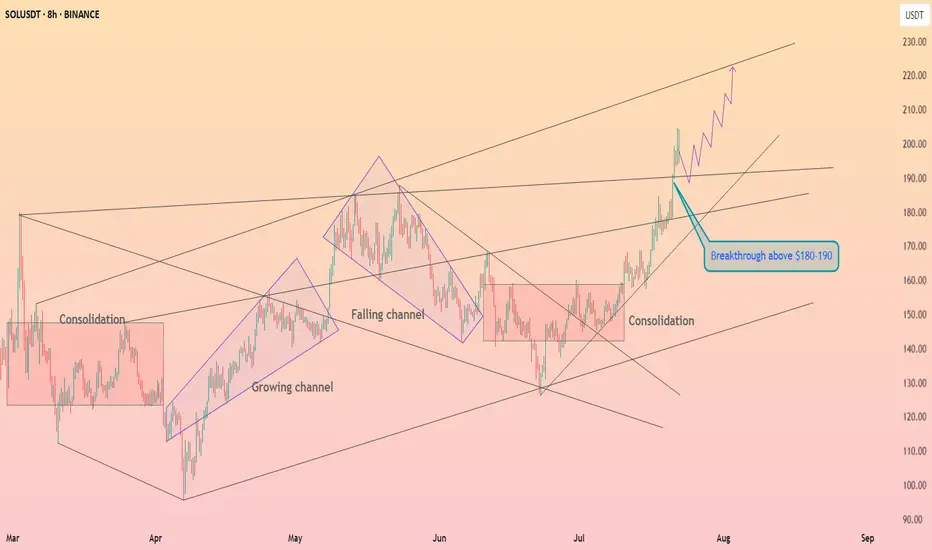
SOLUSD 4H — Holding the Line Before Altseason?Solana’s 4H chart presents a textbook continuation setup — a steady ascending trendline combined with well-defined resistance zones stacked overhead. This kind of compression within an uptrend often precedes explosive expansion, especially when aligned with broader altcoin market sentiment.
📊 Structural Breakdown:
Trendline Support:
Sol has maintained a rising trendline since early June, consistently bouncing off higher lows. This provides a dynamic support zone currently sitting around ~$175–180.
Horizontal Support:
The horizontal box at ~$175 represents prior structure highs turned into support — tested multiple times and aligning with the trendline. A breakdown here would be structurally significant.
Resistance Layers to Monitor:
$215 – Minor S/R flip and local liquidity cluster
$245 – Consolidation ceiling from Q1, where sellers previously took control
$270 – Clean weekly-level rejection from January
$300–310 – Final major resistance from the post-FTX crash range; breakout here signals full bullish expansion
Market Context:
The broader altcoin market is coiling, with majors like ETH and SOL holding structure while BTC ranges. If Bitcoin remains sideways or breaks slightly higher, capital rotation could drive a full “altseason” wave — with SOL as one of the first movers.
🔍 Key Conditions to Watch:
✅ Bullish Scenario:
Price holds ~$175 and breaks above $215 with strong volume
Clean retest of breakout zones confirms continuation
Targeting $245 → $270 → $300 in stages
❌ Bearish Invalidation:
Break and close below $175 trendline support
Would shift bias toward a wider range or even short-term downtrend
⚙️ Indicators to Watch:
4H RSI holding above midline (50) supports bullish continuation
MACD crossover + volume expansion = trigger confirmation
This chart is a reminder that you don’t need to chase green candles — spotting compression structures and planning for breakout zones is where the edge lies. Whether you’re positioning spot or looking for a leveraged entry, this structure rewards patience and timing.

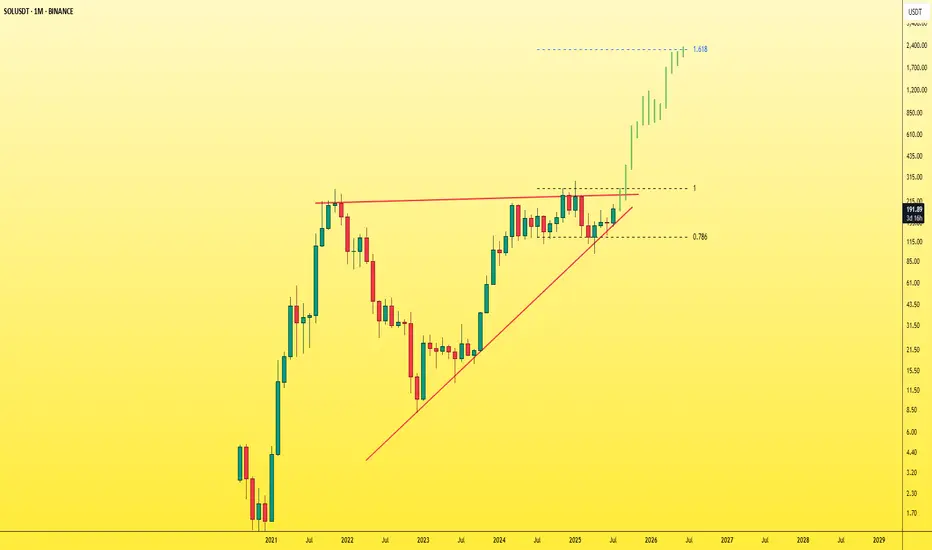
SOL - Don't miss the breakout before it's too late!The symmetrical triangle pattern on the monthly timeframe is showing signs of weakening after multiple failed breakout attempts — and now, a breakout seems highly likely.
Once SOL breaks out of this triangle, it will enter price discovery mode , opening the door to a massive bullish move. At that point, most traders will start saying “it’s too late”, while SOL keeps rallying aggressively — fueled by FOMO and liquidity traps.
You'll see:
- People outside the market waiting for a pullback that never comes.
- Traders inside the move getting shaken out by small dips and volatility.
Right now, SOL is still in a fair trading zone and available at a reasonable price .
Don’t wait for it to explode and then chase. Get in before the breakout .
Best Regards:
Ceciliones🎯
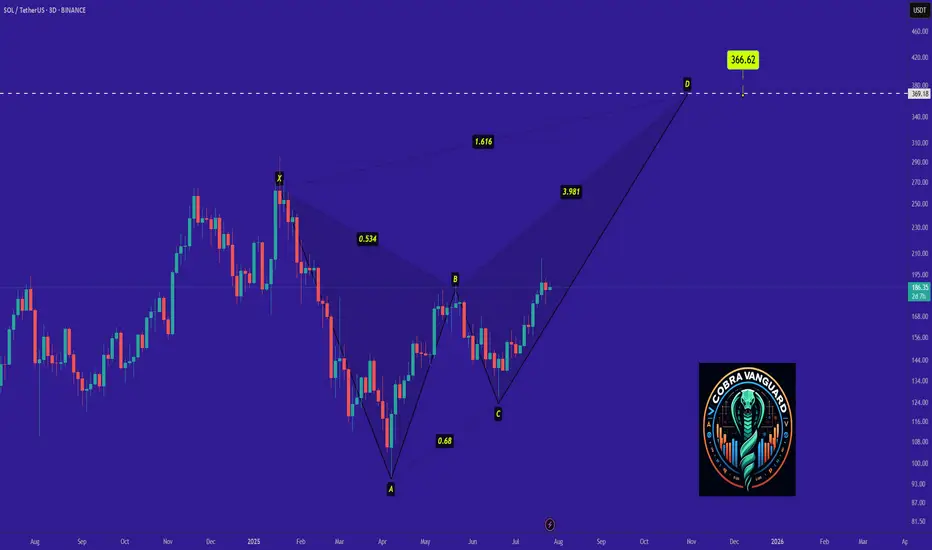
SOL - Time to buy again! (Update)Be careful with SOL !!!
we can hope that the price will act like a Crab pattern and the price will grow well.
I expect that the price will grow very quickly...
SOL/USDT Technical OutlookPrice may push higher towards the $194 resistance zone.
From there, a sharp rejection is expected, targeting the $171 support area.
If the market fails to hold $171, the next potential downside target lies around $140.
Key Levels:
Resistance: $194
Support: $171, then $140
Structure: Rising channel breakdown in play
📉 Bearish scenario activated if $171 fails to hold.

Opened longI opened a long position.
Ideally it is safe to wait for EMAs to line up for the bull trend (EMA21 > 55> 200) in the Daily chart. However, there are many indications that the price will start to move to the upside and the upside move might be quite aggressive. So I decided to open a long position with a small position size.
The reasons for opening a long position:
Daily:
Bull candle has closed above EMA21 for a few times.
RSI lines have crossed and entered the bull zone.
MACD lines are about to enter the bull zone.
Stochastic lines are above to cross and move up.
The price has been staying above Fib 0.236 level for about 10 days.
The price has broke and closed above the descending parallel channel.
4H:
All momentum indicators are in the bull zone.
EMA21 is above EMA 55.
The price has closed above EMA200.
The price is consolidating above the top descending parallel channel.
It is not the perfect bull trend set up, however, there are enough confluences for the price to start to move to the upside.
Entry price: $142.59 (blue horizontal line in 4H chart)
Stop Loss: $130.40 (red horizontal line in 4H chart)
Target: $195 (green horizontal line: Fib 0.5 level in Daily chart and fair value gap zone)
$178 is a strong support and resistance area, so if it starts to stall, I might take a partial profit.
Fingers crossed.

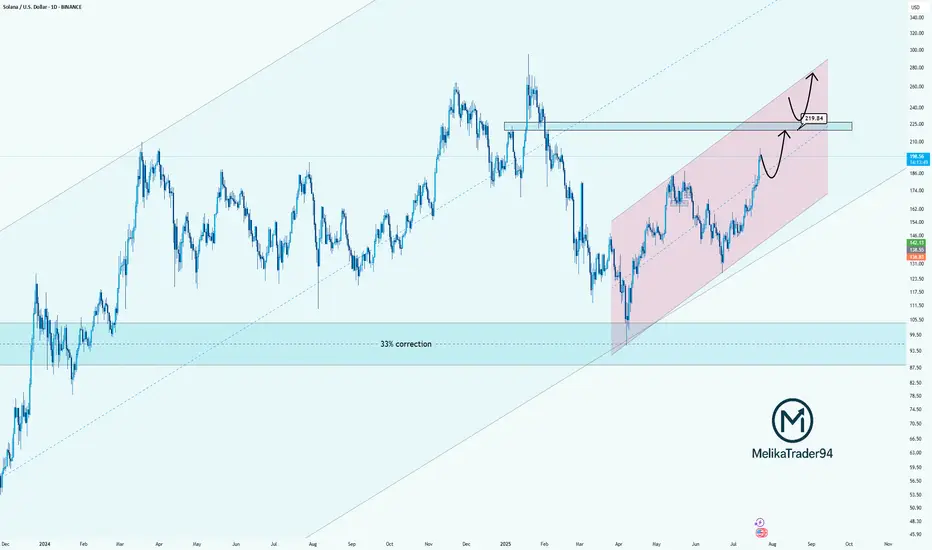
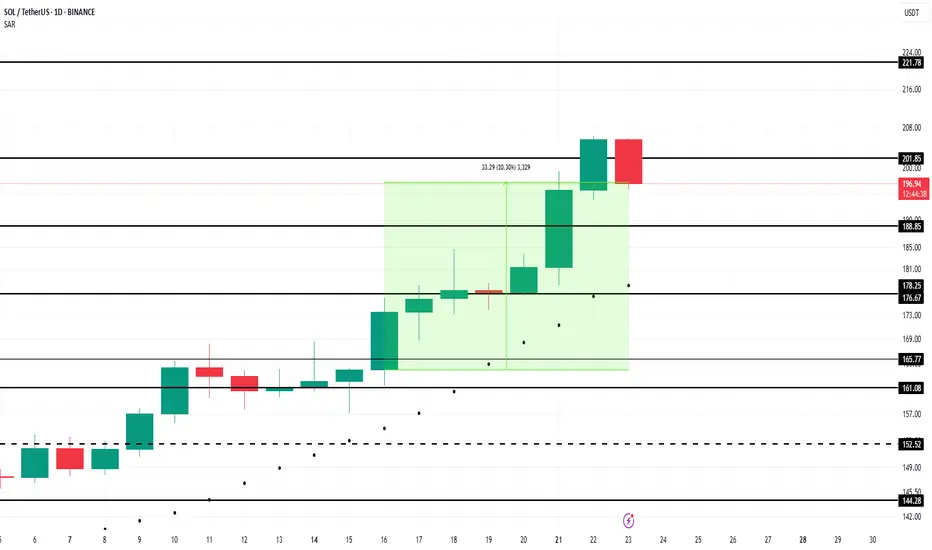
Solana Approaching Key Resistance: watch for $219Hello guys!
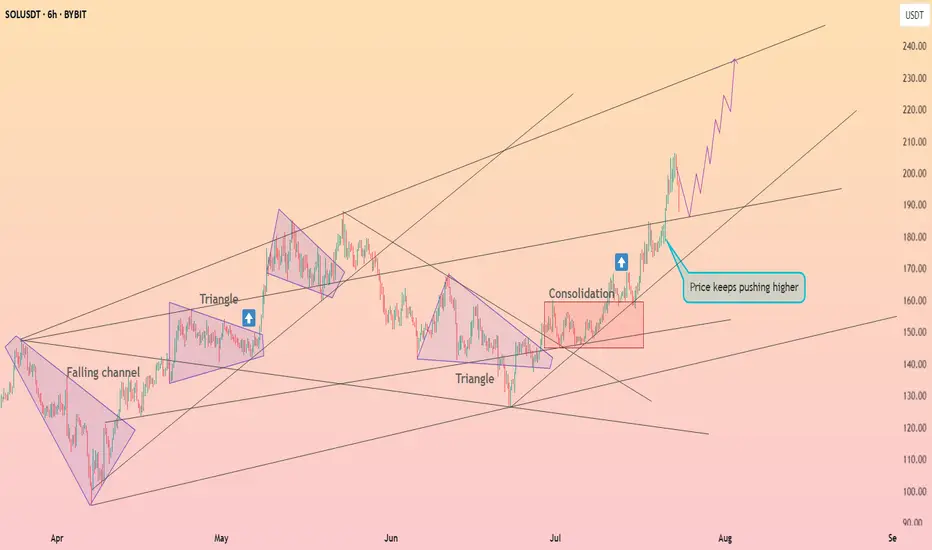
Solana has been trending strongly inside a rising parallel channel, recovering steadily after a significant 33% correction. The bullish momentum is clear, and the price is now approaching a key resistance zone near $219.84, which previously acted as a major turning point.
Here’s what I’m watching:
Strong uptrend within the pink channel shows controlled and healthy growth.
$219.84 is a critical decision zone. Price could:
React with a pullback before pushing higher,
Or break through it and flip the level into support for the next bullish leg.
The reaction in this zone will determine the next structure.
Whether we see a temporary correction or continuation to new highs.
Solana is bouncing back from $175 ┆ HolderStatOKX:SOLUSDT is testing the $180 barrier. Breakout could extend gains to $186. If rejected, $172–$173 may act as reentry zone. Market structure favors continuation.
Solana is preparing to breakthrough $200 ┆ HolderStatOKX:SOLUSDT is trapped between $172 and $180. Break above $180 may unlock $188+. Watch for volume breakout.
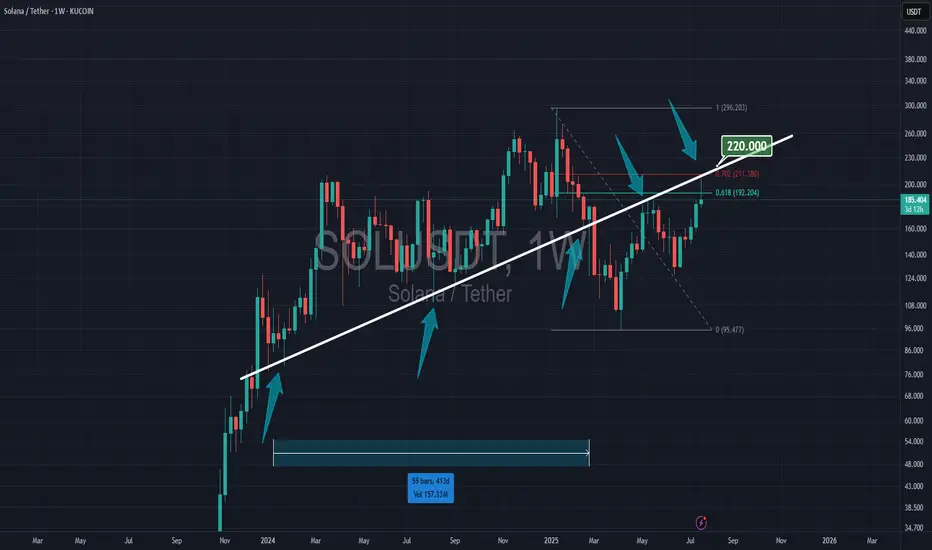
SOLANA & 220 RESISTANCESolana is at 61% of Fibonacci, and the trendline has held since early 2024. To stay in the bull run, Solana must break the 220 resistance.
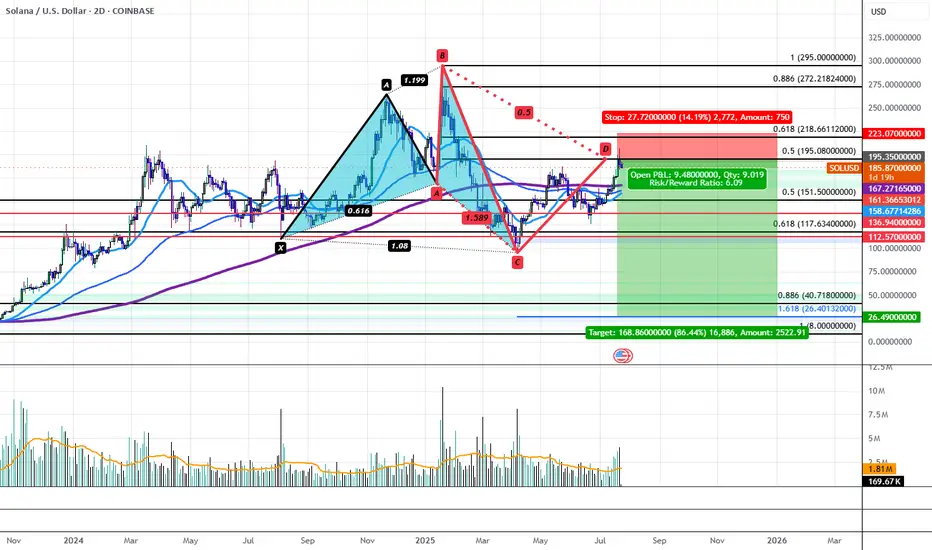
Solana's Bearish 5-0 is Locking in a Bearish Reversal to $26.40Solana has recently run up to Horizontal Resistance Zone of $195-$210 aligning with the PCZ of a Bearish 5-0 and has begun to impulse downwards with volume to back it. This could be the start of a greater move down that would take SOL back to the low of the distributive range at $95.16. If the level breaks, we would then target a drop down to the $40.72-$26.40 confluence area aligning with the all-time 0.886 retrace as well as the 1.618 extension from previous swing low to high. Only at these levels could we even possibly begin to consider Bullish Entries on Solana.
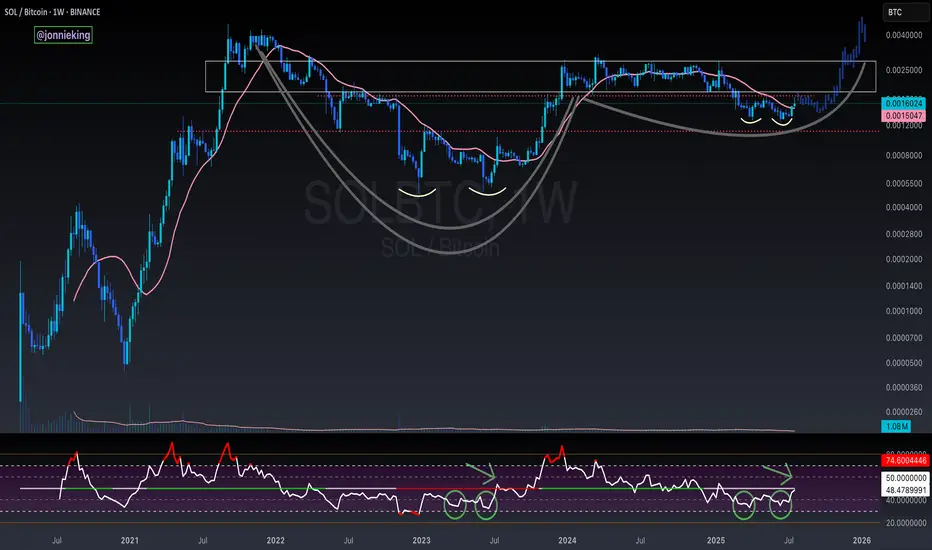
SOL / BTC Cup and Handle Weekly ChartBeautiful cup and handle on the SOL / BTC Weekly chart.
Need to break above the neckline and reclaim the POI.
Double bottom on the RSI matches just before the rip in July 2023.
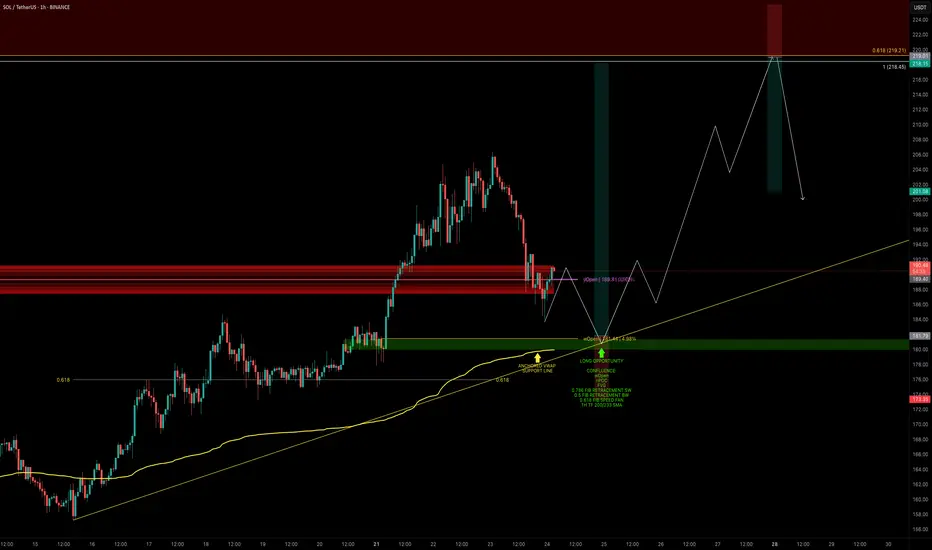
SOL — Bullish Retest in Motion: Time to Strike?SOL has finally broken through the $180 barrier decisively — a key zone it failed to clear back in May.
Now we’re seeing a retest, which may offer one final dip before continuation. Let’s break down the next high-conviction long opportunity.
🧩 Key Retest Zone: $182–$180
➡️ Retesting Prior Resistance as Support
SOL broke above $180 with conviction and is now pulling back.
➡️ First Reaction at $184
A clean bounce occurred at the anchored VWAP, but this might not be the final low.
➡️ Strong Confluence at $180–$182 Zone
This zone is packed with support elements:
Weekly Open (wOpen): $181.44
nPOC: $180.85
Anchored VWAP: ~$179.90
0.5 Fib retracement (of the larger wave)
0.786 Fib retracement (of the smaller wave)
0.618 Fib Speed Fan — projected for tomorrow’s price path
1H 200 & 233 SMAs supporting from below
SOL is currently trading at yOpen — another key pivot level to watch
🟢 Long Trade Setup
Entry: Laddered between $182–$180 (ideal long entry would be at wOpen)
Stop-loss: Invalidation at $173.35
Target (TP): TBFE 1.0: $218.45 / 0.618 Fib retracement: $219.21
R:R: ~1:4.5
Potential Move: ~+20%
🛠 Indicator Used: DriftLine — Pivot Open Zones
For this analysis, I’m using my own published indicator called "DriftLine – Pivot Open Zones " feel free to check it out on my profile.
It helps identify and visualise critical opens (daily, weekly, previous days), providing real-time support/resistance zones.
➡️ You can use it for free — just check my profile under “Scripts” and add it to your chart.
💡 Pro Tip: Support Zones Are Stronger with Confluence
Don’t rely on a single fib or level. When opens, VWAPs, SMAs, and fibs cluster, the probability of a strong reaction increases.
This is how smart traders define clear entries and invalidation.
_________________________________
💬 If you found this helpful, drop a like and comment!
Want breakdowns of other charts? Leave your requests below.
Altcoin Season Has Started. And A Quick Look At The Stock MarketHey Traders,
Time for me to catch you up on the latest price action in both the stock market and crypto as well as touch upon a few changes on my platform and subscription services and what I plan for the future.
Timestamps:
00:00 | Housekeeping - site changes, etc
04:35 | BTC Dominance
06:45 | DXY Dollar Chart
10:00 | SPY
14:25 | BTC Bitcoin Chart
15:45 | Bitcoin Liquidity Heatmap
17:30 | Solana
19:05 | Ethereum
20:20 | Crypto & Stock Trackers
24:25 | My Indicator
26:10 | Where I Went Wrong & How I Plan To Course Correct
✌️ Stew

Solana Price Faces Reversal At $200 As Profits Hit 5-Month HighBINANCE:SOLUSDT price has risen 21% in the past week , now trading at $199. Despite breaching the $200 mark, Solana has failed to maintain this level, marking a five-month high.
The Net Unrealized Profit/Loss (NUPL) indicator for BINANCE:SOLUSDT shows that profits have reached a five-month high . This signals that many investors are in profit, raising concerns about a potential sell-off.
If these factors hold true, BINANCE:SOLUSDT price could decline toward the support levels of $188 or even drop to $176 . A move below these levels could erase a significant portion of the recent gains and shift the altcoin into a bearish trend.
However, if investor confidence remains strong and the market continues to show bullish signs, BINANCE:SOLUSDT could stabilize above $200 . Securing this level as support could propel the price back toward $221, invalidating the bearish outlook.
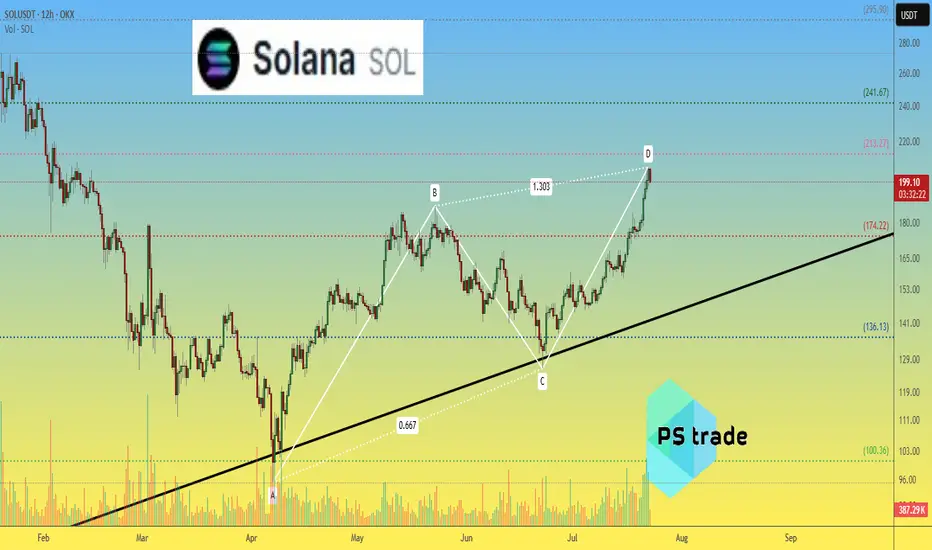
Solana SOLusdt: ABCD Completion & Reversal Candle Forming?The ABCD pattern on the 12H OKX:SOLUSDT chart is nearly complete near $213.
🔻 Current candle attempts to engulf the previous bearish one — an early reversal signal.
📊 Volume is declining after impulse — adding confluence.
📉 Correction targets:
$175 — Fibo 0.5 + support
$136 — consolidation area
$100 — start of CD move
❌ Breakout above $213 invalidates reversal scenario.
_____________________
Did you like our analysis? Leave a comment, like, and follow to get more
SOLUSDT on Fire! Bullish Wedge Fuels INSANE Upside Potential!BINANCE:SOLUSDT has been exhibiting strong bullish momentum, currently trading within a broadening wedge pattern. This technical structure often signals increased volatility and the potential for decisive moves in either direction. In the present scenario, the breakout above the psychological $200 resistance level suggests that bulls are firmly in control, fueling hopes of further upside.
The continuation of momentum hints at the market preparing for another leg up. The immediate price target lies at $300, where traders may expect some profit-taking and resistance. However, should momentum sustain and buying pressure persist, BINANCE:SOLUSDT has the potential to surge toward the $700 region, aligning with the pattern’s projected price expansion.
As always, managing risk is key. Use a well-placed stop loss below the support level to protect your capital. Breakouts can be explosive, but discipline and proper risk management make all the difference.
BINANCE:SOLUSDT Currently trading at $201
Buy level : Above $200
Stop loss : Below $150
Target 1: $250
Target 2: $300
Target 3: $500
Target 4: $700
Max leverage 2x
Always keep stop loss
Follow Our Tradingview Account for More Technical Analysis Updates, | Like, Share and Comment Your thoughts

HolderStat┆SOLUSD retest of the $200 levelOKX:SOLUSDT has cleared $175 and continues pushing higher. $185 is the next key level. Support sits near $169 in case of a pullback.
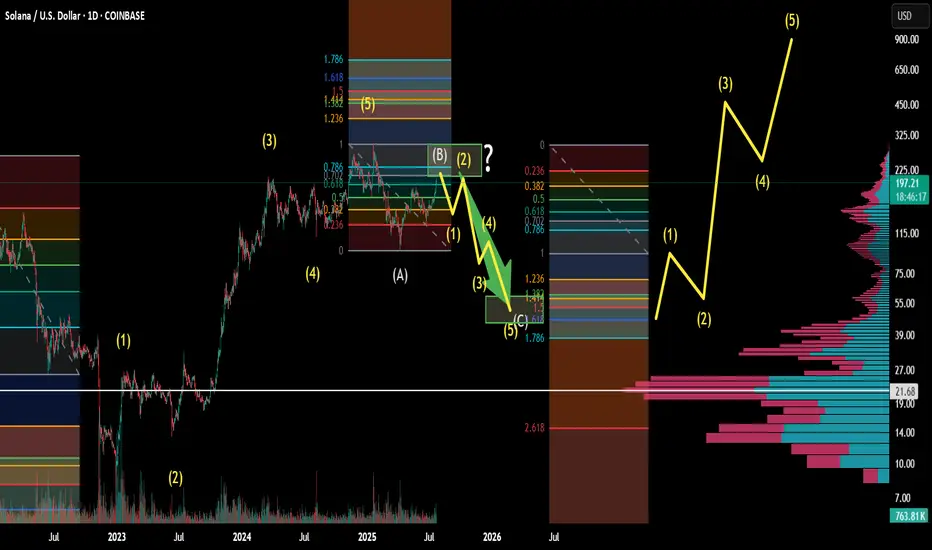
Solana Macro Cycle Elliotwave countTop has been in for solana since going back to ATH. We are in a bear market retrace rally. Looking to scoop between 50-40 about 1 year from now. Let me know what you think below.
Trading alts on solana right now during the retrace rally, then potentially looking to rotate into radix plays or other coins finishing their wave 2's
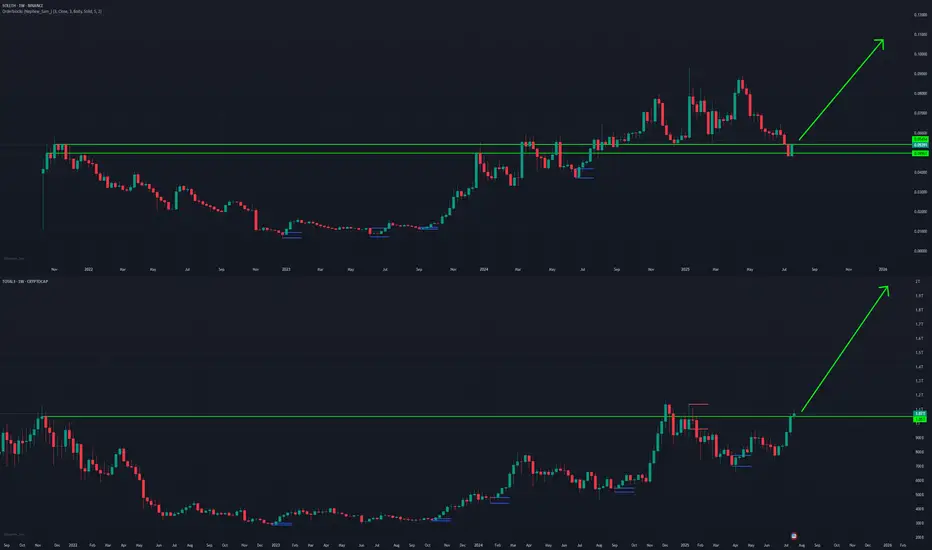
ALT SEASON Cycle Finale Special | SOL/ETH & TOTAL3Our last analysis of BTC.D ⬇️ and ETH/BTC ⬆️ () is now playing out, and we are entering the final stage of the 4-year crypto cycle -- ESCAPE VELOCITY for the rest of the crypto market.
As money flows up the risk curve, expecting SOL to outperform ETH from here, and the rest of the crypto market to outperform majors.
Welcome to the cycle finale special!
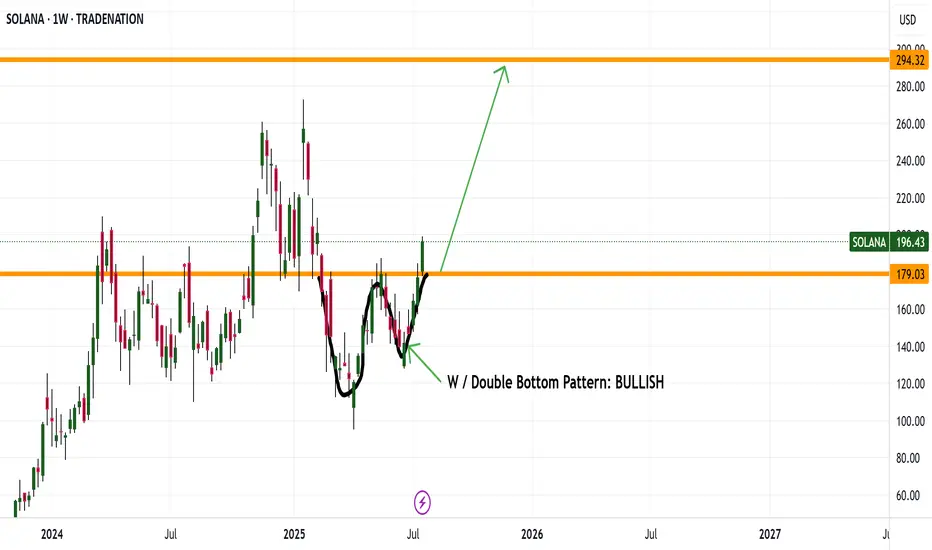
SOLANA DRIVING UP TO 294 Good evening everyone
It looks like SOL made a nice W pattern and now breaking its weekly high is driving up to 294
Enjoy happy trading this bull run
Kris/ Mindbloome Exchange
Trader Smarter Live Better