BTCUSD BITCOIN CRYPTO Short US inflation is due to back Fed pause after robust jobs data
Bonds stabilize after rout triggered by bets on fewer Fed cuts
Wall Street Sees Dollar Rallying Further as Trump Enters Stage
Bonds and Treasuries skyrocket
Inflation heating
FED possible interest rates hikes,but no cuts
Solana

$ZACK: Poised for a 500% Price Surge Amidst Market VolatilityZack Morris, a name that resonates with Wall Street’s meme culture, has taken the leap into the blockchain world with $ZACK, a cryptocurrency that combines humor, financial strategy, and technological innovation. Known for squeezing shorts and making millions through meme trading, Zack Morris has brought his charisma and expertise to the crypto realm. Now, $ZACK is gaining momentum with technical and fundamental indicators signaling a bullish reversal, making it a token to watch closely.
About Zack Morris and $ZACK
Zack Morris is an iconic figure in meme trading, renowned for his ability to navigate market volatility and capitalize on opportunities. $ZACK, his namesake cryptocurrency, aims to blend the allure of meme culture with solid financial strategies. Built on the Solana blockchain, $ZACK seeks to revolutionize the meme coin landscape by leveraging Solana’s speed, scalability, and low transaction costs. This unique combination positions $ZACK as more than just a meme coin; it is a potential game-changer in the crypto space.
Technological Backbone of $ZACK
$ZACK’s foundation on the Solana blockchain ensures high performance and security. Solana’s Proof of History (PoH) mechanism timestamps transactions for efficient processing, while its Proof of Stake (PoS) system secures the network. These features enable $ZACK to handle thousands of transactions per second, making it an ideal platform for scaling and adoption. Additionally, Solana’s decentralized architecture and cryptographic security enhance the token’s reliability and resistance to malicious attacks.
Real-World Applications and Market Impact
While $ZACK’s primary appeal lies in its meme-driven narrative, its integration with Solana provides the potential for real-world utility. The coin’s humor and cultural significance attract a diverse community, from traders to meme enthusiasts. This dual appeal fosters engagement and liquidity, creating a robust ecosystem around $ZACK. Furthermore, the involvement of Zack Morris as a prominent influencer amplifies the token’s visibility and market presence, making it a focal point in the cryptocurrency community.
Technical Analysis
$ZACK’s chart reveals a steep falling wedge pattern, which has persisted from June 2024 through January 2025. This pattern, coupled with an RSI of 37, suggests that $ZACK is oversold and primed for a significant breakout. Falling wedge patterns are typically bullish reversal indicators, and $ZACK’s prolonged consolidation within this pattern strengthens the case for a potential 500% price surge.
Adding to the bullish sentiment are recent CEX listings, including Poloniex, which enhance $ZACK’s accessibility and trading volume. The token’s 24-hour trading volume of $75,648.93 represents a 53.90% increase, signaling growing market interest.
Fundamental Catalysts
The inauguration of pro-crypto U.S. President Donald Trump has created a favorable environment for the cryptocurrency market. This political shift, combined with $ZACK’s meme appeal and strong technological foundation, positions the token for substantial growth. The broader crypto industry’s anticipation of value investing in promising assets further reinforces $ZACK’s potential.
Conclusion
$ZACK is not just a token; it is a movement that merges meme culture with blockchain innovation. With its strong technological base on Solana, growing market interest, and bullish technical indicators, $ZACK is poised for a significant price surge. As market volatility creates opportunities, $ZACK stands out as a compelling investment for traders and enthusiasts alike. The combination of humor, strategy, and innovation makes $ZACK a token worth watching in the evolving crypto landscape.

$SOL on supportCRYPTOCAP:SOL on dayli support and 200ema (yeah I use 200ema a lot :) )
it can growup

Solana Double Bottom: Looking For A Break Of The Range High!Solana has formed a double bottom with a dip below, suggesting a potential bullish move could be on the horizon. This pattern indicates a possible trend reversal. I'm watching for a break above the range high, followed by a retrace to retest the range high on the lower timeframe, with a potential continuation to the upside. Monitor the Fibonacci pullback to the 50-61.8% level on the previous four-hour swing for a possible bullish entry. This is not financial advice.

Solana (SOL) Analysis: Fundamental and Technical Breakdown📊 Solana reached its all-time high (ATH) of $264 on November 22, but has since entered a corrective phase, experiencing price volatility in recent weeks. In this analysis, we will explore both the fundamental and technical aspects of this popular cryptocurrency to uncover potential trading opportunities.
Fundamental Analysis 🔄
1. Anticipation of a Solana ETF: Major financial institutions like VanEck and Grayscale are competing to launch a Solana ETF. The U.S. Securities and Exchange Commission (SEC) is expected to announce its decision by January 2025. With a 77% estimated chance of approval, this could positively impact SOL’s price.
2. Total Value Locked (TVL) :Solana's ecosystem has seen a consistent rise in its TVL throughout 2024, driven by ecosystem expansion and the launch of meme coins on its blockchain.
3. Market Sentiment and Volatility: Investor sentiment towards Solana remains mixed. The Net Unrealized Profit/Loss (NUPL) indicator suggests holders are cautious. Entering the fear zone may create buying pressure opportunities.
Overall, Solana’s fundamentals indicate significant growth potential, but traders should also be mindful of existing challenges.
Technical Analysis 🔢
Weekly Timeframe:
Solana is trending within an ascending channel, showing strong momentum and volume.
After correcting from its ATH of $265, SOL has reached the channel’s midline.
As long as SOL remains above the key support zone of $150-$165 , traders can seek long opportunities for both futures and spot holdings.
Daily Timeframe:
A breakout above the $245 resistance could signal a strong buying opportunity for holding positions.
If a deeper correction occurs, this level might adjust, and updates will follow.
4-Hour Timeframe:
Recent price fluctuations stem from U.S. job market news, strengthening of the DXY, Bitcoin’s decline, and rising BTC dominance.
A breakout above $202 could trigger a long position, contingent on traders confirming their setups.
Trigger Confirmation Tips:
Method 1: Watch for a rejection at resistance, and enter on the next breakout.
Method 2: Enter on a successful retest (pullback) post-breakout.
For short positions, watch for a breakdown below the $160 support zone.
🚀 Solana presents promising opportunities backed by solid fundamentals and technical setups. However, managing risk and waiting for proper confirmations remain crucial. Are you ready to capitalize on Solana’s next move? Share your thoughts in the comments!
I’m Skeptic , here to simplify trading and help you achieve mastery step by step. Let’s keep growing together!

SOLUSD overview and market outlook expecting BOUNCE🔸Hello traders, today let's review 12hour price chart for SOLUSD . pullback/correction in progress with limited upside currently, however expecting a bounce next week.
🔸Trading right now at 185 usd, strong bullish liquidity located near OBs 150/155 usd. bulls will likely take over once we trigged the liquidity order blocks below market.
🔸Recommended strategy: BUY LOW near liquidity OBs 150/155 usd, TP bulls is fresh overhead liquidity at 200/210 USD. expecting decent bounce in this market.
🎁Please hit the like button and
🎁Leave a comment to support our team!
RISK DISCLAIMER:
Trading Futures , Forex, CFDs and Stocks involves a risk of loss.
Please consider carefully if such trading is appropriate for you.
Past performance is not indicative of future results.
Always limit your leverage and use tight stop loss.

SOL waiting for 180,1$I closed my TON position with a +22.5% profit a nd SOL with +39.55% profit , all within one day. This was during an extremely volatile period, making it one of the most challenging trades, as both the stock and crypto markets faced significant pushback yesterday.
At one point, I saw a -100% unrealized loss, but the order setup allowed me to recover and secure profits.
Currently, the market appears to be leaning downward, with bulls trying to defend key levels: BTC at $90k-$93k, SOL at $180, and TON at $5-$5.2. These levels have been tested multiple times, but liquidity ultimately dictates the game.
For now, I’m staying cautious and I do not enter into a deal. However, I’m setting an order for Solana at $180 with 25x leverage and a $30 margin, assuming SOL might dip again and recover quickly.

Fart is starting to pop - buy? Fart just formed higher high in the daily chart. Stochastics (9,3,3) reached the overbought territory and are moving up. The price also closed and moved above the previous week mid.
The next hurdle for the bull is to move above the the previous higher high which is the previous month high at $1.30 area.
Daily MACD is in the bull zone and daily stochastics are resetting, which signals the upside momentums are building up.
The 4H MACD is entering the bullzone, but the only problem is 4H stochastic has already reached overbought territory. Once the stochastics comes down, resets and starts to move upwards, it might be a good area to open a long.
My general trading rules are below:
I use two time frames - weekly/daily and daily/4h.
1) MACD in the higher timeframe needs to be in the bull territory which is above 0. The angle of MACD is not important. It needs to be in the bull zone.
2) Stochastics (9,3,3) in the higher timeframe needs to reset and stochastics needs to cross and starts to move upwards. It cannot be in the overbought territory.
If these two conditions are met in the higher time frame, I go to the lower time frame to start looking for an exact entry point.
3) MACD lines in the lower timeframe properly cross and enter the bullzone or cross and move upwards above the bull zone. And ideally the stochastics in the lower time frame hasn't reached the overbought territory.

ai16z - bottom is in? ai16z has been going through a major price correction. The price retraced to $0.91 at Fib 0.786 level (the last line of defence for the bull) and bounced up. All momentum indicators reached oversold territory and broke up the descending trendline. There are some signs of strength, however, it is still too premature to open a long position.
When the price goes down significantly and tries to recover to the upside, V shape recovery is quite rare. It usually goes through a very choppy consolidation phase and works its way through to the upside.
Once way to identify the trend reversal for me is to use a Fibonacci retracement line. When I think the price has hit the bottom, I draw a Fib from the suspected top to the suspected bottom. In this case, from $2.30 to $0.91 (Orange colored fib line in the chart). When I analyse the chart with Fib level, the first thing I pay attention to is if the price will decisively break and close above 0.236 level. When it does, it often moves up to the 0.5-0.786 zone. But I need to look for more confluences as below:
1) I need to wait for the daily stochastics (9,3,3) to reset and start to move to the upside.
2) 4H MACD lines cross, point upwards and enter the bull zone (above 0).
3) 4H Stochastics is not overbought territory. If it is, the price is likely to retrace at least one more time.
If those three conditions are met and the price also breaks above 0.236 fib level, it is likely to give me a good entry for long.

Solana - almost, but not ready for long yet Bitcoin bounced off the key support area very healthily in the last US session and most alt coins also showed a sign of strong recovery.
I felt tempted to enter the market. It is nice to buy low, but I need to follow my own simple and basic rules. Although it is tempting, Solana's current chart set up is not quite ready for long for me.
I use two time frames - weekly/daily and daily/4h.
My rules for long Solana:
1) MACD in the daily timeframe needs to be in the bull territory which is above 0. The angle of MACD is not important. It needs to be in the bull zone.
2) Stochastics (9,3,3) in the daily timeframe needs to reset and stochastics lines need to cross and start to move upwards. It cannot be in the overbought territory.
If these two conditions are met in the higher time frame, I go to the lower time frame to start looking for an exact entry point.
3) MACD lines in the lower timeframe properly cross and enter the bullzone or cross and move upwards above the bull zone. Green vertical lines I drew in the chart are good examples.
Currently, the daily MACD lines are in the bear territory. Not only that, the lines are pointing downwards, I can see the signal line is starting to move up and the daily stochastic has reached the overbought territory.
My overall bias for Solana is definitely bullish and I am heavily investing in the asset, however, I need to wait a bit longer if I decide to add more to my portofolio.

Correction Is Finished For Solana SOL, $300+ Is NextHello, Skyrexians!
Today it's time to observe BINANCE:SOLUSDT the most overbought crypto of 2024. Today we will not try to guess where is going to be top and bottom, look at the local picture instead because in the short term it's about to show the significant growth.
Let's take a look at 12h time frame. We can mark the previous impulse with the green. Decrease from the top can be counted as a correction because of its ABC Elliott waves structure. Now the Bullish/Bearish Reversal Bar Indicator can print the bullish green dot which inside the Fibonacci support level can be the strong reversal sign. As always, alerts from this indicator are automatically replicated on my accounts. You can find the information in our article on TradingView . If reversal will be confirmed, the next target is somewhere above $300. When price will reach it we make an update.
Best regards,
Skyrexio Team
___________________________________________________________
Please, boost this article and subscribe our page if you like analysis!

SOL/USD LONGSOL/USD LONG
entry 1- 174.50
entry 2- 164.50
sl 149.50
take profit 1- $184.50
take profit 2- $204.50
take profit 3- $224.50
take profit 3- $244.50

Identify Memecoin scams complete guide🔸Learn to identify memecoin scams effectively by recognizing red flags, using essential tools, and understanding various scams like airdrop scams, honeypots, and MeV attacks. The video offers insights from an experienced trader and provides access to a master list of meme coin trading tools for safer trading practices.
🔸Crypto scams are rampant, especially targeting traders unfamiliar with red flags. Knowing these scams can save you from losing your hard-earned money in the meme coin market.
🔸Airdrop scams are common, where scammers send fake tokens to wallets. Interacting with these tokens can lead to a complete drain of your wallet.
🔸Avoiding certain wallets for meme coin trading is crucial. Fantom, while popular, may expose traders to more risks compared to faster and more secure alternatives.
🔸Identifying scams in the cryptocurrency market requires vigilance on token activity and chart patterns. Recognizing indicators such as rug pulls and honeypots can protect investors from losses.
🔸Rug pulls often manifest through sudden price spikes with no selling activity, indicating potential manipulation by developers. This pattern serves as a red flag for investors.
🔸Honeypots are tokens that allow buying but prevent selling, trapping investors. Understanding this concept is crucial for avoiding scams.
🔸Verifying the legitimacy of a token involves checking for duplicate tokens and ensuring liquidity is locked. These steps help ascertain the safety of investments.
🔸Analyzing social media presence is crucial for determining a developer's reliability. Active communication and transparency on platforms like Twitter can indicate a legitimate project.
🔸Using bots to check the history of Twitter accounts can expose recycled profiles often associated with scams. This method enhances the security of investment choices in crypto.
🔸Community takeovers often occur after a developer rugs, allowing the community to reclaim control and potentially revitalize the project. This can lead to a more decentralized management.
🔸Verifying the authenticity of a project's website is crucial. Scammers may create fake sites, so utilizing domain age checkers helps to ensure the legitimacy of the information.
🔸Understanding the dynamics of token holders is crucial in the crypto market. Analyzing the behavior of bundle snipers can reveal potential risks associated with token investments.
🔸Analyzing token holders and their activities can help identify potential red flags. Tools like trench radar scanner assist in monitoring bundle activities and assessing risks.
🔸Visualizing bundle data can enhance decision-making in token investments. Understanding the distribution of holdings among wallets helps assess the stability of a token.

$SOLUSDT LONG AGAINWell, this is quite interesting. Two successful SOL trades, and now I’m ready to try for the third. We’re back in the game! During the night, we saw a nice correction, and it’s a good time to note that the underlying narratives haven’t changed.
Let’s stick to the same strategy as before:
Duration:
This trade can be either short-term or long-term, depending on your goals. You could also consider entering as an investor in the SOL ecosystem, which allows you to average down costs in case the trade doesn’t go as planned. The key here is to monitor funding rates, especially if you’re planning to hold for a longer period.
Target:
The goal is to achieve 100% profit. The entry is made on Binance with 25x leverage, using a $37 margin, creating a total position size of $950.
Risk:
This trade is classified as medium risk, particularly if you’re ready to use dollar-cost averaging (DCA) to manage the position. This time, I’ve added an extra layer of caution by limiting potential losses to 60% of the deposit.

SOLUSD - get down Certain arguments will certainly make a difference, but they are unlikely to change the course.

Trading opportunity for SOLUSDTBased on technical factors there is a Buy position in :
📊 SOLUSDT
🔵 Buy Now or by Breakout
🪫Stop loss 184.90
🔋Target 201.00
📏 R/R 2
💸RISK : 1%
We hope it is profitable for you ❤️
Please support our activity with your likes👍 and comments📝

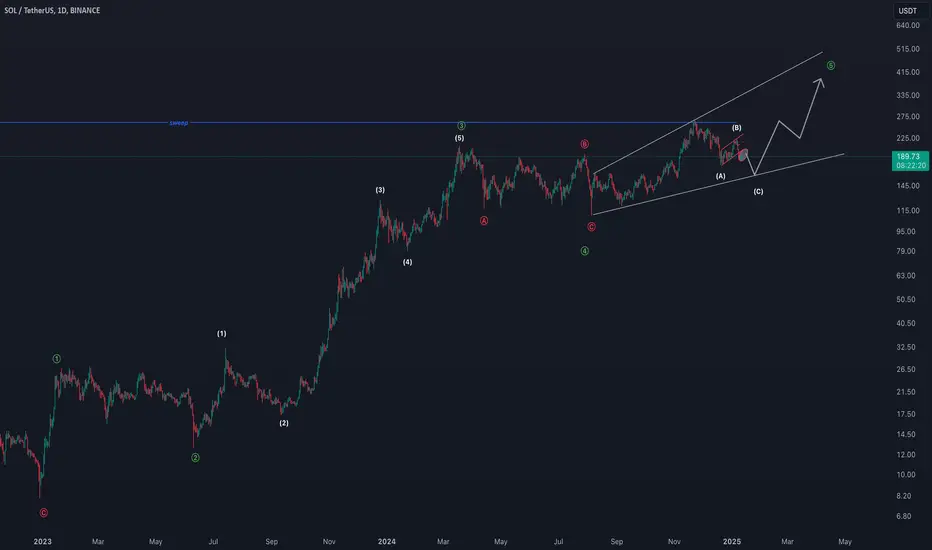
SOLANA EW COUNTMy view of SOLANA
IMO wave 5 is developing
Structure is a bit complicated but hight probability for ending diagonal here
Join my X for more charts
SOLANA Break down the minor trend line!Recommend R:R= 1:2 or 1:3
Always use money management!
There is nothing probability of chart pattern above 70% (in other words there is a possibility of failure)

Re-entering the SOL Trade: A Strategic MoveYesterday, our SOL idea played out brilliantly, delivering a 65% profit in just 12 hours . While I didn’t hold out until the initial target, I want to be clear about my approach—I calculate not just price movements but the time frame as well. If I see rapid growth within a few hours that yields more than 50% of my deposit, I consider it a solid trade and decide to exit rather than risk overstaying.
By the evening, I closed the trade with satisfaction. However, this morning, the market brought SOL’s price right back to where it started. It’s almost as if the conditions for the trade reset themselves, presenting a renewed opportunity.
With this in mind, I’ve decided to re-enter the trade.
Trade Details
Duration:
This trade can evolve into either a short-term or long-term position based on individual goals. Alternatively, you could approach it as an investment in the SOL ecosystem, allowing you to average down costs if the trade doesn’t play out. Monitoring funding rates remains key to this strategy.
Target:
The goal is to achieve a 100% profit. The entry is made on Binance with 25x leverage, using a $37 margin and creating a total position size of $950.
Risk:
This trade is categorized as medium risk, particularly if you’re prepared to utilize dollar-cost averaging (DCA) to manage the position. This time, I’ve added an extra layer of caution by limiting potential losses to around 60% of the deposit.
Conclusion
Trading is a mix of timing, strategy, and calculated risk. SOL has proven its potential in a short timeframe, and with similar conditions presenting themselves today, I’m ready to take another shot. Let’s see how it unfolds!

I take $SOLUSDT LONGBINANCE:SOLUSDT - Opening a #LONG position
The trade with TON could have been left open, but I decided that fundamentally SOL is stronger in case of a dip. Currently, the market is in a sideways trend, deciding where to move next. For BTC, the support level is around 92-93k, but it doesn’t seem very strong.
SOL is 14% off its previous high and has recovered less than TON. TON is currently down 45%, and while I could have held it, I feel that if things go well, SOL could reach $218. Considering the growing popularity of memecoins, I think Solana has better chances to deliver solid gains.
Duration:
This trade can be either short-term or long-term, depending on your goals. You can also consider entering as an investor in the SOL ecosystem to average down your costs in case of a failed trade. The key is to monitor funding rates.
Target:
Achieve 100% profit. Entry made on Binance with 25x leverage. Margin used: $29.77. Total position size: $744.32.
Risk:
Medium, especially if you’re ready to use dollar-cost averaging (DCA) to manage your position. I’m not setting stop-losses because I currently see a high probability of growth. If it doesn’t work out, this was essentially a $29 lottery ticket.

How to avoid Rug Pulls and Liquidity Drains in SOL meme coins🔸Avoiding rug pulls and liquidity drains when trading Solana meme coins in 2025 requires a combination of due diligence, vigilance, and the use of specific tools. Here’s a detailed guide tailored to the Solana ecosystem:
1. Key Strategies to Avoid Rug Pulls and Liquidity Drains
a. Research the Project
Team Transparency:
▪️Look for projects with publicly known and verifiable team members. Anonymity can be a red flag.
Check LinkedIn, Twitter (X), or other profiles for legitimacy and past project involvement.
Whitepaper and Roadmap:
▪️Analyze the project's whitepaper for clarity and feasibility.
Ensure the roadmap includes realistic goals and avoids vague promises.
Community Engagement:
▪️Active and engaged communities (Discord, Telegram, Reddit) can indicate a healthier project.
Beware of overly hyped communities with excessive "pump" language.
b. Analyze the Tokenomics
Liquidity Pool:
▪️Ensure the liquidity pool is locked or held by a reputable escrow service to prevent developers from withdrawing funds suddenly.
Use Solana-specific tools (like Solscan) to verify liquidity lock status.
Developer Token Allocation:
▪️Check for disproportionate allocations to the development team. A large percentage held by insiders can indicate a risk of manipulation or sell-offs.
Audit Status:
🔸Prefer tokens that have undergone independent audits by recognized blockchain security firms like CertiK or Solana-based auditors.
c. Study the Smart Contract
Contract Code:
▪️Review the smart contract (if you have technical knowledge) or rely on tools that provide an analysis.
Red flags include backdoors allowing developers to mint unlimited tokens or withdraw liquidity.
Permission Levels:
Ensure no single wallet has excessive control over critical functions like pausing trading, minting new tokens, or withdrawing liquidity.
d. Monitor Market and Social Media Behavior
Market Activity:
▪️Avoid coins with extremely low liquidity, as they are more susceptible to price manipulation.
Check for unusual trading spikes or patterns that might indicate pump-and-dump schemes.
Social Media Presence:
▪️Beware of projects that rely heavily on influencer marketing without substantive details about their goals or utilities.
Look out for fake followers or bot-driven hype.
2. Tools for Due Diligence in Solana Meme Coins
a. Blockchain Explorers
Solscan:
🔸View wallet activity, contract interactions, and token distribution.
Check for locked liquidity and identify wallets holding large token supplies.
using solscan and api access for on chain data analysis.
Analyze transaction history and track the project’s on-chain activity.
b. Security Auditing Tools
CertiK:
Verify if the project has been audited by CertiK or a similar security firm.
CertiK audits provide insights into vulnerabilities in the smart contract.
SlowMist:
▪️Another reputable auditing platform to check for security breaches or exploits in the project.
c. Rug Pull Detection Tools
Token Sniffer (Adapted for Solana):
▪️Similar to Ethereum tools, some platforms analyze Solana tokens for potential rug pull risks.
Features include checks for locked liquidity and large holder analysis.
CryptoScamDB:
▪️A database of reported scams to check if a project is flagged for suspicious activity.
d. Community Monitoring Platforms
CoinGecko & CoinMarketCap:
▪️Check for newly listed coins and monitor their market cap, liquidity, and trading volume.
Look for warnings or red flags.
Solana Forums and Reddit:
▪️Active discussion threads often highlight community concerns and early scam warnings.
e. Decentralized Exchange (DEX) Tools
Raydium and Orca:
Use these DEXs to view liquidity pools and trading patterns.
Tools within these platforms often allow for deeper insights into token health and activity.
f. Portfolio Management Apps
Zerion or Solflare:
Monitor your investments and get alerts for suspicious activity or major price changes in your Solana meme coin holdings.
3. Red Flags to Watch For
Unlocked Liquidity:
▪️If liquidity isn’t locked or is held by a single wallet, avoid the project.
No Audit or Independent Review:
▪️Projects without an audit from a recognized firm are riskier.
Suspicious Token Distribution:
▪️High concentration of tokens in a few wallets suggests potential pump-and-dump schemes.
Fake Partnerships and Claims:
Verify any claims of partnerships with other projects or companies.
Sudden Hype and Promises of High Returns:
🔸Be wary of projects that use aggressive marketing tactics but lack clear fundamentals.
4. Additional Tips
Diversify Your Investments:
▪️Never allocate more than you can afford to lose, especially in meme coins.
Stay Updated:
▪️Follow reputable Solana-focused news outlets and analysts to stay informed about emerging scams or market trends.
Join Trusted Communities:
🔸Conclusion
By using tools like Solscan, CertiK audits, and Solana Explorer, and by conducting thorough due diligence, you can significantly reduce the risk of falling victim to rug pulls and liquidity drains. Combine these tools with vigilance, skepticism, and a diversified investment strategy to navigate the volatile world of Solana meme coin trading successfully.

Solana - It Just Looks Super Bullish Now!Solana ( CRYPTO:SOLUSD ) is creating a break and retest:
Click chart above to see the detailed analysis👆🏻
With the last monthly candle of more than +40%, Solana broke all resistance towards the upside and finally created a new all time high. Now we are seeing the perfect retest of the previous resistance which is now turned support and another strong move higher is absolutely possible.
Levels to watch: $200, $400
Keep your long term vision,
Philip (BasicTrading)

sol buy midterm"🌟 Welcome to Golden Candle! 🌟
We're a team of 📈 passionate traders 📉 who love sharing our 🔍 technical analysis insights 🔎 with the TradingView community. 🌎
Our goal is to provide 💡 valuable perspectives 💡 on market trends and patterns, but 🚫 please note that our analyses are not intended as buy or sell recommendations. 🚫
Instead, they reflect our own 💭 personal attitudes and thoughts. 💭
Follow along and 📚 learn 📚 from our analyses! 📊💡"
