SOL / USDT - Current ThoughtsSolana’s been stealing the spotlight again and not just for the memes this time!
After months of getting smacked down at key levels, it’s finally reclaiming the lost ground with conviction. Price is grinding its way through zones that had been solid resistance for ages, flipping sentiment along the way.
The combination of structure, volume, and market psychology paints a clear story here. Let's break it down piece by piece in simple terms.
———x———x———x———
Table of Contents
⦿ Volume Profile
⦿ Key Technical Levels & Insights
⦿ Market Structure
———x———x———x———
⦿ Volume Profile
The Volume Profile offers crucial insight into where meaningful participation has taken place throughout this range and how these levels continue to influence the current structure.
Point of Control (POC) – ~145 USDT
This is the level where the highest volume changed hands during the entire consolidation. In simple terms, this is where buyers and sellers were most active in establishing positions.
The POC is like a price magnet where the market finds equilibrium when direction becomes uncertain. If bulls lose momentum, the price may gravitate back towards it.
Value Area Low – ~123.50 USDT
Below this threshold, prior market interest thinned out significantly. A breakdown here would likely accelerate downside as it signals acceptance below value, typically inviting stronger bearish flows and forcing trapped longs to capitulate.
Value Area High – ~213 USDT
This area marks a logical short-term upside target if the current rally can sustain its footing. VAH is where the prior range began to thin out and sellers historically pushed back. If buyers want to reclaim control, this is a key level to watch.
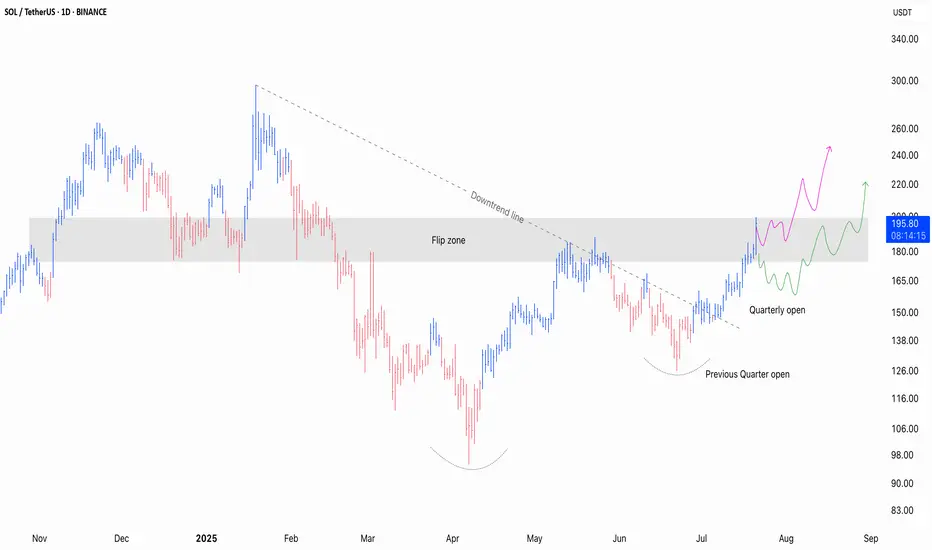
Currently, the price has cleanly reclaimed the POC and is now pressing into what I’d define as the Flip Zone (an area where former resistance is getting retested as potential support). Acceptance above the VAH will lead a rally towards the ATH.
⦿ Key Technical Levels & Insights
Several key factors are aligning here to create a compelling case and it’s about the broader narrative these levels are constructing together.
Quarterly Open – ~150 USDT
The recent breakout and push above the QO shows a clear intent buyers' intent. It’s a important reference point for ongoing structure.
Yearly Open – ~188 USDT
Reclaiming the Yearly Open is rarely a trivial event. Currently, the price is flirting with the YO. If the price manages to reclaim it with a strong push, it'll shift the broader sentiment back in favour of the bulls.
Flip Zone – 175–190 USDT
This zone has historically been a battleground, serving as both support and resistance since March 2024. A clean breakout above this zone won't just clear resistance, it'll open the door for further upside as sidelined participants as well as trapped shorts will be forced to react.
Downtrend Line – Broken
The trend line that was established earlier this year has been breached now, adding another positive factor for the bulls.
200 EMA / 200 SMA – ~163 USDT
Both KMAs are converging here, adding weight to this level as a reference for long-term trend direction. Price reclaiming and holding above these MAs often signals a meaningful shift in market sentiment.
The confluence of reclaiming major opens, breaking downtrend resistance, and positioning above critical moving averages strengthens the bullish case.
⦿ Market Structure
The current structure shows a market transitioning from bearish exhaustion, through a phase of accumulation, and now stepping confidently into breakout territory.
Double Bottom Formation (April lows ~95 USDT to recent highs):
This is a textbook accumulation. It’s not a fast V-shape reversal but a slow build. These kinds of structures often lay the groundwork for sustained trends.
Higher Lows in Place: 95 → 126 → 150 → 190 USDT
Each successive low is higher than the last, showing consistent buyer strength and deliberate positioning by participants with a longer-term view.
Breakout Above Prior Range Highs (187–190 USDT):
This area acted as clear resistance in previous attempts, capping price for months. Once this range is reclaimed with force, expect higher prices for multiple weeks/months.
TLDR
✅ Current Bias: Bullish while above 175–190 USDT.
✅ Structure: Breakout of multi-month downtrend, reclaiming key levels.
✅ Volume: Strong above POC, targeting Value Area High next.
✅ Invalidation: Failure below 150 USDT flips bias back to bearish.
I’m only focused on bullish continuation or healthy pullback scenarios for now, as I plan to keep holding my existing spot positions.
If you found this breakdown helpful, drop a like and let me know your thoughts in the comments. Always keen to hear how others are seeing the market. 👇
⚠️ Disclaimer
As always, this post is purely for educational purposes. I am not a financial advisor, and nothing here should be taken as financial advice. Always consult your financial advisor before making any investment or trading decisions. Or at the very least, consult your cat. 🐱
Solana
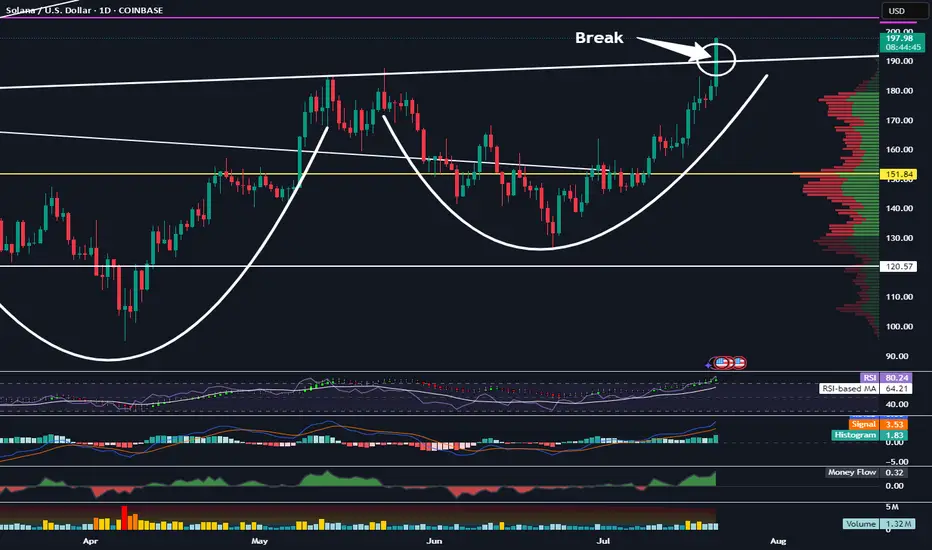
Solana Has Broken This Important Resistance LevelTrading Fam,
Things are definitely heating up in the altcoin space. Two big key movers are ETH and SOL. Right now SOL has broken a very important resistance level in the neckline of this inverse H&S pattern. Watch closely. If the body of our daily candle closes above this today and remains above it tomorrow, this pattern is in play and our target would be around $275.
✌️Stew
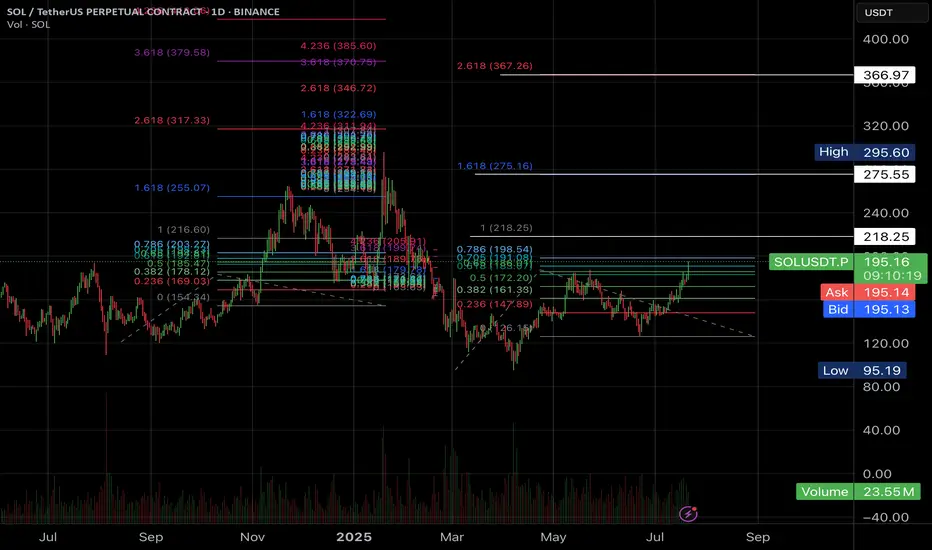
#SOL for 367$?Hi Padawans,
Hope you’re all doing well.
The charts don’t lie — but remember, this isn’t financial advice.
I’m currently eyeing long positions up to the levels highlighted in the chart.
Best regards,
CryptoObi
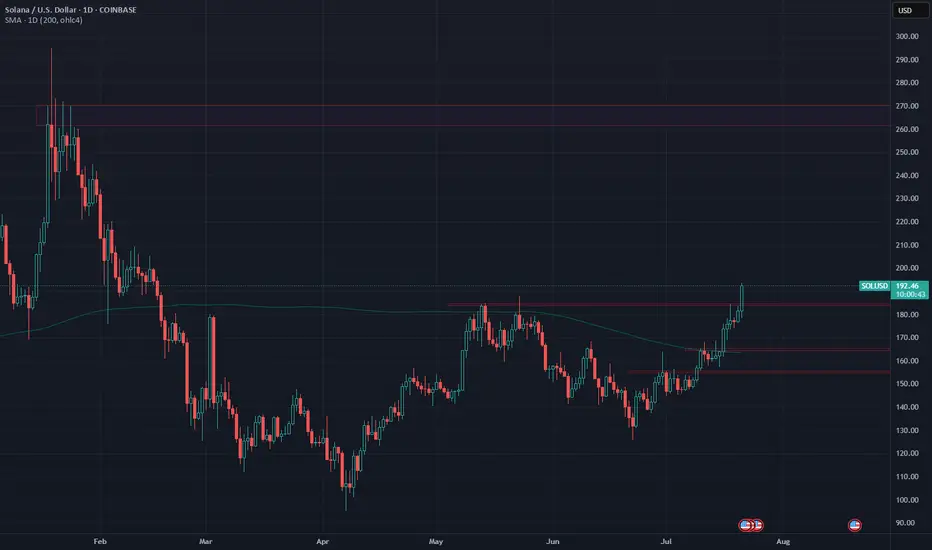
Solana Enters Bullish TerritorySOL has been showing strength since it reclaimed the 1D 200MA last week.
Currently trading around $192 - above May's highs - continued bullish momentum could see price test Jan highs around $270.
Until then, any retracement could be a buying opportunity.
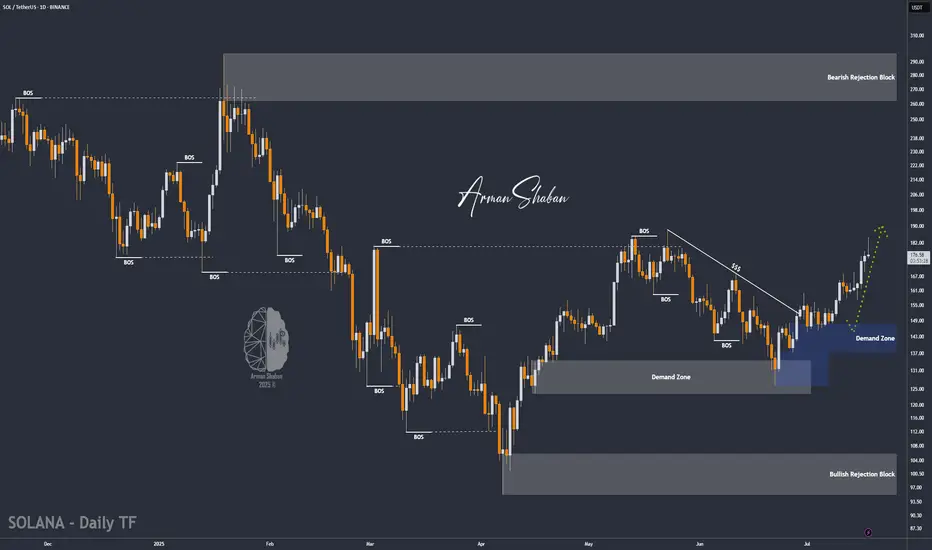
SOL/USDT | Next Bullish Leg Ahead if Key Support (READ)By analyzing the Solana chart on the daily timeframe, we can see that today the price climbed to $184, almost hitting the next target at $187, before facing a correction. It is currently trading around $176. If Solana manages to hold above the key support zone between $168 and $174, we can expect the next bullish leg to start, potentially extending up to $227. The previous analysis remains valid, with the next upside targets at $187, $220, and $263.
Please support me with your likes and comments to motivate me to share more analysis with you and share your opinion about the possible trend of this chart with me !
Best Regards , Arman Shaban
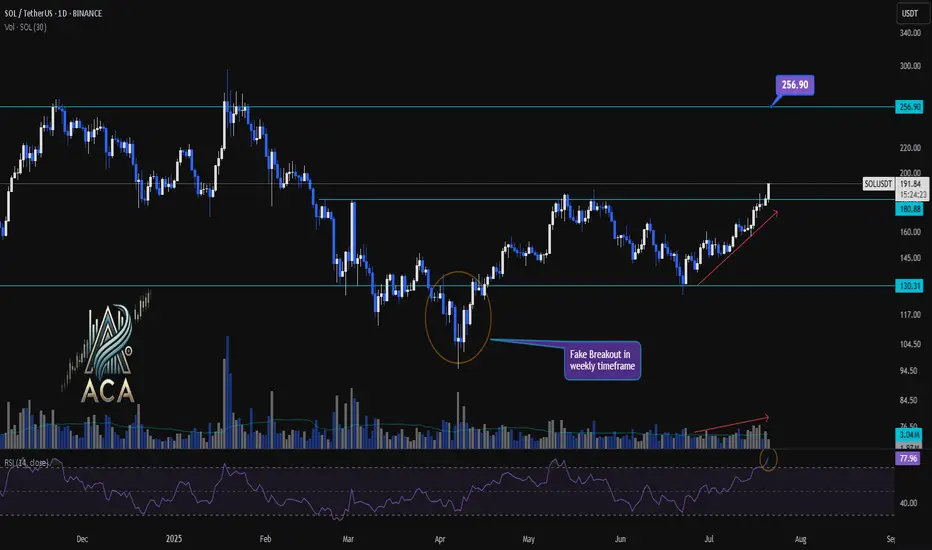
SOLUSDT 1D Chart Analysis | Accumulation Breakout Signals....SOLUSDT 1D Chart Analysis | Accumulation Breakout Signals Fresh Momentum
🔍 Let’s drill into the SOL/USDT daily chart, focusing on the recent breakout above the accumulation range, key support and resistance levels, RSI momentum, and volume confirmation for a robust bullish scenario.
⏳ Daily Overview
SOLUSDT has decisively broken out above a prolonged accumulation box, marking a significant shift in market structure. A daily close beyond this range now serves as a strong indicator for renewed bullish momentum. RSI is currently above 77, signaling that buyers are commanding momentum. Notably, volume has surged in tandem with price, confirming trader participation behind this breakout move.
📈 Technical Convergence and Trend Structure
- Accumulation Zone Break: After consolidating within a clear box for weeks, SOLUSDT closed above the upper boundary (around $180.88–$191.05), signaling a possible trend reversal or continuation.
- Daily Close Signal: A daily close outside the accumulation box offers high conviction for bullish continuation. This close acts as a potential entry signal for trend-followers.
- RSI Momentum: The RSI sits above 77—deep in the overbought territory. A close here not only confirms buyer strength but often precedes sustained uptrends when accompanied by price breakouts.
- Volume Surge: Volume has increased with the breakout, providing confirmation the move isn’t a false start, but likely fueled by real demand.
- Weekly Fake Breakout: There was a notable false breakout in the weekly timeframe, quickly reclaimed by bulls. This flip suggests buyers fended off downside attempts and now drive higher prices.
🔺 Bullish Setup & Targets
- First Target: $256.90 — marking the next major resistance on the chart and a logical upside objective for traders.
- Key Trigger: A confirmed daily (or weekly) close above the accumulation range with strong volume is essential for validating the upward trajectory.
📊 Key Highlights
- The breakdown of the accumulation box—now turned support—marks a pivotal structural change.
- RSI and price are making new local highs, solidifying the case for continued bullish momentum.
- Volume is climbing in sync with the move, offering real confirmation versus a potential fakeout.
- Recent fake breakout on the weekly chart, immediately negated, emphasizes that buyers are regaining—and likely maintaining—control.
🚨 Conclusion
SOLUSDT appears set for higher prices following the confirmed breakout above the accumulation range. Signs of trend health include an overbought RSI, volume confirmation, and the swift invalidation of a recent weekly fake breakout. As long as daily closes stay above the breakout level, the path remains clear for a rally toward $256.90. A strong daily close and continued volume will be your best signals for bullish continuation.
20:1 R:R for SolanaTaking a chance on this super high-risk setup with a 20:1 R:R before it takes off.
Entry: 177.78
Stop Loss: 173
Target: 260

SOLANA - BULLISH & BAERISH
Hello everyone,
here is my current outlook on Solana (SOL):
Personally, I am currently only watching Solana as we may already be in a correction phase. Nevertheless, there is an interesting scenario where we could still be in a green wave 5, which could potentially reach prices above USD 300.
Possible course:
In April 2025, the bottom may have been found following an ABC formation.
Wave 1 (yellow) could be completed in May 2025.
Wave 2 (yellow) could end in June 2025.
We could currently be in wave 3 (yellow).
Important point to watch:
If the price does not make it sustainably above the yellow wave 1 (approx. USD 190), the probability increases strongly that we are still in a B wave.
This would mean that we are still in a major correction, which could theoretically take us back to around USD 60. In this scenario, wave 1 would have already ended in January 2025 and we would still be in the correction of wave 2.
Conclusion:
The indicators are particularly important in this phase. Keep a close eye on them to better understand the structure.
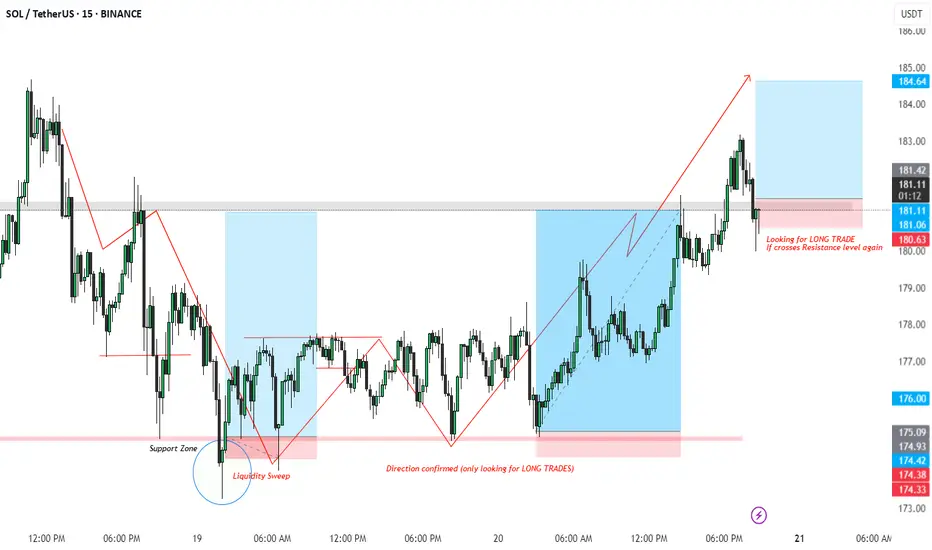
SOL/USDT LONG Setup – Liquidity Sweep + Break of Structure
Timeframe: 15m
Market Bias: Bullish (Long only)
Setup Type: Liquidity Sweep + BOS + Retest
📌 Breakdown:
Liquidity Sweep Identified:
Price dipped below the previous support zone, triggering stop hunts and grabbing liquidity.
Marked as a clear sweep of lows, signaling possible reversal.
Shift in Structure:
Following the sweep, price printed a Higher High and Higher Low, confirming change in structure.
At this point, we shift bias to Long Only trades.
Retest & Entry Zone:
After bullish momentum, price has pulled back to a key resistance-turned-support zone (highlighted in pink).
Looking for long entry on confirmation if price reclaims the resistance again (~181 zone).
📈 Trade Plan:
Entry: On reclaim and candle close above 181.00
SL: Below the recent structure low (~180.00 or dynamic based on confirmation)
TP: Previous high at 184.60 zone (approx 1:3 RR)
🧠 Trading Psychology:
Patience is key — wait for structure confirmation and avoid pre-emptive entries. The liquidity sweep setup gives us a solid probability edge when combined with market structure shift.
#SOLUSDT #CryptoTrading #SmartMoneyConcepts #LiquiditySweep #TradingSetup #BOS #MarketStructure #ReversalPattern #CryptoAnalysis #LongTradeOpportunity #PriceActionTrading #15MinSetup
SOL Breakout Fueled by Momentum — $165 Flip Holding StrongSolana continues its strong uptrend after reclaiming key structure. Price broke out above the $165 resistance zone and turned it into support — a classic continuation setup.
What makes this move stand out isn’t just the structure, but how clean the momentum confirmation has been throughout.
The **MACD Liquidity Tracker Strategy** — designed to filter signals based on both trend alignment and momentum compression — flagged a long around the $155 reclaim.
From there, we saw rising histogram bars, a clean crossover, and price action that respected the entry all the way up through consolidation.
This type of strategy doesn't just look at MACD crosses alone.
It analyzes whether liquidity is *compressing or expanding*, and filters trades based on whether there's actual follow-through potential — especially useful in choppy markets like what we saw in late June.
This latest run is a good example of how pairing structure (support flips, key reclaims) with smart momentum filters can keep you in the move — and out of the chop.
We’re watching to see how SOL behaves above $180 and whether momentum sustains into higher resistance zones.
—
#SOLUSD #Solana #MACDStrategy #MomentumBreakout #SupportFlip #TradingEdge #BacktestBetter #QuantTradingPro #CryptoTrading #TradingView

"SOL/USD BULLISH HEIST! Steal Profits Like a Pro"🏆 "SOLANA HEIST ALERT! 🚨 Bullish Loot Ahead – Thief Trading Style (SOL/USD)" 🏆
💸 Steal Profits Like a Pro – Day/Swing Trade Plan 💸
🌟 Greetings, Market Pirates & Profit Raiders! 🌟
Hola! Bonjour! Hallo! Marhaba! 🤑 Dear Thieves & Trend Snipers, the SOL/USD vault is WIDE OPEN! Time to execute the heist with precision.
🔥 THIEF TRADING MASTER PLAN 🔥
🎯 Mission: LONG SOLANA (Escape Near Blue ATR Line)
⚠️ Danger Zone: Overbought | Consolidation | Bear Trap Ahead
🏆 Rule: "Take Profit & Treat Yourself – You’ve Earned It!" 💪💰
📈 ENTRY STRATEGY (The Heist Begins!)
"SWIPE THE BULLISH LOOT!" – Enter at any price, but smart thieves use:
Buy Limit Orders (15-30min timeframe)
Swing Low/High Pullbacks for optimal entry
DCA/Layering Strategy (Multiple limit orders for max loot)
🛑 STOP-LOSS (Escape Plan)
📍 Thief SL: Below nearest low (Daily MA @ $160.00)
⚠️ Adjust SL based on: Risk tolerance, lot size, & DCA layers.
Pro Tip: Tighten SL if market flips bearish!
🎯 TARGETS (Profit Escape Routes)
🎯 Main Take-Profit: $220.00 (or exit earlier if momentum fades)
🧲 Scalpers: Only LONG! Use trailing SL to lock gains.
💰 Big Bank Thieves: Go all-in. Smaller Raiders: Join swing traders.
📰 WHY SOLANA? (Fundamental Boosters)
Bullish Momentum (Tech + Sentiment Driving Price)
Macro Trends, On-Chain Signals 👉 Check Liinkss 🔗
Intermarket Analysis: Crypto & equities syncing for gains!
⚠️ TRADING ALERTS (News & Risk Control)
🚨 News = VOLATILITY! Avoid new trades during major releases.
🔒 Protect Running Trades: Use trailing stops to secure profits.
💥 SUPPORT THE HEIST! (Boost & Win Together) 💥
🔥 Hit the "LIKE" & "BOOST" button to strengthen our Thief Trading Squad!
🚀 More Heist Plans Coming Soon – Stay Tuned! 🤑🎉
📌 Reminder: This is NOT financial advice – DYOR & manage risk!

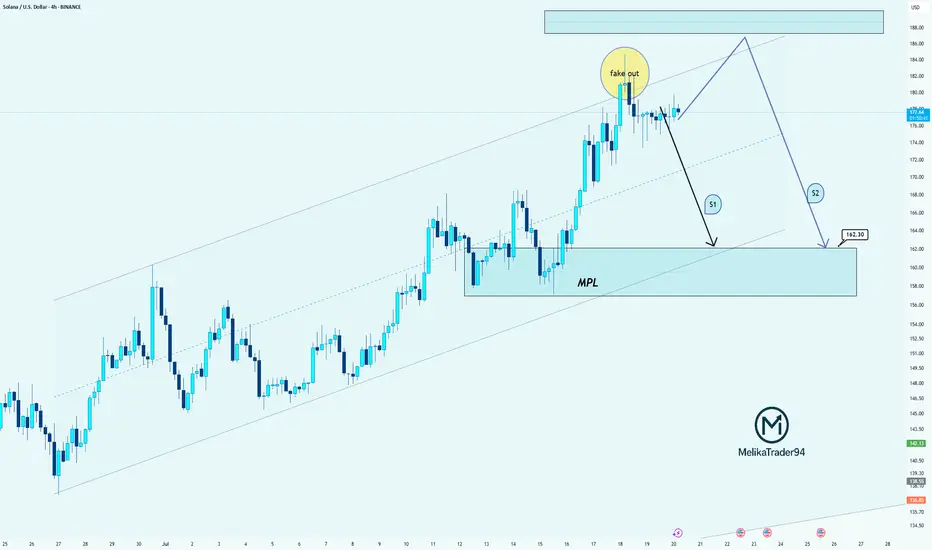
SOL: Clean Fakeout & Two Bearish Scenarios AheadHello guys!
Price just created a textbook fakeout above the resistance zone, grabbing liquidity and quickly dropping back into the range!
Here’s what the chart is showing:
Price is still inside the ascending channel, but the breakout attempt failed
The MPL (maximum pain level) around $162.30 is the key downside target
Two possible paths:
S1: Direct drop from here toward the MPL
S2: Another move up to retest the highs or form a lower high before the deeper drop
I think the S2 is more probable!
BONKUSDT 1D Chart Analysis | Bullish Momentum is coming...BONKUSDT 1D Chart Analysis | Bullish Momentum Builds After 0.236 Fibo Pullback
🔍 Let’s break down the BONK/USDT daily chart, focusing on the latest price action, strategic moving averages, RSI convergence, and volume dynamics for a complete bullish scenario setup.
⏳ Daily Overview
BONK is showing strong upward momentum, printing consecutive higher highs (HH) in both candles and RSI—a clear bullish trend indicator. After an explosive move, price is currently staging a healthy pullback to the key 0.236 Fibonacci retracement level (0.00003142), which commonly acts as a support platform during aggressive uptrends.
📈 Technical Convergence and Trend Structure
- 3SMA Support: The 7, 25, and 99 SMAs are all trending upward and stacked correctly, with price sitting comfortably above them. The 7SMA acts as immediate dynamic support, reflecting trend strength and buyer interest at every dip.
- RSI Dynamics: RSI just bounced from the 69–70 zone, confirming convergence with price action. The indicator made its own higher high in tandem with the candles, and now, as price pulls back, RSI is reentering the overbought territory—which often precedes renewed momentum.
- Volume Confirmation: Notably, volume surged as the trend accelerated, and is now tapering off during this corrective phase. This is a classic bullish volume signature, showing profit-taking by early longs but no major selling pressure, suggesting trend continuation likely after consolidation.
🔺 Bullish Setup & Targets
- First target: 0.00005376 — retest of the last all-time high (ATH).
- Next resistance to watch: 0.00003920, followed by the ATH region.
- Long-term target: 0.00009710 — an upside of 170–180% from current levels, mapped by technical extension and price discovery zones.
📊 Key Highlights
- Price holding the 0.236 Fibo retracement signals a shallow, healthy correction.
- 3SMA alignment confirms long-term bullish bias—actively supporting every dip.
- RSI and price are convergent, reaffirming uptrend strength; RSI’s move back into overbought could ignite the next price surge.
- Volume decreasing on corrections and rising during rallies—bullish confirmation.
🚨 Conclusion
BONK/USDT remains technically poised for further upside. The blend of higher highs, support at the 0.236 Fibonacci retracement, positive 3SMA structure, and RSI convergence all point to bullish continuation. Watch for renewed momentum as RSI reenters overbought territory and volume confirms the next breakout. Next targets: 0.00005376 (ATH), with a long-term projection toward 0.00009710.

SOL - Trend-Following Longs in the making!Hello TradingView Family / Fellow Traders. This is Richard, also known as theSignalyst.
📈SOL has been overall bullish trading within the rising channel in red.
Moreover, the orange zone is a strong demand.
🏹 The highlighted blue circle is a strong area to look for buy setups as it is the intersection of the orange demand zone and lower red trendline acting as a non-horizontal support.
📚 As per my trading style:
As #SOL retests the blue circle zone, I will be looking for bullish reversal setups (like a double bottom pattern, trendline break , and so on...)
📚 Always follow your trading plan regarding entry, risk management, and trade management.
Good luck!
All Strategies Are Good; If Managed Properly!
~Richard Nasr

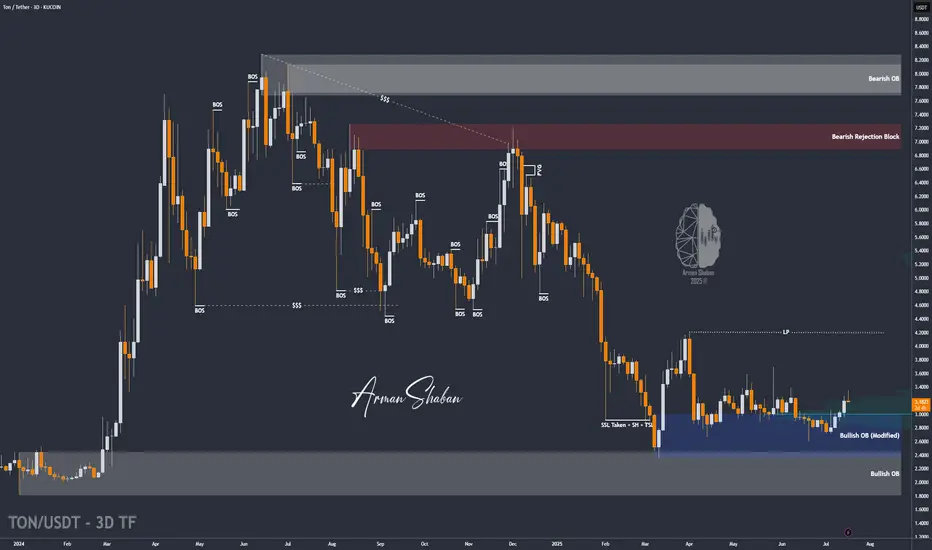
TON/USDT | Another Bullish Move Ahead? (READ THE CAPTION)By analyzing the Toncoin chart on the 3-day timeframe, we can see that, as per yesterday’s analysis, the price climbed to $3.36 before facing a slight correction — which is perfectly normal since every strong bullish trend needs a healthy pullback. The $3.05–$3.20 zone could serve as a good accumulation area for buyers, and we may soon witness another impressive rally from Toncoin! Based on the previous analysis, the next targets are $3.63, $4.20, and $4.68.
Please support me with your likes and comments to motivate me to share more analysis with you and share your opinion about the possible trend of this chart with me !
Best Regards , Arman Shaban
Solana Testing the June Breakdown Level — Decision TimeAfter weeks of slow grind, SOL is now pressing into a level that triggered a major selloff in June. A clean breakout here could flip momentum hard — but if buyers stall again, a short-term double top could catch late longs off guard. Watching $185 closely.

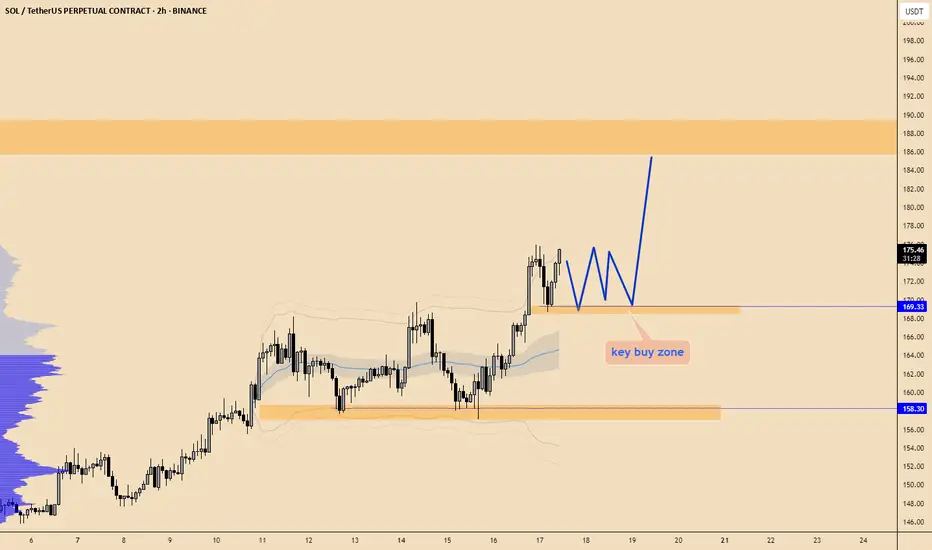
SOL/USDT Technical Outlook – Breakout Holding, Eyes on 175+Solana has successfully broken above the key resistance zone at $155–157 and is currently testing it as new support. If the level holds, this breakout could extend toward the next major target around $175–178.
📌 Key Insights:
Clean breakout followed by a potential SR flip
Watch for confirmation of support before continuation
Target aligns with previous swing high
Invalidated on breakdown below reclaimed level
🟢 Bias remains bullish as long as price holds above the breakout zone. A confirmed retest could provide a high-probability long setup.
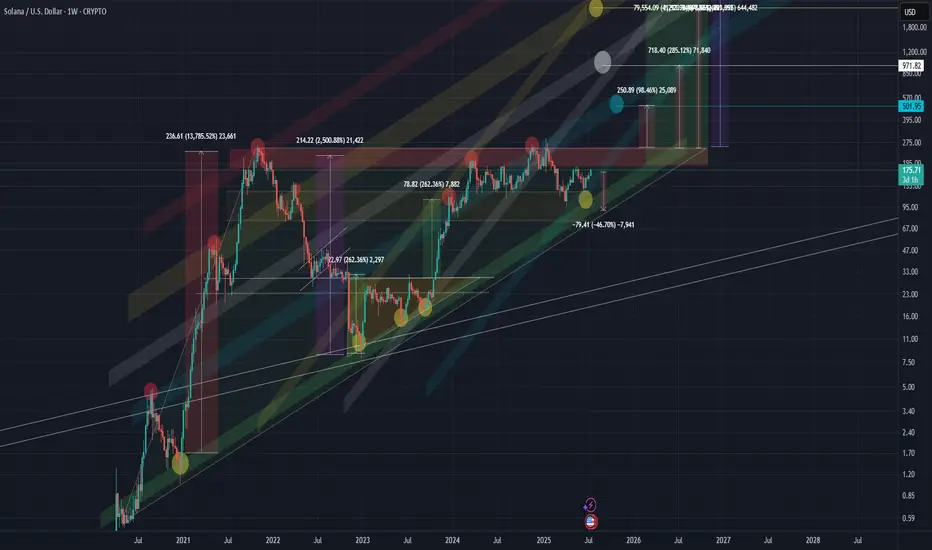
SOLANA SOL 1WThis coin is showing very interesting development, and the market maker seems to be painting clear structural patterns.
🔷 Macro Structure: Rising Triangle
On the higher timeframes, we can clearly see a rising triangle formation taking shape. If this pattern breaks out to the upside, the potential measured move suggests a target of up to ~2,500% from current levels.
📊 Chart Overview
Wide zones = key support and resistance
Former resistance often becomes support after a breakout
All target levels and zones are clearly marked on the chart
⚠️ Risk Warning & Realistic Scenario
Be mindful of market behavior:
Often before a bullish breakout, we see a fake breakdown — a trap to liquidate early longs — followed by a return into the triangle and a strong move upward. Don’t rush. Let the pattern confirm itself.
💡 Plan Accordingly
If you're already in, consider protecting your position with a stop-loss
Don’t overleverage, and take profit partially on strong levels
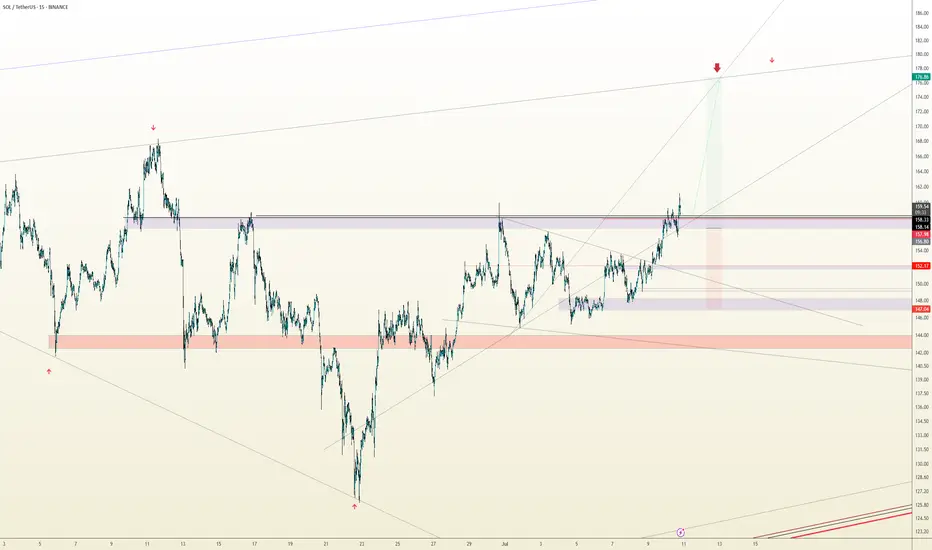
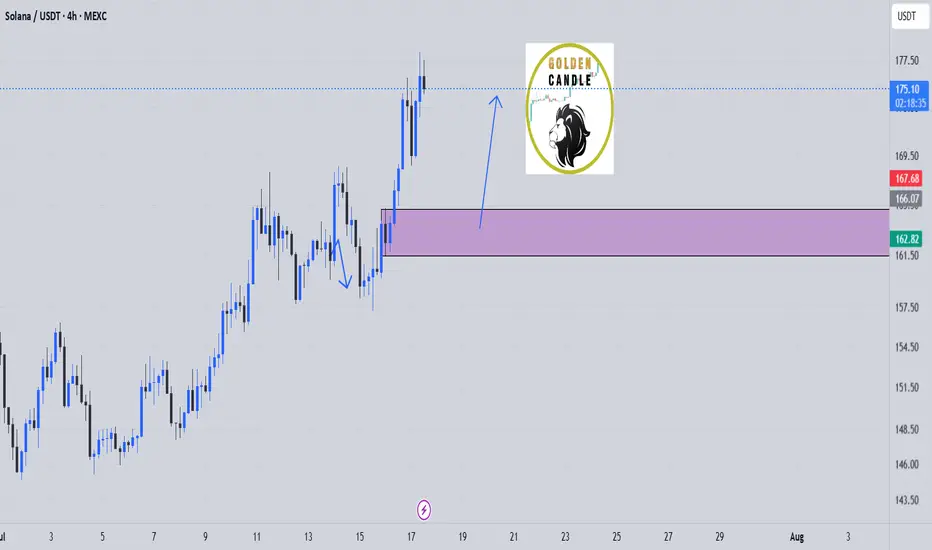
#SOL Update #5 – July 18, 2025#SOL Update #5 – July 18, 2025
Solana has returned to the region where its last impulsive move was formed. It appears to be attempting another bounce, but when we look at the SOL/BTC pair, it is currently facing a strong resistance zone.
There isn't much room between this resistance and the 200 MA band, which makes this a critical decision zone. At the moment, I do not recommend entering either a Long or Short position — it’s best to wait and observe.
If Solana breaks out to the upside, the next target will likely be $179.

Solana - The Cup is Almost FullSolana is printing a textbook cup & handle formation on the daily, and price is now pressing against the neckline resistance near $185, just below the psychological $200 zone.
This structure reflects months of accumulation and rising momentum. A confirmed breakout above the $185–$199 resistance would likely trigger the next upward leg.
This setup signals trend reversal continuation, and if SOL closes above $199 on high volume, momentum traders may pile in quickly.
📌 Invalidation below $150 = pattern risk-off.

sol buy midterm"🌟 Welcome to Golden Candle! 🌟
We're a team of 📈 passionate traders 📉 who love sharing our 🔍 technical analysis insights 🔎 with the TradingView community. 🌎
Our goal is to provide 💡 valuable perspectives 💡 on market trends and patterns, but 🚫 please note that our analyses are not intended as buy or sell recommendations. 🚫
Instead, they reflect our own 💭 personal attitudes and thoughts. 💭
Follow along and 📚 learn 📚 from our analyses! 📊💡"
SOL/USDT : SOL Rebounds Strong – Is a 25% Rally Just Beginning?By analyzing the Solana (SOL) chart on the daily timeframe, we can see that after dropping to the $147.75 zone, the price experienced renewed buying pressure and has since rallied to around $159, delivering over 6% return so far.
This cryptocurrency shows strong bullish potential, with short-term gains possibly exceeding 25%.
The next upside targets are $168.5, $187, $220, and $263.
Please support me with your likes and comments to motivate me to share more analysis with you and share your opinion about the possible trend of this chart with me !
Best Regards , Arman Shaban
