Already ready to go longMy bias for Solana is super bullish. I invest in Solana and I think it is still a good price to buy and hold, but I am planning to trade with leverage.
Currently, Daily EMA200 is dead flat and running across the candles.
MACD moving to the upside but still in bear territory.
There is a bullish momentum building up, however, there is a large sell order block sitting above the current price area, and the price can oscillate around EMA200. The similar situation is marked in the blue rectangular box in the chart.
I will open a long position when:
1) EMA 21 >EMA55> EMA200
2) MACD lines cross and move in the bull territory.
3) a daily candle closes above EMA21. (see red vertical line)
Solana

Red Lights for SOLANASolana has recently completed its 5-wave impulsive rise, and now a correction phase appears to be underway. Notably, a diamond top formation has formed and already broken to the downside, further supporting the short-term bearish outlook.
As long as SOL trades below the $180 resistance, this corrective scenario remains valid.
I currently do not expect a drop below the $146 support zone, making this a structured micro pullback within a larger bullish macro trend.
This setup offers opportunities for both short-term short and long entries, depending on how the price reacts near key levels. While the macro structure and fundamentals remain highly bullish for Solana, this correction could provide an ideal re-entry point before the next major leg up.
— Thanks for reading.

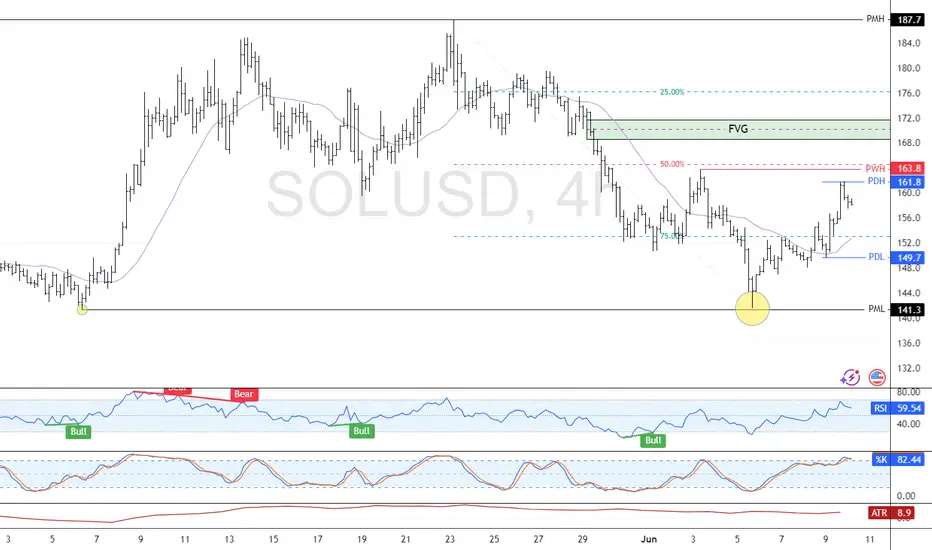
Solana: Bearish Outlook Between $163.8 and $170.FenzoFx—Solana formed a double bottom at $141.3, making this level a target. We are bearish on Solana between the $163.8 and $170.0 resistance.
The target is $149.7, followed by $141.3.
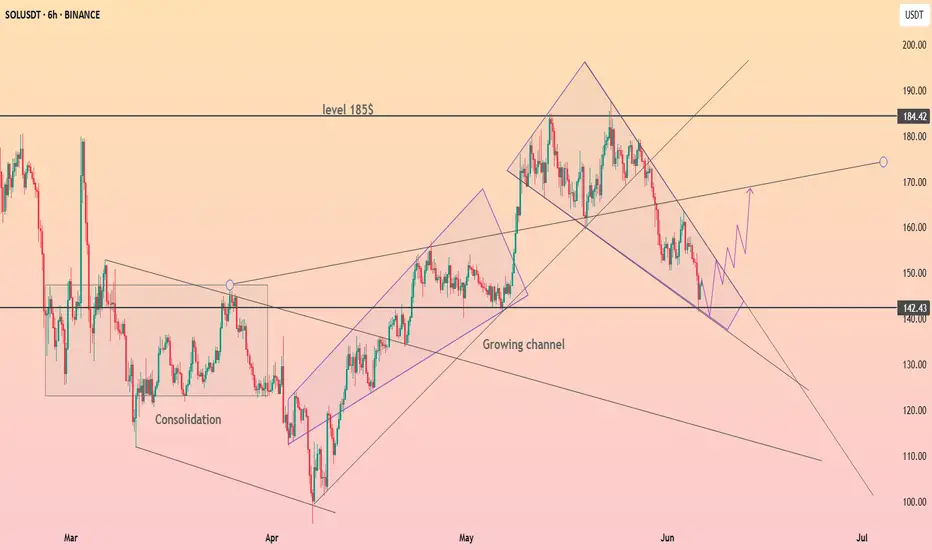
HolderStat┆SOLUSD rebound from 142CRYPTOCAP:SOL just kissed 142 support at the base of its growing channel. Solana price slips from a descending wedge, and holding above trend could propel bids toward 155, then the 170-184 supply band; lose the line and 125 beckons.
Is there hope for Solana?After a retest of support around $142, SOL is testing previous support as resistance around $152.
A strong break and retest of the $153 area could signal price reclaiming support and heading towards $166.
Failing to do so could lead to a retest and confirmation of $140 as support. Of course, losing support would signal further weakness towards $136 before a reversal potentially taking place.
As mentioned before, price is still trading below 1D 200MA, which could either be signaling weakness or the potential for more upside.
Considering the downward direction of the 1D 200MA could also be a bearish signal, however, this also usually happens before a reversal.

Solana >>> all trendlines are brokenHello guys!
As you can see, all of the trendline is broken, and after forming a double top in Solana, we can see a bearish trend is running!
I believe this downward movement will continue until the price touches the mentioned area!
The pointed area is the target level!
And the blue area has its own potential for getting long!

Solana Bullish, Retrace Over! Aim For $620 or $1,020 In this 2025 Cryptocurrency bull market, you should be aiming for $620 or $1,020 for Solana, $420 is the minimum.
How are you feeling today my dear friend?
I hope you are having a wonderful day.
Retraces and corrections, they can only last so long.
Solana dropped from $188 to $141 and I believe this is enough, a 24% drop (-24%).
As the retrace ends, the chart will produce a higher low and, as the higher low becomes confirmed, SOLUSDT starts a new wave of growth.
$420 is the minimum target for this bullish wave and should hit first but, you should aim higher, much higher. Crypto is showing to be many times stronger than what most people think.
Remember, the mistake we always make is not aiming too high but aiming too low. In each bull market, we tend to underestimate the market. Aim high, because we are going up.
Retraces and corrections are an opportunity to buy-in, 2nd entries, rebuy and reload.
Don't try to SHORT within a bull market, it is dangerous and not worth the risk. It is better to wait for support and go LONG. Always trade with the trend, specially if you are using leverage. Crypto is going up. Solana will now turn green.
Thank you for reading.
Namaste.

Solana Short-Term, Already Bearish After 97% UpWhat will happen in the long-term? Before we get there, let's focus on the short-term real quick because we want to know what is happening with the market now.
The market offers endless opportunities. We need to take advantage of those, our edge. We have an edge and this edge is being able to read the chart. With this edge, we can time the market and increase our trading success.
Solana grew by 97%. This is good. Of course, some pairs grew way more while others grew less. I did mentioned that when Bitcoin grows 50%, some Altcoins can grow 300%. This is exactly what happened, this is because of the size of the projects.
Some pairs grew more but these were smaller pairs. Some pairs grew less but these were bigger. That's just the nature of things.
This 97% bu-wave can be correlated to a 300-400% bullish-wave on other pairs. This means that after a growth wave comes a correction.
SOLUSDT—two main interesting levels. Won't mention them as they are shown on the chart.
Both are likely to hit but the first high is really high probability.
This is easy. Wait for support before buying again. I say "again" because you are supposed to sell at resistance, we are assuming you sold at resistance and are ready to buy at support.
Good? We are good.
The market will continue to move down and up while long-term it produces sustained growth.
We need to adapt fast and be smart, everything can change in a day.
Keep an eye on the news, we might be in front of some major event.
Political events can change everything and cannot be predicted.
Thank you for reading.
Namaste.

Will Solana Go Lower? Yes! Only To Recover HigherI've been asked: Will Solana continue lower?
I think it is a fair question but it is also pretty hard right now to say based on the chart, there are just too many mixed signals.
For example, if we take Solana in relation to Bitcoin, it is trading daily below EMA55 and MA200, while Bitcoin is trading daily above these levels. Bitcoin hit recently a new all-time high while Solana only produced a small recovery in May.
When it comes to the chart signals, SOLUSDT produced a volume breakout on the bearish side and the support zone was completely challenged on a single candle. What's more, Solana will grow really strong later this year, so it would be normal to see as much bearish action as possible now because later we will have sustained long-term growth.
It is a coin flip, but if you ask me, it can go a bit lower before moving up. It can go lower to end up producing a higher low.
I will wait for clear reversal signals before going LONG.
I closed all my LONGs a while back, when it became clear that the market was going into correction. Now we can just wait easily and patiently until the correction unravels, after the correction comes a new wave of growth. Down and up, down and up... The market continues to cycle. Never straight down, never straight up. It moves in waves.
Namaste.

HolderStat┆SOLUSD rebound from supportCRYPTOCAP:SOL revisits the 150 pivot inside a corrective wedge, yet April’s growing channel stays intact. Confluence of horizontal demand, wedge resistance and prior consolidation tips a comeback toward 175, then the 185 ceiling, as long as trendline cradle support endures.

Solana H4 | Potential bounce off 50% Fibonacci supportSolana (SOL/USD) is falling towards an overlap support and could potentially bounce off this level to climb higher.
Buy entry is at 140.92 which is an overlap support that aligns with the 50.0% Fibonacci retracement.
Stop loss is at 122.00 which is a level that lies underneath an overlap support.
Take profit is at 160.65 which is an overlap resistance.
High Risk Investment Warning
Trading Forex/CFDs on margin carries a high level of risk and may not be suitable for all investors. Leverage can work against you.
Stratos Markets Limited (tradu.com ):
CFDs are complex instruments and come with a high risk of losing money rapidly due to leverage. 63% of retail investor accounts lose money when trading CFDs with this provider. You should consider whether you understand how CFDs work and whether you can afford to take the high risk of losing your money.
Stratos Europe Ltd (tradu.com ):
CFDs are complex instruments and come with a high risk of losing money rapidly due to leverage. 63% of retail investor accounts lose money when trading CFDs with this provider. You should consider whether you understand how CFDs work and whether you can afford to take the high risk of losing your money.
Stratos Global LLC (tradu.com ):
Losses can exceed deposits.
Please be advised that the information presented on TradingView is provided to Tradu (‘Company’, ‘we’) by a third-party provider (‘TFA Global Pte Ltd’). Please be reminded that you are solely responsible for the trading decisions on your account. There is a very high degree of risk involved in trading. Any information and/or content is intended entirely for research, educational and informational purposes only and does not constitute investment or consultation advice or investment strategy. The information is not tailored to the investment needs of any specific person and therefore does not involve a consideration of any of the investment objectives, financial situation or needs of any viewer that may receive it. Kindly also note that past performance is not a reliable indicator of future results. Actual results may differ materially from those anticipated in forward-looking or past performance statements. We assume no liability as to the accuracy or completeness of any of the information and/or content provided herein and the Company cannot be held responsible for any omission, mistake nor for any loss or damage including without limitation to any loss of profit which may arise from reliance on any information supplied by TFA Global Pte Ltd.
The speaker(s) is neither an employee, agent nor representative of Tradu and is therefore acting independently. The opinions given are their own, constitute general market commentary, and do not constitute the opinion or advice of Tradu or any form of personal or investment advice. Tradu neither endorses nor guarantees offerings of third-party speakers, nor is Tradu responsible for the content, veracity or opinions of third-party speakers, presenters or participants.

SOL final push downSOL is currently consolidating and building liquidity.
For a short position, we need to see a liquidity sweep into the supply zone, supported by the volume profile, followed by the price breaking below the 200-period EMA for final confirmation.

Price respected the level. The rest is execution.BINANCE:SOLUSDT just tapped the 1H OB near 155.75 — a zone defined by structure, not emotion. If you’ve been following the narrative, this isn’t a dip. It’s reaccumulation before displacement.
Here’s the setup:
Price tagged the OB at 155.75, perfectly aligning with the 0.618 fib — the algorithm’s comfort zone
Below this lies 153.95 — the invalidation level for the long idea
First upside target sits at 158.27 → then 159.83 → then a full rotation into 164.46, where we meet a 1H OB stacked with prior inefficiencies
The volume profile shows clear acceptance in this range. If we hold and rotate back above 157.01 with strength, expect continuation. If we sweep below 153.95 and fail to reclaim, the idea flips.
Execution clarity:
Longs from 155.75–155.00, invalidation below 153.95
First reaction target: 158.27
Full structure target: 164.46
Below 151.67 = deeper reprice scenario into weekly inefficiencies
No noise. No hype. Just structure. The chart is clean — the plan is already in motion.
Want more setups like this before they move? Profile description has them.

Solana Still Bearish, Moving LowerI will alert you here when the bearish potential is completely nullified. Right now, Solana is still bearish. This applies to all other major projects that I shared recently but I will also update those.
The maker produced a rejection yesterday, 3-June, as a lower high. This implies a bearish continuation. The two levels mapped on the chart are the main support zone.
Since the first level is already being challenged, we can aim for the second one.
Once the correction is over, we will go bullish again.
Some of the smaller altcoins can grow while the rest of the market crashes down. Choose wisely. It will be hard right now.
Namaste.

HolderStat┆SOLUSD channel surferCRYPTOCAP:SOL exited a falling channel, built a clean growing channel and parked on 165 USDT support. Repetitive consolidation mid-way and a projected path to the 190 USDT level underscore continuing strength, with trendline confluence favoring upside continuation.

SolanaSol usdt Daily analysis
Time frame daily
Risk rewards ratio >3.5 👈👌
Target 248$
Green line is a historical up trend for solana

They see a rejection. I see a setupSOL swept the low, ran back to premium, and is now hovering in a reactive FVG.
Most traders see uncertainty here — but this is exactly where structure sharpens.
Here’s what just happened:
Price reversed off a well-defined STB and reclaimed the inefficiency above
It pierced into 162.35 before rejecting — not a failure, but a setup
That move left behind two stacked 1H FVGs
We’re now in the upper one — a re-entry pocket if you understand what this is
This zone between 158.21 and 156.93 is where I expect a reaction. If it holds, structure is preserved and the push toward 161.41 → 168+ resumes.
If it fails, we likely probe 153.83 or deeper into 151.51 — one last shake before the run.
Bias: Long
Trigger: Clean reaction off 1H FVG, higher low formed
Invalidation: Below 151.51
Target: 162.35 first, then 168.93+ on continuation
More setups like this — structured, timed, no fluff — are in the profile description.
No group chat noise. Just levels that matter.

Open long when this happens...My bias for Solana is very bullish. But the current price set up is very similar to April 2022 when the price started to have a major downside move. (See blue vertical line in the chart)
Similarities between April 2022 and today's chart set up in the daily chart:
1) The price moved from the peak (Historical all time high) to trough in the descending parallel channel over four months.
2) The price finally moved out of the the channel and decisively moved up to the major support resistance line (see red horizontal line)
3) Both RSI and MACD have moved way above the overbought territory and the lines are crossed to the downside.
4) EMA21 has crossed above EMA 55, but the EMA200 is still above EMA21 and 55.5) The price has moved and closed above all EMAs but it is pulling back.
I have already finished spot buying at a much lower price point, but I am now looking for a long trading opportunity if the parabolic run is going to happen.
The set-ups for a long trade that I am waiting for are:
1) EMA 22 and EMA 55 are to move above EMA 200.
2) The price to pull back to EMAs and move up and close above EMA 21.
3) RSI and MACD to come back to at least 0 if not below 0 and start to move to the upside.
The set up where the orange vertical line in the chart is a good example of a sort of entry set up described above.

How low can Solana go?SOL is potentially creating a local low around $150. If buyers step in and price holds these levels, we could see a reversal, reclaiming previous support around $160.
A rejection from $160 and breaking this week's lows ($150) could signal a retest of previous levels from $130 - $140.
My personal instinct is still weary of the fact that price has been rejected twice from the 1D 200MA, potentially signaling even further weakness for SOL.

Bitcoin needs to hold the major support at 104,5 k on 2 WeekBitcoin needs to close above the previous 2 week candles to confirm the next major upside move. A close below would most likely lead to a drop in next week. 9th of June we will know for sure what the future has for us.
BITSTAMP:BTCUSD
COINBASE:BTCUSD
NASDAQ:MSTR
CME:BTC1!
CRYPTOCAP:OTHERS
COINBASE:ETHUSD
BINANCE:SOLUSD

SOLANA It has good growth potential in midtermThe SOL will increase $150 and reach to the top of the wedge in the coming weeks .
Give me some energy !!
✨We spend hours finding potential opportunities and writing useful ideas, we would be happy if you support us.
Best regards CobraVanguard.💚

They saw consolidation. I saw controlled accumulation at OB.SOL just printed what looks like sideways noise — but structure tells a different story.
Price swept the 0.786 fib at 151.44, tapped into a refined 4H OB, and held. That isn’t indecision. That’s deliberate compression — Smart Money accumulating just beneath the surface while the herd waits.
Volume profile confirms it. We’re sitting on a high-volume node, and price hasn’t broken it with conviction. Every wick down is a test — and every recovery is another sign of intent.
If price holds above the 4H OB zone, I expect delivery first into 161.49 — an unmitigated OB that lines up with prior liquidity. From there, 171.62 becomes the macro draw. That’s where imbalance meets memory.
Execution alignment:
🟩 Entry: 151.44–153.00 (OB retest zone)
🎯 TP1: 161.49
🎯 TP2: 171.62
❌ Invalidation: Break below 150.53 with displacement
This isn’t consolidation. This is foundation.
I don’t wait for permission. I wait for price to tip its hand.

SOL - Another run?Look another run means another buy and buy looks dope only if it doesnt breaks the red box for whatsoever reasons!!
