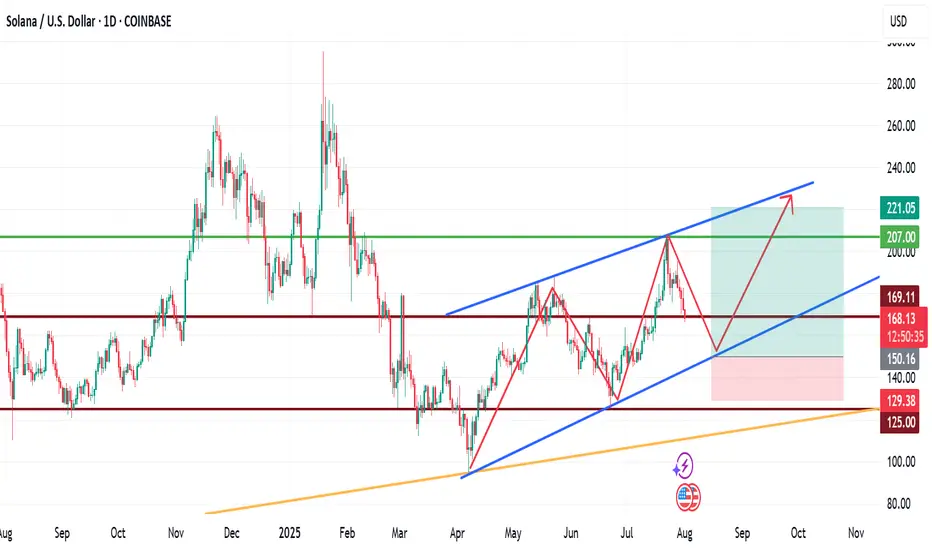
My View for SOLANA next moveMy View for SOLANA next move.
Technically, SOL has been trading within a channel for a while now, with the formation of HHs and HLs.
If fundamentals play out positively long to mid-term, we are likely to see SOLNA fall to $150 zone before another upward leg forms. This leg may rally to as high as $220.
Trade with care.
If you found this helpful, please connect with me.
Like, comment and share
Solanaanalysis
Very Bullish!!
Solana chart looks very bullish. The price is currently dropping but I think it is a very healthy correction.
Weekly chart:
1) all momentum indicators just entered the bull zone.
2) The chart is forming higher highs.
Daily:
1) EMA55 finally crossed EMA200. The last time they crossed was October 2023 (see red vertical line in the chart) and it was the beginning of the macro bull trend.
2) Momentum indicators have reached overbought territory and crossed to the downside, however, given weekly momentum indicators have just entered the bull zone, this move is likely to be corrective action.
3) When EMA55 and EMA200 cross, the price often retraces initially to EMAs (21, 55 or 200). Once it completes the pull back, I anticipate the price to move to the previous ATH and beyond.
This is the time when high leverage trading volume increases.
Be careful not get wicked out. Focus on monthly/weekly/daily charts and ignore the noise in the lower timeframes.

Still bullish in the higher time frames Solana has been struggling to break and stay above $170-200 zone this cycle.
It has been a very difficult asset to trade, however, I can see more bullish setups than bearish setups in higher timeframe charts.
Monthly:
1) July monthly candle closed above Fib 0.618 and formed higher high higher low.
2) RSI and MACD are still in the bull zone.
3) Stochastic are in the bear zone, but they are pointing to the upside.
Weekly:
1) EMA21 is still above EMA55.
2) The current weekly candle is forming bearing engulfing candle, however, there are two more days before it closes. It is still above EMA 21.
3) RSI orange line (RSI based moving average) is moving upwards and entering the bull zone.
4) MACD is about to enter the bull zone.
5) Stochastic hasn't reached overbought territory yet.
6) The set up of these three momentum indicators is very similar to the set up in Oct 23 before Solana started a massive bull trend. (see red vertical line)
Daily:
1) EMA21>EMA55>EMA200
2) As I said in the previous articles, EMA 55 and 200 don't cross easily. But when they do, the price often pulls back significantly before it starts to move in the direction of the trend.
3) Daily candle broke below EMA21, however, the price is reacting strongly to EMA55.
4) The price is still higher high higher low.
I will wait and see if the price is going to bounce off from $143 -157 region. (see blue rectangular block).

SOLANA could have a major retracement Solana completed a major ABC correction into a supply zone on the higher time frame (HTF), taking out the previous quarter’s highs.
On the daily chart, the RSI is overbought and signals the potential for a significant retracement.
Price action on the 4-hour chart shows a series of lower highs, indicating a bearish trend. If Solana fails to break above the previous high and trigger a market structure shift, the downtrend is likely to continue, leading to a deeper retracement on the higher time frames.

Solana to $260?SOL is testing previous resistance as support around $180.
Reclaiming $184 could signal a test of last week's highs around $206.
Claiming $206 as support could signal a push towards $260.
Losing $180 could signal a retracement towards $165 or 1D 200MA.

Solana Holds Firm Above VWAP and TrendlineFenzoFx—Solana remained above the ascending trendline and the monthly VWAP, currently trading sideways inside the wedge.
Critical support is at $173.3, and the market outlook remains bullish above this level. If this demand level holds, we expect Solana to resume its bullish trajectory and target the recent highs at $206.4.

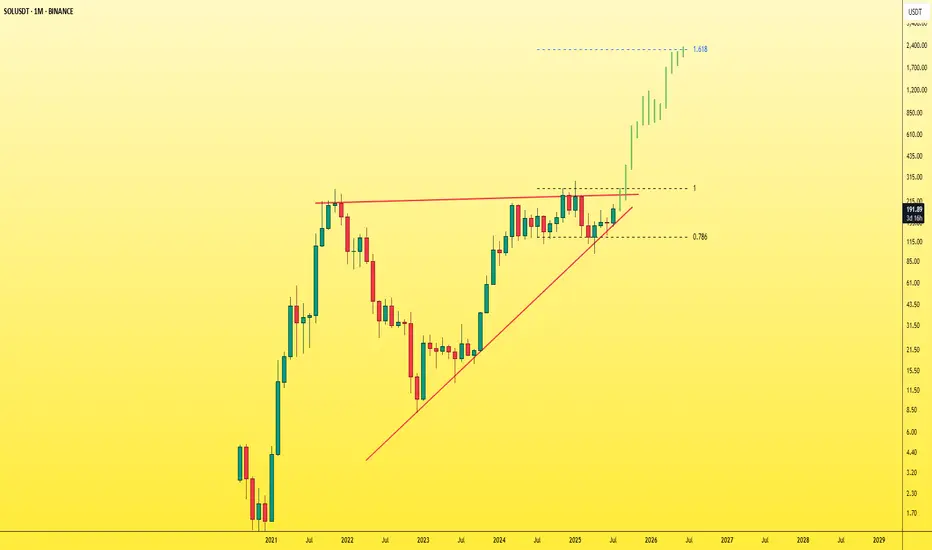
SOL - Don't miss the breakout before it's too late!The symmetrical triangle pattern on the monthly timeframe is showing signs of weakening after multiple failed breakout attempts — and now, a breakout seems highly likely.
Once SOL breaks out of this triangle, it will enter price discovery mode , opening the door to a massive bullish move. At that point, most traders will start saying “it’s too late”, while SOL keeps rallying aggressively — fueled by FOMO and liquidity traps.
You'll see:
- People outside the market waiting for a pullback that never comes.
- Traders inside the move getting shaken out by small dips and volatility.
Right now, SOL is still in a fair trading zone and available at a reasonable price .
Don’t wait for it to explode and then chase. Get in before the breakout .
Best Regards:
Ceciliones🎯
Opened longI opened a long position.
Ideally it is safe to wait for EMAs to line up for the bull trend (EMA21 > 55> 200) in the Daily chart. However, there are many indications that the price will start to move to the upside and the upside move might be quite aggressive. So I decided to open a long position with a small position size.
The reasons for opening a long position:
Daily:
Bull candle has closed above EMA21 for a few times.
RSI lines have crossed and entered the bull zone.
MACD lines are about to enter the bull zone.
Stochastic lines are above to cross and move up.
The price has been staying above Fib 0.236 level for about 10 days.
The price has broke and closed above the descending parallel channel.
4H:
All momentum indicators are in the bull zone.
EMA21 is above EMA 55.
The price has closed above EMA200.
The price is consolidating above the top descending parallel channel.
It is not the perfect bull trend set up, however, there are enough confluences for the price to start to move to the upside.
Entry price: $142.59 (blue horizontal line in 4H chart)
Stop Loss: $130.40 (red horizontal line in 4H chart)
Target: $195 (green horizontal line: Fib 0.5 level in Daily chart and fair value gap zone)
$178 is a strong support and resistance area, so if it starts to stall, I might take a partial profit.
Fingers crossed.

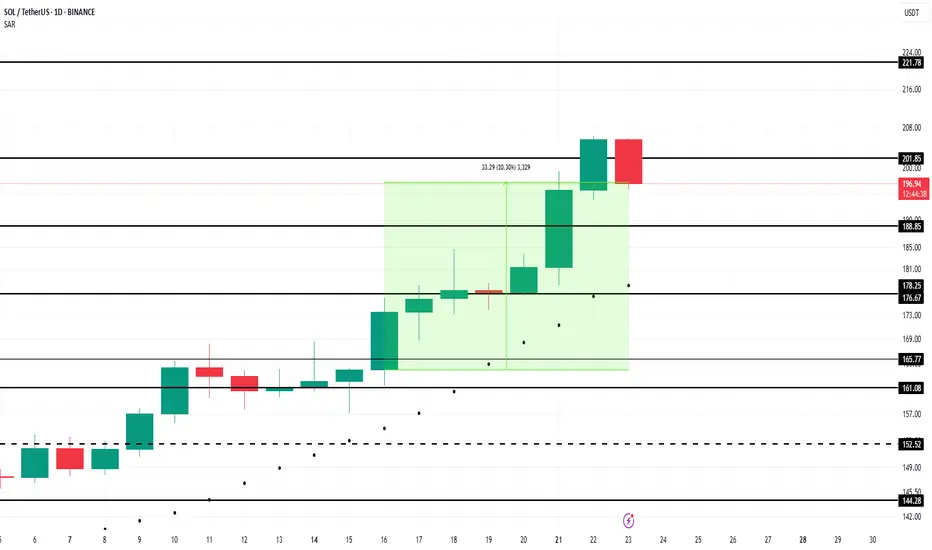
Solana Price Faces Reversal At $200 As Profits Hit 5-Month HighBINANCE:SOLUSDT price has risen 21% in the past week , now trading at $199. Despite breaching the $200 mark, Solana has failed to maintain this level, marking a five-month high.
The Net Unrealized Profit/Loss (NUPL) indicator for BINANCE:SOLUSDT shows that profits have reached a five-month high . This signals that many investors are in profit, raising concerns about a potential sell-off.
If these factors hold true, BINANCE:SOLUSDT price could decline toward the support levels of $188 or even drop to $176 . A move below these levels could erase a significant portion of the recent gains and shift the altcoin into a bearish trend.
However, if investor confidence remains strong and the market continues to show bullish signs, BINANCE:SOLUSDT could stabilize above $200 . Securing this level as support could propel the price back toward $221, invalidating the bearish outlook.
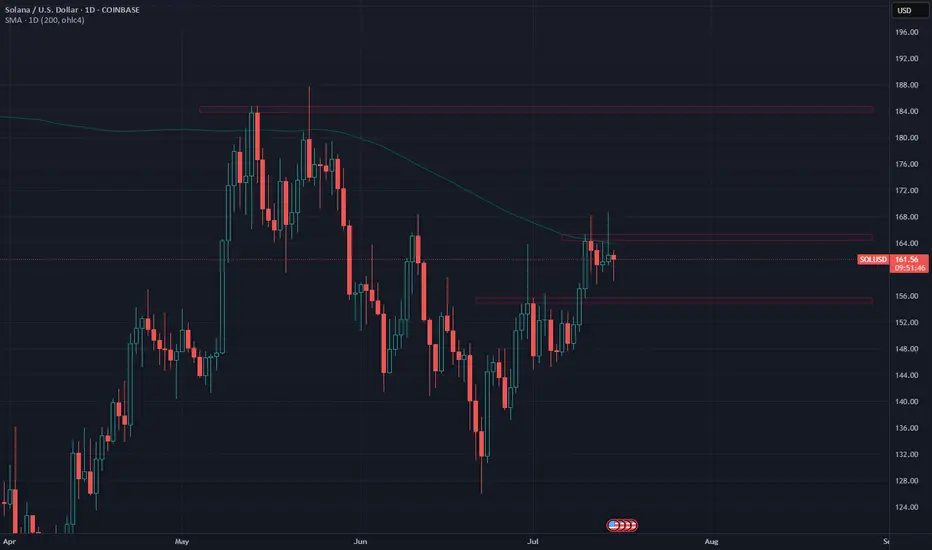
Solana's battle continues. But for how long?The battle for Solana to overcome the 1D 200MA continues.
A daily closed above $166 could signal a push towards May Hs around $185.
The last time SOL traded above 1D 200MA was in Feb. Since then, the daily 200MA has been acting as resistance.
If Solana can finally start trading above the 200MA and reclaim $185, it could signal higher prices and a test of January Hs around $270.
In the short term, support can be expected around $156 should price start to show some weakness... Losing it wouldn't be nice...
What do you expect from Solana in the short term?
"Solana Heist in Progress! Will the Breakout Hold or Fake Out?"🔥🚨 "SOLANA HEIST ALERT: The Ultimate Bullish Raid Plan (Breakout or Fakeout?)" 🚨🔥
🌍👋 Greetings, Market Pirates & Profit Bandits!
(English, Spanish, Portuguese, French, German, Arabic—we speak MONEY.)
💎 STRATEGY BASED ON THIEF TRADING STYLE 💎
(High-risk, high-reward—steal the trend or get caught in consolidation!)
🎯 MISSION: SOL/USD (Solana vs. Dollar) CRYPTO HEIST
🐂 Direction: LONG (But watch for traps—cops & bears lurk nearby!)
🚀 Escape Zone: ATR line (High-Risk Profit-Taking Area)
⚠️ Warning: Overbought? Reversal? Police line at resistance? TAKE PROFITS EARLY!
📈 ENTRY: "THE BREAKOUT HEIST BEGINS!"
Trigger: Wait for candle close ABOVE 148.50 (MA)
Alternative Entry: Buy stop above MA OR buy limit on pullback (15m-30m TF)
🛎️ SET AN ALERT! Don’t miss the breakout—thieves strike fast.
🛑 STOP LOSS: "DON’T GET CAUGHT!"
Thief SL: 136.00 (2H Previous structure Swing Low) (Adjust based on your risk & lot size!)
⚠️ Warning: If you ignore this, you’re gambling—your loss, not mine.
🎯 TARGET: "LOOT & BOUNCE!"
🎯 167.00 (or escape earlier if the trend weakens!)
🧨 Scalpers: Only play LONG—use trailing stops to lock in gains!
📢 NEWS & RISK WARNING
🚨 Avoid new trades during high-impact news! (Volatility kills heists.
🔒 Use trailing stops to protect profits if the market turns.
💥 BOOST THIS HEIST! (More boosts = more profit raids!)
👉 Like ✅ | Follow 🚀 | Share 🔄
💬 Comment your take—bullish or bearish trap?
🚀 Next heist coming soon… Stay tuned, bandits! 🤑

LONG - I am going to add more position when this happensI currently have a small size of long position but I am planning to add more (please see my previous article for my first trade set up), but I am waiting for a certain set up to come up:
Daily:
1) all momentum indicators are entering the bull zone, so there is a plenty of room to move to the upside.
2) The candle has crossed and closed above both EMA 21 and 55, but EMA 200 is currently working as a resistance.
3) EMAs have not crossed and lined up for the bull trend - 21> 55> 200
4H:
1) EMA55 has finally crossed above EMA200!! But when they cross, the price very often has a decent pull back before taking off.
2) Stochastic and RSI are already in the overbought territory which tells me the pull back is likely to happen.
The chart is looking really good for the bull but I am going to wait for the price to retrace to Fib0.5-0.618 zone (see blue rectangular box in 4h chart).
If the price rebounces from that zone and momentum indicators reset to move to the upside, I am prepared to go big on long.
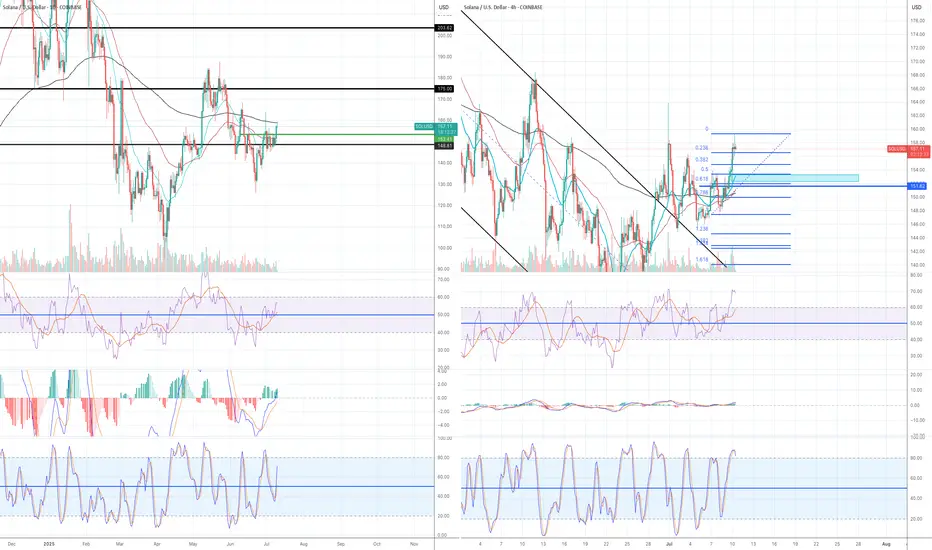
$SOL | Triple Top or Launchpad?Macro to Micro Context:
SOL is now testing a third rejection in the upper 153s, forming a textbook triple top just under a multi-month descending trendline and major Fib resistance. This ceiling has held firm since late June, despite higher lows grinding up from below. Price is now squeezed tightly between compressing demand and stacked supply, with volatility contraction apparent across the board.
The structure is coiling hard but momentum and volume must confirm resolution before positioning aggressively.
Structural & Momentum Breakdown:
Resistance Layering (Reinforced):
Triple Top: Price has repeatedly failed to break above the upper 153s.
Fib Overlap: 50%–61.8% retracement range aligns with both trendline resistance and OB stack.
Order Block Stack: Resistance from mid-153s to low-154s is now reinforced across timeframes (30M → Daily).
Momentum Shifts:
RSI Divergence: Lower highs on RSI across 2H/1H, despite flat or slightly higher price.
PVT Flattening: No fresh accumulation during recent tests.
Volume Decline: Progressive volume deterioration on each retest distributional tone building.
Demand Shelf:
Key demand and support range from low-150s to mid-151s has held through three separate dips.
This is the immediate pivot zone — lose it and vacuum effect likely down into the upper 140s.
Updated Trade Plan:
Rejection Short Setup:
Entry: Breakdown through mid-151s with confirming sell volume.
Stop: Above low-154s to account for potential deviation wicks.
TP1: Upper 148s (first OB cluster).
TP2: Mid-146s (Fib + minor support).
TP3: Low 140s (macro demand + wedge base).
Bear Confirmation: RSI breakdown + volume expansion + OB flips into resistance.
Breakout Setup (Only on Clear Validation):
Entry: Strong candle close above low-154s with breakout volume.
Stop: Below low-151s — invalidation of reclaim.
TP1: Upper 157s (Fib zone).
TP2: Low 160s (swing high area).
TP3: Upper 160s (macro breakout expansion).
Bull Confirmation: RSI > 62 on 2H, strong PVT rise, and flip of local OB into demand.
Risk Warning:
Triple tops near macro resistance are high-risk unless clearly broken. This zone is overloaded with historical rejection. Don't front-run the breakout — volume will show you who's in control.
Closing Thoughts:
With a confirmed triple top now visible, SOL is facing its most important rejection zone in weeks. Bulls must reclaim with strength or this becomes a clean setup for rotation into the mid to low 140s. Patience and confirmation are key here. Keep risk asymmetric.
SOL/USD in Clear Downtrend – Short Setup in PlayHi traders! , Analyzing SOL/USD on the 30-minute timeframe, price is currently moving within a defined descending channel, respecting lower highs and lower lows. A recent rejection from the channel top suggests continuation to the downside.
🔹 Entry: 150.09
🔹 Take Profit (TP): 145.47
🔹 Stop Loss (SL): 154.51
The price failed to hold above the 200 EMA and has resumed its downward trajectory. The RSI shows a recent bounce from overbought levels, supporting the bearish momentum. This short setup offers a favorable risk-reward ratio within the context of the broader downtrend.
A clean rejection at resistance and confirmation of the trendline add confluence to this trade idea. Keep an eye on the 145.47 zone, where buyers may attempt to defend the support.
⚠️ DISCLAIMER: This is not financial advice. Every trader is responsible for their own decisions and risk management.

Solana's fate: pump or dump ?Hello friends
You see that Solana, after its good growth, got stuck in a range and is gathering strength. Now, considering the strong upward trend of this currency, it can be said that this force can push the price upwards, but everything is possible in the market, so observe capital management and trade with your will and wisdom.
*Trade safely with us*

SOL – Compression at Resistance IISolana remains locked in a corrective sequence, unwinding from the mid-June $164 high. Price has now respected a clearly defined descending trendline, recently validating it with a third consecutive rejection—establishing it as dominant short-term resistance. Compression is now occurring just above a well-tested 2H order block near 144–139, where bulls must respond or risk cascading into inefficiency zones.
Structural and Momentum Breakdown:
Descending Resistance Structure: Three clean rejection wicks off the same trendline establish this as firm structural resistance. The latest failed bounce confirms this diagonal as active seller control.
Fib Cluster Rejection: Price has struggled below the 50–61.8% retracement (152–155 zone) from the June high, marking that cluster as distribution resistance.
Volume Profile (VRVP): Sitting atop a low-volume pocket between 144.88 and 139.71; below that lies high-acceptance around 132.
Volumized OB Zones: 2H OB between 144–139 overlaps with key support shelf—any breakdown from here opens path to 132–129 range sweep.
RSI: Persistently sub-40 with no bullish divergence—momentum continues to degrade.
PVT: Flat-to-declining, showing no inflow response to support retests—suggests buyers are stepping back even at local lows.
Example Trade Strategy:
Bullish Reclaim Setup:
Entry: Only with breakout and 2H close above 152–153 (above OB and breaking descending resistance).
SL: Below 144.50 (reclaim invalidation).
TP1: 158–160 (Fib 78.6%)
TP2: 164 (100% retrace)
Confirmation Criteria: RSI >50 + breakout volume + PVT uptick.
Bearish Continuation Setup (If OB breaks):
Entry: 2H close under 144.88, confirming OB loss and trend continuation.
SL: Above 148.
TP1: 140
TP2: 138
TP3: 132–129 (macro demand + HVN)
Confirmation Criteria: Momentum stays sub-40 RSI, increased sell volume, and continued PVT drop.

Solana Bullish Outlook Above $140.0Solana's decline from 163.9 eased near the $148.4 support. However, this demand zone expands to $140.0, which is backed by the high volume node.
From a technical perspective, the outlook is bullish as long as Solana trades above $140.0. In this scenario, we expect the price to target at least 50.0% of its previous range, which is approximately $155.38.

Getting close to go long!
Solana bullish momentum is building up from both technical and fundamental perspectives.
Daily chart:
1) A daily candle decisively moved and closed above EMA21 on Sat 28th June.
2) RSI and MACD are still in the bear zone but the lines are crossed and now moving upwards.
3) RSI line is now above 50. When the RSI line moves above 50 and EMA21 closes above 21 at the same time, it is often (not always) an early sign of bullish momentum (see blue vertical lines in daily chart).
4H chart:
1) EMA21>EMA55, but EMA200 is still moving horizontally.
2) All momentum indicators have entered the bull territory. However, when the candle finally broke outside the descending parallel channel and broke and closed above EMA200, momentum indicators reached the overbought territory. It means the price is likely to consolidate first before taking off.
I plan to open a long position when:
1) Wait for the momentum indicators to come down and flip to the upside in the 4H chart.
2) A candle to retest, either EMA 21, 55 and/or 200 and forms a strong green (bullish) candle in the 4H chart.
3) A candle stays above EMA 21 in the 4H chart.

Do not try to buy the dip!!!! It can go lower. My overall bias for Solana is bullish based on its fundamentals. I am a solana investor so I have been accumulating Sol and staking them. I think the price will eventually move up but at this stage I don't see anything bullish in the Solana chart. It is certainly not the buy the dip moment because I can see the price can go much lower from here. (and I can be gladly wrong on this!).
Bearish setups I see in the chart:
1) The $140.50 zone had been working as a support line since April 2025 (red horizontal line in the chart), but the price decisively broke and closed below the zone on Friday.
2) The price has been trapped in the descending parallel channel since early May. Now the price broke below the support line, it might drop further to touch the bottom parallel channel.
3) There is an unmitigated fair value gap (not very strong one) around $125-6 area and the area also was working as a strong support line for several months last year (see blue horizontal line in the chart)
4) There is a large order block at $104 zone. If the downside move is aggressive, it can wick down to this level.
5) The price is below all EMAs.6) EMA 9<14<21<55<200 - Bearish
7) MACD and RSI are deep in the bear zone and they are pointing to the downside.
8) There is a big fair value gap in the weekly chart in the $95 area.
I don't like to go short on the asset I am fundamentally bullish on, so I will just stay on the sideline and observe how the price will unfold in the next few months.

Solana Bearish Divergence, 20% Drop Incoming?Hey Realistic Traders!
Bearish Signal Flashing on BINANCE:SOLUSDT , What Signals Are Showing?
Let’s Break It Down..
On the daily timeframe, Solana has formed a double top pattern, followed by a neckline breakout, which is a classic sign of a potential shift from a bullish to a bearish trend.
This breakout was confirmed by a break of the bullish trendline, accompanied by rising selling volume, which reinforces the bearish momentum. Adding to this, a bearish divergence has appeared on the stochastic oscillator. Bearish divergence occurs when price makes higher highs while the oscillator forms lower highs, signaling weakening buying pressure and increasing the likelihood of a reversal.
Given these technical signals, the price is likely to continue moving lower toward the first target at 134.13, with a possible extension to the second target at 114.96.
This bearish outlook remains valid as long as the price stays below the key stop-loss level at 180.26.
Support the channel by engaging with the content, using the rocket button, and sharing your opinions in the comments below.
Disclaimer: "Please note that this analysis is solely for educational purposes and should not be considered a recommendation to take a long or short position on Solana.

SOLANA Eyes Recovery After Retesting Monthly LowFenzoFx—Currently, SOL/USD trades at approximately $148.37, testing the previous monthly low, which aligns with a bullish fair value gap and is backed by a high-volume node area.
A close and stabilization above $149.3 can spark the uptrend. In this scenario, the next bullish target could be the $168.38 resistance.

Daily EMA 55 needs to move above EMA 200!!
My general bias for Solana is bullish. However, the current setup is very similar to the setup in Feb-Apr 2022 before Solana started a macro bear trend. (see blue rectangular box)
I am still waiting for a long trade opportunity. I am not looking for a short trade. I just need to sit tight and see how the price is going to unfold in the next few months in the daily chart.
The 2022 setup (see blue rectangular box in the chart):
1) EMA55 crossed below EMA 200 on 16th Feb 2022. (red vertical line in the chart)
2)The price found the temporary floor around $80 and sharply moved above both EMA55 and
200. (see light blue rectangular box)
3) It was the dead cat bounce. It was the beginning of the macro down trend.
4)The price spent months and months under $40 in 22 and 23, however, the price eventually
broke above both EMA 55 and 200 and when EMA55 crossed above EMA 200 in Oct
2023 (red vertical line in the chart), the macro bull trend started.
The current setup (see orange rectangular box in the chart):
1) EMA 55 crossed below EMA 200 on the 4th March 2025.
2) The price moved down to $95 area and sharply moved above both EMA 55 and EMA200. However, it failed to stay above them.
3) The price has been oscillating between $140 and $18. The price is still below EMA55 and EMA200. (see orange rectangular block)
In order to start a strong bull trend,
1) the price needs to close and stay above EMA 55 and EMA200.
2) EMA 55 needs to cross and stay above EMA 200. EMA55>EMA200
3) MACD and RSI need to enter the bull zone.
EMA55 and EMA200 do not cross easily (I mean decisively cross). It only happened three times since 2022, however, when they cross, the price moves very aggressively in one direction.
I think Solana is bullish fundamentally. I am not suggesting it is going to start the macro bear cycle. I am pointing out the price is still not showing a clear direction. From a technical analysis point of view, it might take some time before the trend forms. For now, it is only testing my patience!

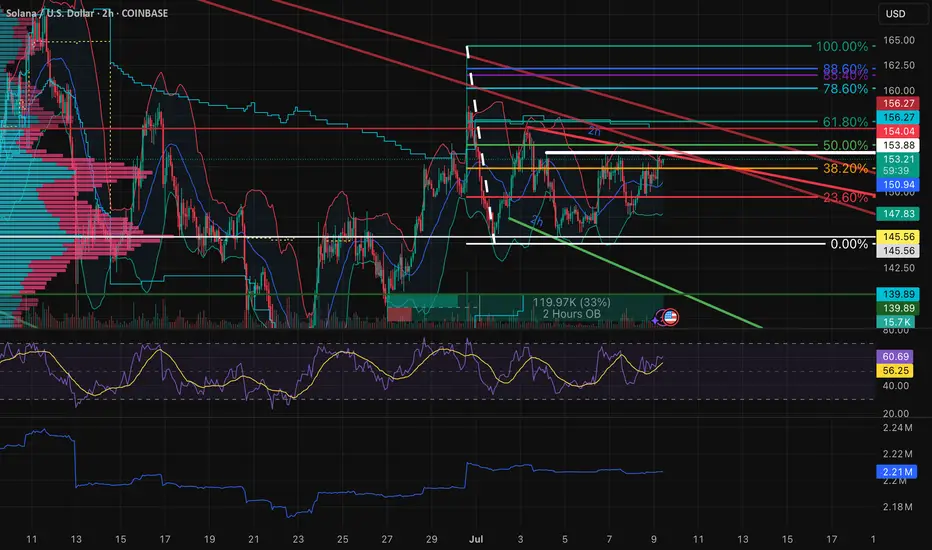
SOL/USDT Rejected at Key Fib Zone – Bulls’ Last Stand at SupportRecap and Bias
The short-term bullish “orange” bounce scenario from the previous analysis failed to materialize. Solana’s price was rejected near 150, printing a lower high, and has since dropped back into the mid 140s. This confirms that the recent rally was a dead-cat bounce rather than a trend reversal.
The updated bias is cautiously bearish. This stems from rejection at resistance, weakening momentum, and a deteriorating volume profile. Unless price reclaims the 148 to 150 zone with strength, the bears remain in control. Only a decisive breakout above that level would shift the short-term outlook back to bullish.
Macro Context
Global risk sentiment remains fragile. The sudden escalation between Israel and Iran in early June, including reports of missile strikes, sparked a flight to safety. Solana’s rally quickly reversed, with price dropping over 15 percent since June 11.
Other geopolitical flashpoints also continue to weigh on investor confidence. The protracted war in Ukraine and ongoing disruptions in Red Sea trade routes have fueled broader market caution. This is contributing to periodic risk-off moves and spikes in volatility across both traditional and crypto markets.
On the economic side, uncertainty around US monetary policy is adding to pressure. Although May inflation cooled slightly, investors remain cautious ahead of upcoming Fed decisions. Crypto assets have traded weakly into these events, reflecting a wait-and-see approach.
Taken together, this geopolitical and macroeconomic backdrop is driving elevated short-term volatility and a higher risk premium in the crypto space. In this context, market participants are increasingly hesitant to take large directional bets without a clear catalyst.
One such catalyst may be the potential approval of a Solana ETF. Optimism has grown, with prediction markets now placing the likelihood of approval near 76 percent by late July. If approved, this could be a game-changing event that re-rates SOL’s medium-term valuation and breaks it out of its current downtrend.
Until then, traders should remain cautious and assume headline risk is elevated.
Multi-Timeframe Technical Outlook
Daily and 4H Trend
The high timeframe structure shows a clear downtrend. Lower highs and lower lows are intact. A double top formation from May broke down cleanly. Most recently, Solana was rejected at a key Fibonacci confluence zone around 149 to 151, which included the 0.618 retracement, the 20-day SMA, and a well-defined supply zone.
After that rejection, SOL has traded along the lower Bollinger Band with increasing volatility. The 20 SMA is now acting as dynamic resistance. All major trendlines have broken.
2H, 1H, and 30m Perspective
Shorter-term charts show SOL attempting to base near 143 to 145 support. Several oversold RSI conditions have triggered bounces, but these have lacked momentum. Harmonic pattern recognition shows that a bearish Deep Crab completed near 152, which marked the local top.
Currently, price remains pinned below descending trendlines and the 1H 20 EMA. Bullish momentum has yet to reappear in any meaningful way.
Key Technical Factors
Resistance: 149 to 151
This zone holds multiple levels of confluence. It includes the 50 to 61.8 percent retracement of the last swing, a 1.272 Fib extension, the 20-day SMA, and prior supply. The rejection at 151.7 was sharp and decisive. Unless price reclaims this zone, it remains a ceiling.
Support: 142 to 145
This is the last meaningful support zone holding price up. It is the neckline of a 12H Head and Shoulders pattern and the base of a previous multi-week range. It also coincides with the lower bound of a prior rising channel. The 50-day MA and 0.236 Fib retracement are also near this zone. If this area breaks, sellers will likely target 130 to 135 next.
Momentum: RSI 14 with MA Overlay
Daily RSI rolled over from above 70 with bearish divergence as price topped. RSI is now below its MA across all timeframes, reflecting negative momentum. On the 4H chart, RSI dipped below 30 and remains weak despite minor relief bounces. Lower timeframes show early divergence but no confirmed reversal signals.
Trend Structure
Price continues to make lower highs and lower lows. The 200-day MA was lost weeks ago. The 50-day is now flattening near 140. A death cross recently printed on the 12H chart, confirming bearish short-term pressure.
Volume and PVT
Volume favors the bears. PVT is in decline, showing more volume on down days than up days. The rally to 150 occurred on weak volume, while selloffs continue to show increasing size. This signals distribution, not accumulation.
Harmonic Patterns
A bearish Deep Crab pattern completed at the recent high. No bullish harmonics are confirmed yet. Traders should monitor the 130 to 125 zone for potential bullish completion patterns like a Gartley or Bat. If those form with oversold signals, they could mark the bottom.
Green Scenario: Bullish Breakout Path
Bias
Only valid on confirmed breakout
Trigger
Break and hold above 150. Ideally, an hourly close above 150 or daily close above 152 confirms the move.
Confirmation
Rising volume, RSI reclaiming 50, and a PVT uptick. A retest of 148 to 150 from above would reinforce the breakout.
Targets
First target is 155, which aligns with the 12H 50 EMA.
Second target is 162 to 165.
Extended targets include 170 to 180 and eventually the 200 psychological level if ETF news hits.
Stop Loss
Below 147 or back inside the 143 zone would invalidate the breakout and suggest a failed move.
Logic
If bulls reclaim 150 with strength, this would invalidate the lower-high structure. Shorts would begin covering and momentum could quickly shift. Breakout entries should focus on confirmation and volume expansion.
Red Scenario: Bearish Breakdown Continuation
Bias
Default scenario
Trigger
Clean break below 142. Daily close under 140 confirms the H and S neckline break.
Confirmation
Failing retests of 142, rising sell volume, and RSI staying suppressed. Price action showing impulsive red candles validates the move.
Targets
First target is 130 to 135.
Second target is 115 to 120.
Final measured move would project into the 100 to 110 zone if trend acceleration continues.
Stop Loss
Any reclaim of 145 to 148 would likely invalidate the breakdown and trap late sellers.
Logic
If this support fails, shorts will press. Bounces will likely be sold into. Traders can enter on the break or the first failed retest of 142. Consider scaling out near 135 and trail stops from there.
Strategy Summary
Current Bias
Leaning bearish unless bulls reclaim 150
Key Levels
148 to 150 is breakout zone
142 to 140 is breakdown zone
Trading Strategy
Range traders can play 144 to 150 but must be nimble
Breakout traders should wait for confirmation above 150
Breakdown traders can short under 140 with stops over 145
Risk Management
Volatility is elevated. Trade smaller size. Use tight stops and trail them. Wait for confirmation, not anticipation. Watch ETF news closely. If delayed, expect continued weakness.
