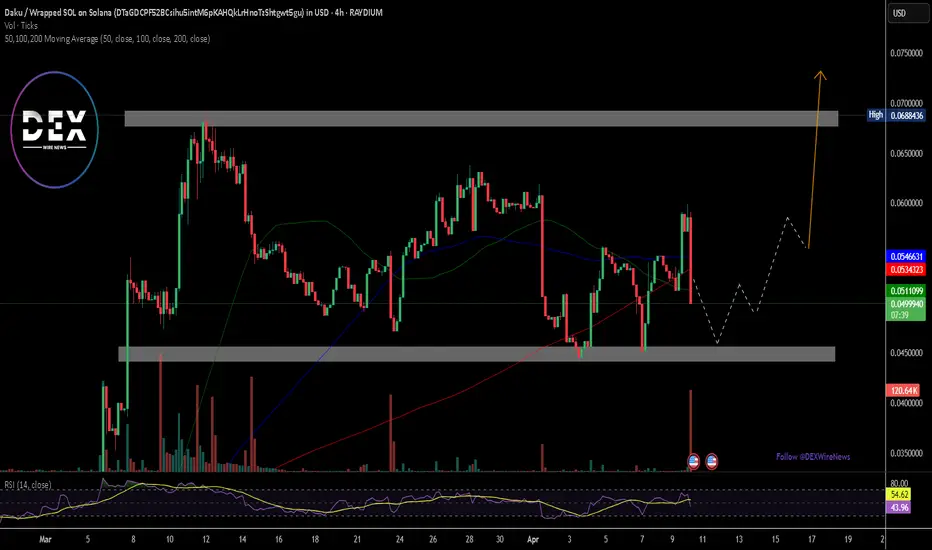
$DAKU Set for A 50% Surge Amidst Bouncing From Support Point Der Daku ($DAKU) a token created and deployed on the Solana blockchain from the pump.fun platform has graduated from a bonding curve and transition to Raydium a DEX on the Solana ecosystem is set to break with an estimated 50% surge.
The asset is trying to find support in the $0.045 pivot. Should $DAKU consolidate from that point, a breakout is imminent without major CEX listings and a thriving community with about 19300 members on Telegram and about 1039 followers on X.
This Dog-themed memecoin on Solana ecosystem could be the next big thing with the RSI at 44.52 this only proffers more room for a breakout albeit the crypto market is highly volatile.
The $0.07 pivot is acting as a resistant point should buyers break above this point, $DAKU will be setting course for a new all time high price.
Solanaanalysis

Solana Found Resistance at $112.0FenzoFx—Solana is trading bearishly and has encountered resistance at $112.0. If this level holds, the downtrend is likely to resume, with a target of $90.0.
>>> Trade SOL/USD, swap free at FenzoFx Decentralized Broker
SOL Trade Plan: Daily Support, Liquidity Grab & Trade Idea.Solana (SOL) is currently navigating a challenging market environment, with broader sell-offs across the crypto space weighing heavily on its price action. On the daily and 4-hour timeframes, SOL has traded into a significant support zone, marked by previous swing lows. This area has historically acted as a magnet for buyers, but the recent dip below these levels suggests a liquidity grab is underway. This move has likely triggered sell stops sitting below the lows, creating the potential for a reversal as smart money steps in. ⚡
Zooming into the 15-minute timeframe, SOL is consolidating within a tight range, reflecting a period of indecision. This range-bound behavior often precedes a breakout, and a bullish break above the range could signal the start of a recovery. A shift in market structure—marked by higher highs and higher lows—would provide further confirmation of bullish intent.
Key Insights:
Daily Timeframe: SOL has dipped below key support levels, sweeping liquidity.
4-Hour Timeframe: Price is overextended, trading into a critical demand zone.
15-Minute Timeframe: Consolidation within a range, awaiting a breakout for directional clarity.
Trading Plan:
Patience is Key: Wait for SOL to break out of the 15-minute range to the upside. 🚀
Market Structure Confirmation: Look for a clear shift to bullish market structure (higher highs and higher lows). 📊
Entry Strategy: Enter long positions after confirmation, with a stop-loss placed below the range low. 🛡️
Profit Targets: Focus on resistance levels on the 4-hour and daily timeframes for potential take-profit zones. 🎯
Levels to Watch:
Support Zone: Previous daily swing lows, now acting as a liquidity zone.
Resistance Zone: The upper boundary of the 15-minute range and key levels on the 4-hour chart.
This setup highlights the importance of waiting for confirmation before entering a trade. While the liquidity grab below support is a promising signal, a breakout and bullish structure are essential to avoid false moves. As always, this is not financial advice—traders should conduct their own analysis and manage risk appropriately. ⚠️

$LUCE Gearing For A Comeback Amidst Bullish Symmetrical TriangleLUCE token ( LSE:LUCE ) a token created on the Solana ecosystem is set for a parabolic surge after breaking out of a symmetrical triangle pattern.
The asset has undergone multiple trough and crest pattern prior the market's volatility. So many assets faced extreme selling pressure for the past 2 days amidst Donald Trump's Tax Tariff laws, a move that saw about $2.85 trillion wiped out from the US stock market yesterday.
However, LSE:LUCE managed to break of a symmetrical triangle pattern despite the dip, setting its compass above the 1-month high. Should LSE:LUCE breakout of the 1-month high resistant point, a move to a $50 million market cap will be inevitable.
With listings from Bybit, Gateio, MEXC, Bitget, BingX, HTX and quiet a number of exchanges, LSE:LUCE could be the catalyst to spark the next cycle of memes in the Solana blockchain.
LUCE Price Live Data
The live LUCE price today is $0.013456 USD with a 24-hour trading volume of $7,003,198 USD. LUCE is up 0.75% in the last 24 hours, with a live market cap of $13,455,554 USD. It has a circulating supply of 999,999,996 LUCE coins and a max. supply of 1,000,000,000 LUCE coins.

SOL/USDT May SOL lose the weekly support? Key Level to buy!Hey traders! 👋 Let’s dive into the weekly chart for SOLUSDT.
📊 Current Price Action:
SOL is trading at $112.20, down 10.96% on the weekly chart. The price has been consolidating in a "Buying Zone" between the weekly support levels of $110.17 and $131.68. This zone has historically acted as a strong base, with the price bouncing from this area multiple times since late 2023.
🟢 Buying Zone and Support:
The current price is sitting in a critical "Buying Zone" between $110.17 and $131.68. This area has acted as a springboard for previous rallies, and if SOL holds above $110.17, it could be a good opportunity for accumulation. A break below $110.17, however, might lead to further downside toward the next support at $80.18 or even $54.00.
🎯 Target:
If SOL manages to break through the $195.71 resistance, the next major target is its previous ATH at $260. I’ve projected a potential move to $295.71, which would be a 95.71% increase from the current price of $112.20. This target aligns with the historical price structure and Fibonacci extensions.
⚠️ Risk Management:
Keep an eye on the $110.17 support. A weekly close below this level could signal bearish momentum, potentially driving the price toward lower supports. On the upside, watch for a strong breakout above $195.71 with high volume to confirm the bullish scenario.
What do you think about SOL’s setup? Are you bullish or bearish on Solana? Let’s discuss in the comments!
#SOLUSD #Solana #Crypto #TechnicalAnalysis #Breakout

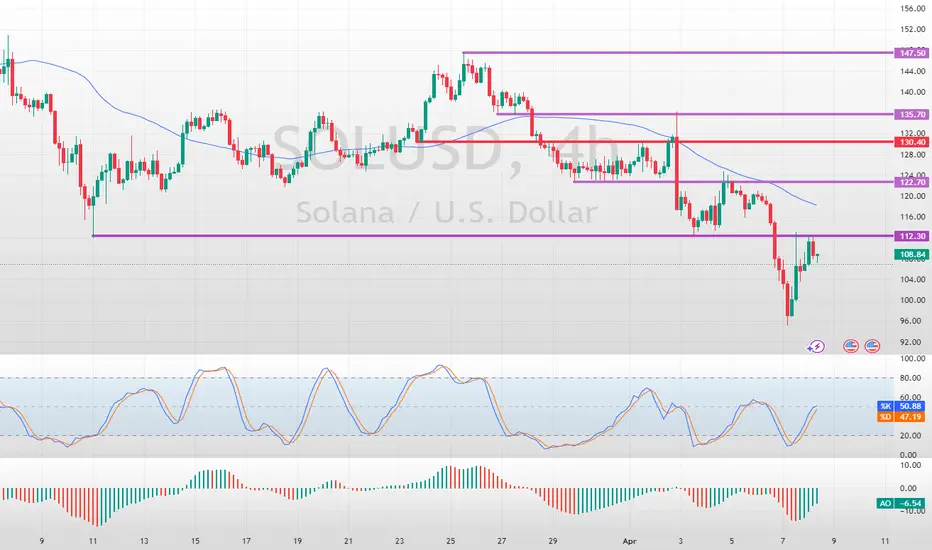
Solana Trades Sideways: Awaiting a BreakoutFenzoFx—Solana trades sideways. A break below 122.7 can trigger the downtrend, targeting $112.3.
However, the bearish outlook should be invalidated if Solana closes and stabilizes above 130.4.

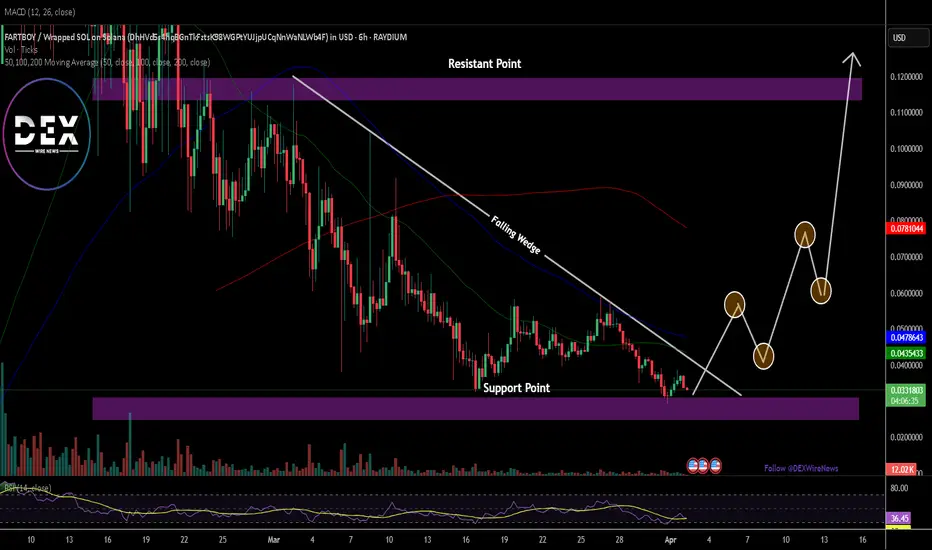
Breaking: $FARTBOY Gearing for 250% Surge Amidst A Falling WedgeThe price of Fartboy coin ($FARTBOY) a token created on the Solana ecosystem is set to go parabolic surging more than 250% amidst breaking out of a falling wedge pattern. The asset is currently looking poised to breakout of the support point range it is currently trading at.
Since listing, $FARTBOY has peaked to as high as $189 million in market cap before retracing to the $33.4 million market cap. With build up momentum, $FARTBOY is set to pull out this same stunt in the long term.
Further solidifying this bullish thesis is the Relative Strength Index (RSI) at 36.68, this metric gives credence to our bullish speculation giving Fartboy more room to capitalize on the oversold nature and weak momentum to pick liquidity up.
About Fartboy
Project is CTO'd by big community over 100k people. X is on 2k followers in 2 days. In talks with some big exchanges hope to get listed everywhere.
This coin was called out via a call out group. People were loving it and then one of the guys who were invested before we even knew about it dumped on us. If you check the chart im sure youll see we made a heck of a comeback!
Fartboy Price Live Data
The live Fartboy price today is $0.033473 USD with a 24-hour trading volume of $669,858 USD. Fartboy is up 0.92% in the last 24 hours, with a live market cap of $33,454,631 USD. It has a circulating supply of 999,440,457 FARTBOY coins and a max. supply of 999,440,457 FARTBOY coins.
solana in the next few dayswe will see bearish on solana in the next few days
we see that 120 usd per solana is good price to enter

$125 buy target for Solana$125 buy target for Solana
My previous analysis came to play. The green TL acted as resistance zone despite the false breakout.
I see this baby coming down to kiss the blue TL as a support level before another push up.
I have a buy entry for $125.
Trade with caution as crypto market is a volatile one.
Please share your thoughts, like and follow for more charts.

Breaking: Raydium ($RAY) Surge 15% TodayRaydium an automated market maker (AMM) and liquidity provider built on the Solana blockchain for the Serum decentralized exchange (DEX) saw its native token NASDAQ:RAY surge 15% today amidst general market volatility.
The asset while trading at the $6- $8 axis just a month ago lost almost 80% of total value plummeting from a high of $8 to almost $1.5 causing panic selling behaviour. But momentum is brewing up.
A move above the 61.8% Fibonacci retracement point could catalyse a bullish move for NASDAQ:RAY with a move to the 1-month high resistant. Similarly, with the RSI at 60, NASDAQ:RAY might experience a temporary cool-off a move that might lead to a consolidatory move to the 1-month low that is not too far from the current market price.
Raydium Price Live Data
The live Raydium price today is $1.86 USD with a 24-hour trading volume of $260,230,671 USD. Raydium is up 15.98% in the last 24 hours, with a live market cap of $541,218,025 USD. It has a circulating supply of 290,847,971 RAY coins and a max. supply of 555,000,000 RAY coins.

JUST IN: First Solana ETFs to Launch in The US TomorrowThe highly functional open source project that banks on blockchain technology’s permissionless nature to provide decentralized finance (DeFi) solutions is set to debut its First Spot ETFs in the US tomorrow.
Price of Solana ( CRYPTOCAP:SOL ) surged 5% today amidst Solana ETFs set to to be launch tomorrow. A news that made Solana reclaim the $130 zone. With build-up momentum and RSI barely overbought at 53 CRYPTOCAP:SOL is set to break the 38.2% Fibonacci retracement point a level that aligns with $150- 160.
A break above this pivot point could send solana on a bullish course with eyes set on the $200- 270 price points.
Similarly, in the case of a reprieve, CRYPTOCAP:SOL might find support in the 78.6% Fibonacci retracement point before picking momentum up.
Solana Price Live Data
The live Solana price today is $130.00 USD with a 24-hour trading volume of $2,966,846,344 USD. Solana is up 5.12% in the last 24 hours, with a live market cap of $66,305,695,632 USD. It has a circulating supply of 510,033,072 SOL coins and the max. supply is not available.

Solana ($SOLUSD) - Monthly Demand InboundQuick TA for Solana $SOL. Many cryptos are at inflection points and will likely break higher or roll over from current prices (I think a move down is more likely, per long-term charts, and am hoping this happens for the sake of buying opportunities). Solana, like many other cryptos, has failed to develop meaningful 1D bullish momentum (RSI holding below 50). Should COINBASE:SOLUSD get another leg down, I'll be watching its behavior as it enters lower demand zones. 101.75-78.87 = monthly demand; 74.85-51.37 = weekly demand, but there are also buy areas higher. If Solana trades lower and approaches the aforementioned levels, use LTFs for signs of exhaustion/downtrend reversal. Personally, I wouldn't use "set-and-forget" buy limit orders; higher-beta cryptos may keep selling off until majors bottom/reverse and/or prices might not trade low enough to hit your limit price. I prefer more of a "hands-on" approach to trading, but to each their own.
On the road, so truncated analysis. Will update when I can. Thank you for your interest and let me know what you think!
Jon
@JHartCharts

SOL/USD "Solana vs U.S Dollar" Crypto Market Heist Plan🌟Hi! Hola! Ola! Bonjour! Hallo!🌟
Dear Money Makers & Robbers, 🤑 💰🐱👤🐱🏍
Based on 🔥Thief Trading style technical and fundamental analysis🔥, here is our master plan to heist the SOL/USD "Solana vs U.S Dollar" Crypto Market. Please adhere to the strategy I've outlined in the chart, which emphasizes short entry. Our aim is the high-risk Green Zone. Risky level, oversold market, consolidation, trend reversal, trap at the level where traders and bullish robbers are stronger. 🏆💸Book Profits Be wealthy and safe trade.💪🏆🎉
Entry 📈 : "The heist is on! Wait for the breakout (160.00) then make your move - Bearish profits await!"
however I advise placing Sell Stop Orders below the breakout MA or Place Sell limit orders within a 15 or 30 minute timeframe. Entry from the most recent or closest low or high level should be in retest.
Stop Loss 🛑:
Thief SL placed at the recent / nearest low level Using the 1D timeframe (200.00) swing trade basis.
SL is based on your risk of the trade, lot size and how many multiple orders you have to take.
Target 🎯:
1st Target - 125.00 (or) Escape Before the Target
Final Target - 90.00 (or) Escape Before the Target
🧲Scalpers, take note 👀 : only scalp on the Short side. If you have a lot of money, you can go straight away; if not, you can join swing traders and carry out the robbery plan. Use trailing SL to safeguard your money 💰.
📰🗞️Fundamental, Macro, COT, Sentimental Outlook:
SOL/USD "Solana vs U.S Dollar" Crypto Market is currently experiencing a bearish trend,., driven by several key factors.
⚡⭐Fundamental Analysis
Blockchain Trends: Solana's blockchain growth is expected to slow down, driven by increasing competition from other blockchain platforms.
Smart Contract Activity: Smart contract activity on Solana's blockchain is expected to decrease, driven by growing competition from other blockchain platforms.
Mining Difficulty: Solana's mining difficulty is expected to decrease, driven by decreasing network hash rate.
Transaction Volume: Solana's transaction volume is expected to decrease, driven by decreasing demand for cryptocurrency transactions.
⚡⭐COT Data
Non-Commercial Traders (Institutional):
Net Short Positions: 55%
Open Interest: 100,000 contracts
Commercial Traders (Companies):
Net Long Positions: 30%
Open Interest: 50,000 contracts
Non-Reportable Traders (Small Traders):
Net Short Positions: 15%
Open Interest: 20,000 contracts
COT Ratio: 0.6 (indicating a bearish trend)
⚡⭐Sentimental Outlook
Institutional Sentiment: 40% bullish, 60% bearish.
Retail Sentiment: 35% bullish, 65% bearish.
Market Mood: The overall market mood is bearish, with a sentiment score of -50.
⚡⭐On-Chain Analysis
Network Hash Rate: Solana's network hash rate has decreased by 10% over the past month, indicating a decline in mining activity.
Transaction Volume: Solana's transaction volume has decreased by 20% over the past month, indicating a decline in network activity.
Active Addresses: Solana's active addresses have decreased by 15% over the past month, indicating a decline in network adoption.
⚡⭐Market Data Analysis
Order Book Analysis: The SOL/USD order book is showing a significant imbalance, with more sell orders than buy orders, indicating a bearish market sentiment.
Liquidity Analysis: Solana's liquidity has decreased by 10% over the past month, indicating a decline in market participation.
Volatility Analysis: Solana's volatility has increased by 20% over the past month, indicating a more unpredictable market.
⚡⭐Positioning
Long Positions: 30% of total positions
Short Positions: 70% of total positions
Neutral Positions: 0% of total positions
Leverage: 2:1 (average)
⚡⭐Next Move Prediction
Bearish Move: Potential downside to 140.00-125.00.
Target: 125.00 (primary target), 90.00 (secondary target)
Next Swing Target: 80.00 (potential swing low)
Stop Loss: 190.00 (above the 30-day high)
Risk-Reward Ratio: 1:2 (potential profit of 30.00 vs potential loss of 15.00)
⚡⭐Overall Outlook
The overall outlook for SOL/USD is bearish, driven by a combination of fundamental, technical, and sentimental factors. The expected slowdown in Solana's blockchain growth, decreasing smart contract activity, and bearish market sentiment are all supporting the bearish trend. However, investors should remain cautious of potential upside risks, including changes in global economic trends and unexpected regulatory developments.
⚠️Trading Alert : News Releases and Position Management 📰 🗞️ 🚫🚏
As a reminder, news releases can have a significant impact on market prices and volatility. To minimize potential losses and protect your running positions,
we recommend the following:
Avoid taking new trades during news releases
Use trailing stop-loss orders to protect your running positions and lock in profits
📌Please note that this is a general analysis and not personalized investment advice. It's essential to consider your own risk tolerance and market analysis before making any investment decisions.
📌Keep in mind that these factors can change rapidly, and it's essential to stay up-to-date with market developments and adjust your analysis accordingly.
💖Supporting our robbery plan will enable us to effortlessly make and steal money 💰💵 Tell your friends, Colleagues and family to follow, like, and share. Boost the strength of our robbery team. Every day in this market make money with ease by using the Thief Trading Style.🏆💪🤝❤️🎉🚀
I'll see you soon with another heist plan, so stay tuned 🤑🐱👤🤗🤩

Solana SOL Will Bounce, But Then Scam!Hello, Skyrexians!
Couple of weeks ago we told you that BINANCE:SOLUSDT will reach $110 in the wave 5 inside the major wave A. You can find this analysis here . Exactly from this zone we have seen the bounce. This bounce is a major correction and those who listen this analysis could already be in the great profit. But anticipated bounce is not the bull run continuation and finally Solana will drop hard because its era is finished.
Let's take a look at the weekly time frame. Here we can see that 5 Elliott waves with the Awesome Oscillator's divergence. After that the major correction has been started. Wave A has been finished at $110 with the green dot at the Bullish/Bearish Reversal Bar Indicator and now we will see wave B, which will reach the Fibonacci 0.5 approximately at $200. From there we will see the scam drop in wave C. It will likely break the major Fibonacci 0.61 support. In this case game is over and Solana can fall for a years or even scam.
Best regards,
Skyrexio Team
___________________________________________________________
Please, boost this article and subscribe our page if you like analysis!

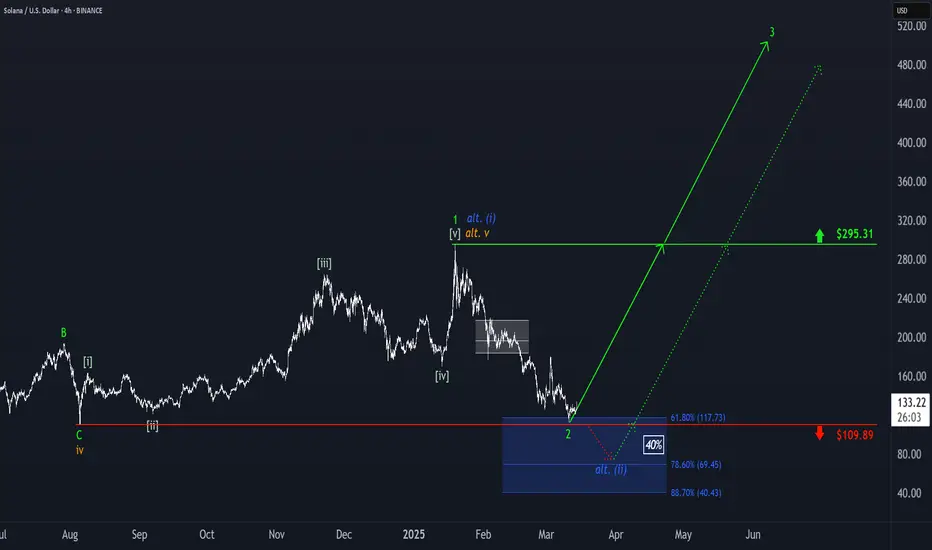
Solana: Precision Landing?!Solana extended its sell-off and reached our blue long Target Zone between $117.73 and $40.43. The price then reacted right at the $109.89 support level, indicating that the low of the green wave 2 has been settled. Thus, the next step should involve a strong rally driven by the green wave 3, ultimately pushing SOL well beyond the $295.31 resistance and past its current all-time high. However, our Target Zone remains active, as there is a 40% chance that the price could revisit this range to complete the blue alternative wave (ii) below the $109.89 mark.
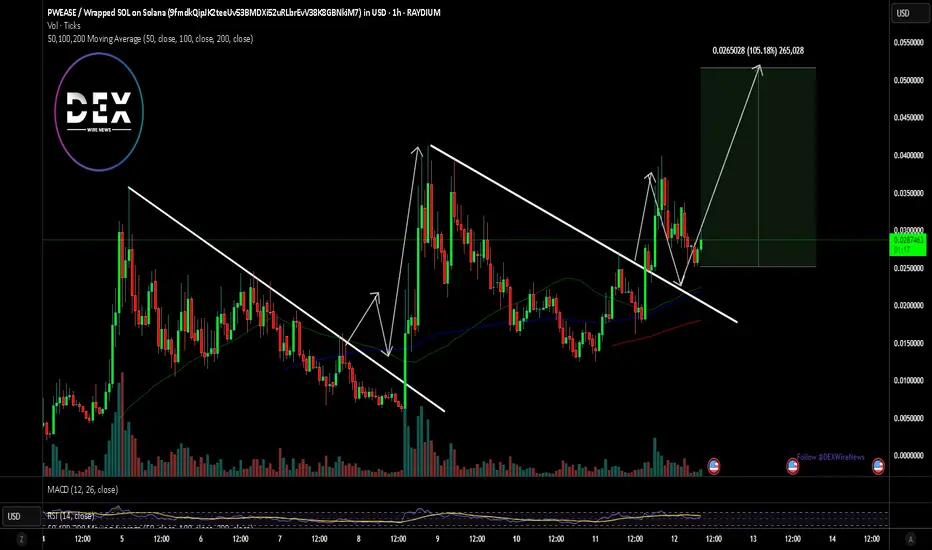
$PWEASE Coin surged 29% Today Amidst Falling Wedge Pattern$PWEASE coin built on the solana blockchain, created on the Pump.fun platform graduated from a bonding curve and is making waves surging 29% for the past 24 hours with eyes set on a 100% surge amidst 2 consecutive falling wedge patterns identified on the chart.
With the RSI at 54.43 this gives more room for $PWEASE to capitalize on the wedge and pick momentum up. If this move should materialize, $PWEASE is set to break the recent All time high of $0.03884.
Pwease Price Live Data
The live Pwease price today is $0.028897 USD with a 24-hour trading volume of $31,547,475 USD. Pwease is up 29.32% in the last 24 hours, with a live market cap of $28,895,321 USD. It has a circulating supply of 999,926,221 PWEASE coins and a max. supply of 1,000,000,000 PWEASE coins.
Chartsssss"What impact do you think Bitcoin has on other coins? Why should Solana’s chart resemble Bitcoin's? Is our trend downward, heading for lower supports? God knows? My heart hurts, I see Bitcoin like this."

Breaking: Solana Tanking HardSolana often referred to as the Ethereum killer is tanking hard albeit Bitcoin also dipped to the $79k zone. Designed to facilitate decentralized app (DApp) creation, aiming to improve scalability by introducing a proof-of-history (PoH) consensus combined with the underlying proof-of-stake (PoS) consensus of a blockchain, SOL has been building a scalable network with massive growth noticeable in its ecosystem.
With Selling pressure increasing, Solana could be on the brink of a massive selling spree with support pegged to the $110-100 pivot points.
However, should Solana bounced back and break pass the 78.6% Fibonacci retracement point, a trend reversal is inevitable. With the RSI at 35, a little shift to a 45 point in RSI could be all what Solana needs to catalysed a bullish breakout.
Solana Price Live Data
The live Solana price today is $124.43 USD with a 24-hour trading volume of $4,578,943,167 USD. Solana is down 6.54% in the last 24 hours, with a live market cap of $63,337,175,317 USD. It has a circulating supply of 509,018,387 SOL coins and the max. supply is not available.

The Era Of Solana SOL Has Been Finished Hello, Skyrexians!
BINANCE:SOLUSDT is the best altcoin of 2023-2024 years because it made 30x from the bottom even on the fake bull run in crypto. This bull run was fake because the true bull run is possible only on DXY dump, but this time Bitcoin and Solana has been growing parallel with the Dollar Currency Index. These assets absorbed all liquidity of the crypto market and on the true bull run it will give it back.
The technical picture is very ugly. Recently we pointed out that Solana has completed the 5 waves cycle and now it's printing ABC correction. Wave A now is in progress and it consists of 5 waves as well. Looking at AO and Fibonacci we can conclude that now asset is finishing the wave 5 which has a target at $110. There we need to see green dot on the Bullish/Bearish Reversal Bar Indicator From there we expect bounce to $200 in the wave B and after that the bear market continuation to targets somewhere below $100.
Best regards,
Skyrexio Team
___________________________________________________________
Please, boost this article and subscribe our page if you like analysis!

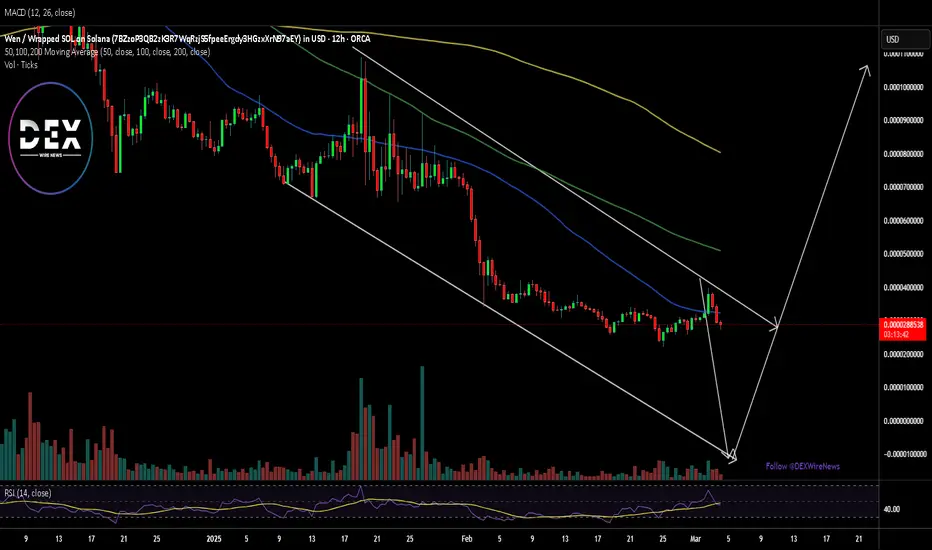
WEN Set For a Breakout Amidst Falling Wedge PatternBuilt on the Solana Ecosystem NASDAQ:WEN seems to be enroute of a bullish reversal amidst a falling wedge pattern. The falling wedge was largely attributed by the overall cool off of the crypto currency landscape with CRYPTOCAP:BTC seeing a major dip from $95k down to $85k.
For NASDAQ:WEN , the asset might further dip to the base of the wedge formed as seen in the chart depicted above before picking liquidity up and surging towards greater highs.
What is WEN
Wen is culture. Wen is a movement. Wen is the internet’s cutest cat and the heart of a growing global phenomenon. More than a brand, Wen is on a mission to become one of the world’s most iconic and beloved IPs.
Wen started as a free airdrop to 1M+ recipients to give back. There were zero influencers, whales, or insiders involved and each recipient received the exact same amount - this made Wen the fairest and widest distributed airdrop ever on Solana. Emphasizing Wen is a coin for the people.
SOL/USDT – Double Zigzag Completed! Is a Bullish Reversal Next?Solana (SOL) has likely completed a Double Zigzag (WXY) correction, with Wave C of Y bottoming at $130.60 (1.0 Fibonacci extension). This suggests a potential trend reversal, but SOL must first break key resistance at $146-$150 to confirm a bullish move.
🔹 Elliott Wave Analysis & Bullish Scenario
If the Double Zigzag correction is complete, SOL could begin a new impulse wave, targeting:
✅ $169-$173 (0.5 Fibonacci retracement, previous Wave B resistance)
✅ $180-$195 (0.382 Fib & major supply zone)
✅ $220+ (Wave 3 extension target)
🔻 Bearish Scenario – Extended Correction?
If SOL fails to break $150, it could indicate that the correction is not yet over, leading to:
❌ Retesting $130 support
❌ Possible extended correction towards $113-$100 (1.272 Fib extension)
📌 Key Level to Watch:
🔹 A break & close above $150 signals bullish continuation.
🔹 A rejection could mean further downside.
📊 Is SOL ready for a breakout, or will we see another leg down? Share your thoughts below! 👇🔥

SOLANA is struggling with 2021 ATHSOLANA is struggling with 2021 ATH.
In 2021, we saw TRADENATION:SOLANA hit $160 zone. If you zoom in on your chart like mine, you will realise why this baby is fighting tooth and nail to break that barrier.
It has pushed above that $260 zone X3 but has been closing below.
Should we expect this asset to fall back to the $222 zone?
My thoughts are on my chart.
Trade with care
