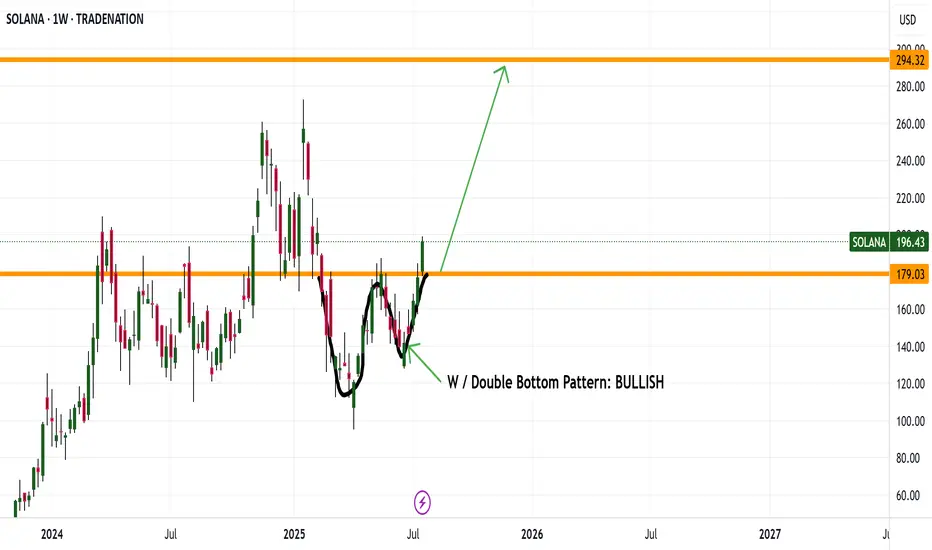
SOLANA DRIVING UP TO 294 Good evening everyone
It looks like SOL made a nice W pattern and now breaking its weekly high is driving up to 294
Enjoy happy trading this bull run
Kris/ Mindbloome Exchange
Trader Smarter Live Better
Solanalong
SOLANA - BULLISH & BAERISH
Hello everyone,
here is my current outlook on Solana (SOL):
Personally, I am currently only watching Solana as we may already be in a correction phase. Nevertheless, there is an interesting scenario where we could still be in a green wave 5, which could potentially reach prices above USD 300.
Possible course:
In April 2025, the bottom may have been found following an ABC formation.
Wave 1 (yellow) could be completed in May 2025.
Wave 2 (yellow) could end in June 2025.
We could currently be in wave 3 (yellow).
Important point to watch:
If the price does not make it sustainably above the yellow wave 1 (approx. USD 190), the probability increases strongly that we are still in a B wave.
This would mean that we are still in a major correction, which could theoretically take us back to around USD 60. In this scenario, wave 1 would have already ended in January 2025 and we would still be in the correction of wave 2.
Conclusion:
The indicators are particularly important in this phase. Keep a close eye on them to better understand the structure.
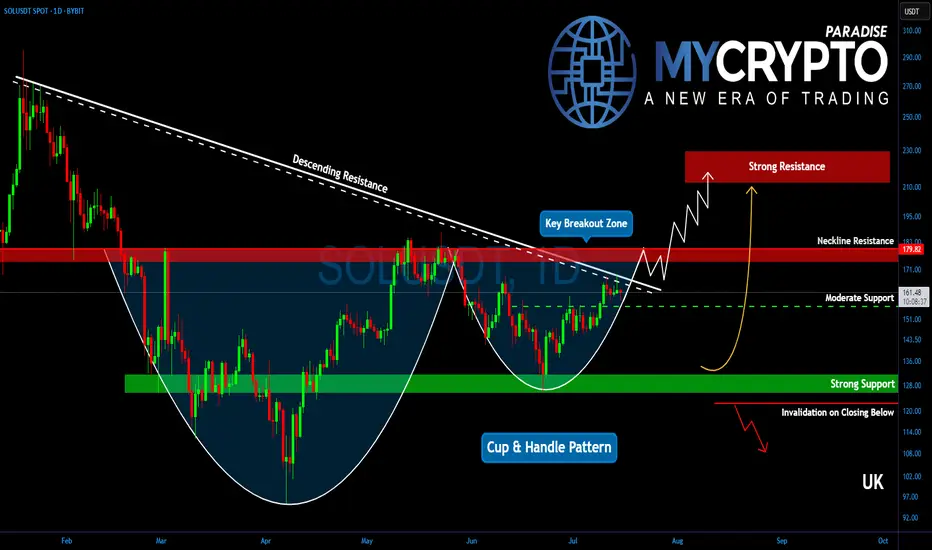
Will Solana Explode? This Important Zone Could Trigger a MoveYello, Paradisers! Is #Solana about to break free into a new bullish wave? After months of struggling under key resistance, the bulls are finally making a serious push… but only one zone stands between SOL and a potential explosion.
💎After peaking in January, Solana has remained suppressed under a descending trendline. But now, that trendline is being challenged aggressively, and the price structure is starting to form a reversal pattern that demands attention.
💎Right now, the most important level on the chart is the descending channel resistance at $167. Bulls are actively testing this zone, and if they manage to flip it into support, it could trigger a significant shift in momentum. But just above, at $180, sits an even more critical barrier, the neckline of the current reversal pattern. This entire region between $167 and $180 is the true battleground.
💎#SOLUSDT's confirmed breakout above $180 would be a major technical signal. It would likely send Solana toward the $210 to $225 zone, which marks a significant resistance area. This isn’t just psychological; it also aligns with the 61.8% Fibonacci retracement, a level where institutional players often begin offloading positions
💎As for the downside, support remains solid between $155 and $160. This region is protected by both horizontal demand and dynamic support from key moving averages, offering bulls a stable base to defend. Adding to the bullish case is a potential golden cross formation between the EMA-50 and EMA-200, a signal that, if confirmed, could inject even more confidence into Solana’s price action.
Paradisers, strive for consistency, not quick profits. Treat the market as a businessman, not as a gambler.
MyCryptoParadise
iFeel the success🌴
They see a rejection. I see a setupSOL swept the low, ran back to premium, and is now hovering in a reactive FVG.
Most traders see uncertainty here — but this is exactly where structure sharpens.
Here’s what just happened:
Price reversed off a well-defined STB and reclaimed the inefficiency above
It pierced into 162.35 before rejecting — not a failure, but a setup
That move left behind two stacked 1H FVGs
We’re now in the upper one — a re-entry pocket if you understand what this is
This zone between 158.21 and 156.93 is where I expect a reaction. If it holds, structure is preserved and the push toward 161.41 → 168+ resumes.
If it fails, we likely probe 153.83 or deeper into 151.51 — one last shake before the run.
Bias: Long
Trigger: Clean reaction off 1H FVG, higher low formed
Invalidation: Below 151.51
Target: 162.35 first, then 168.93+ on continuation
More setups like this — structured, timed, no fluff — are in the profile description.
No group chat noise. Just levels that matter.

$145 Stop, $262 Target — SOL Bullish Breakout Looks UnstoppableThe chart presents a clean bullish reversal from the previous downtrend observed between February and early April. After breaking the long-term descending trendline, Solana (SOL) flipped structure and has been printing higher highs and higher lows, signaling a transition into an uptrend.
This is reinforced by the ascending blue trendline that currently acts as a dynamic support. Each price correction respects this trendline, showing that buyers are defending higher levels.
✅ Key Technical Justifications for Bullish Bias
1. Break of Downtrend
The long-term descending trendline from the February highs was broken decisively.
This signifies a trend reversal, which has since seen SOL push into a new bullish channel.
2. Strong Higher Lows
Price has been consistently making higher lows, respecting the blue uptrend line.
This price behavior confirms increasing bullish momentum.
3. Support Level Holding
The horizontal support around $96.59 was respected during the reversal.
This base forms the foundation of the bullish wave we’re seeing now.
4. Bullish Price Compression
After a strong impulsive rally, SOL has entered a consolidation just above the trendline.
This resembles a bullish flag or pennant, typically a continuation pattern.
5. No Major Resistance Until $260+
The nearest strong resistance sits around $262.56, which aligns with a previous breakdown zone and coincides with your take-profit (TP) zone.
With no serious resistance in the $200–$250 range, price can climb smoothly once bullish continuation triggers.
📊 Trade Setup (Long Position)
• Entry: Around $174.30 (current market zone as per chart)
• Stop Loss (SL): $145.00 (Below recent swing low and dynamic support — gives the trade breathing room)
• Take Profit (TP): $262.56 (Aligned with horizontal resistance and measured move target)
Risk-to-Reward Ratio: 2.91
Potential Reward: +50%
Potential Risk: -17%
This trade setup is not only favorable from a risk/reward standpoint but also follows price structure, trend, and technical confirmation.
🧠 Final Thoughts
Solana (SOL) on the daily chart has shifted into a clearly bullish phase after a textbook breakout from its multi-month downtrend. The current setup shows a healthy trend structure, room for price expansion, and favorable technicals across the board. The next key breakout will likely occur above $180, and that can send SOL quickly into the $240–$260 range. If you're looking to ride a swing position into Q2-Q3, this is one of the cleaner long setups currently on major altcoins.

SOL/USD "Solana vs U.S Dollar" Crypto Heist Plan (Day/Swing)🌟Hi! Hola! Ola! Bonjour! Hallo! Marhaba!🌟
Dear Money Makers & Robbers, 🤑 💰💸✈️
Based on 🔥Thief Trading style technical and fundamental analysis🔥, here is our master plan to heist the SOL/USD "Solana vs U.S Dollar" Crypto Market. Please adhere to the strategy I've outlined in the chart, which emphasizes long entry. Our aim is to escape near the high-risk Yellow MA Zone. Risky level, overbought market, consolidation, trend reversal, trap at the level where traders and bearish robbers are stronger. 🏆💸"Take profit and treat yourself, traders. You deserve it!💪🏆🎉
Entry 📈 : "The heist is on! Wait for the MA breakout (156.00) then make your move - Bullish profits await!"
however I advise to Place Buy stop orders above the Moving average (or) Place buy limit orders within a 15 or 30 minute timeframe most recent or swing, low or high level for Pullback entries.
📌I strongly advise you to set an "alert (Alarm)" on your chart so you can see when the breakout entry occurs.
Stop Loss 🛑: "🔊 Yo, listen up! 🗣️ If you're lookin' to get in on a buy stop order, don't even think about settin' that stop loss till after the breakout 🚀. You feel me? Now, if you're smart, you'll place that stop loss where I told you to 📍, but if you're a rebel, you can put it wherever you like 🤪 - just don't say I didn't warn you ⚠️. You're playin' with fire 🔥, and it's your risk, not mine 👊."
📍 Thief SL placed at the nearest/swing low level Using the 4H timeframe (130.00) Day / Swing trade basis.
📍 SL is based on your risk of the trade, lot size and how many multiple orders you have to take.
🏴☠️Target 🎯: 175.00 (or) Escape Before the Target
🧲Scalpers, take note 👀 : only scalp on the Long side. If you have a lot of money, you can go straight away; if not, you can join swing traders and carry out the robbery plan. Use trailing SL to safeguard your money 💰.
💰💵💸SOL/USD "Solana vs U.S Dollar" Crypto Market Heist Plan (Swing/Day) is currently experiencing a bullishness,., driven by several key factors. .☝☝☝
📰🗞️Get & Read the Fundamental, Macro, COT Report, On Chain Analysis, Sentimental Outlook, Intermarket Analysis, Future trend targets... go ahead to check 👉👉👉🔗🔗🔗
⚠️Trading Alert : News Releases and Position Management 📰🗞️🚫🚏
As a reminder, news releases can have a significant impact on market prices and volatility. To minimize potential losses and protect your running positions,
we recommend the following:
Avoid taking new trades during news releases
Use trailing stop-loss orders to protect your running positions and lock in profits
💖Supporting our robbery plan 💥Hit the Boost Button💥 will enable us to effortlessly make and steal money 💰💵. Boost the strength of our robbery team. Every day in this market make money with ease by using the Thief Trading Style.🏆💪🤝❤️🎉🚀
I'll see you soon with another heist plan, so stay tuned 🤑🐱👤🤗🤩

$136 Resistance Crumbles: Solana Bulls Take the Lead...Solana Breaks Key Resistance – Eyes Set on $150 and $180 Targets
Solana (SOL) has successfully broken through the strong resistance level at $136 after several failed attempts, signaling a potential continuation of its current uptrend. This breakout marks a significant technical milestone for SOL, which had previously struggled to maintain momentum above this price zone.
If Solana is able to hold above the $136–$137 level, it could open the door for further gains, with short- to mid-term price targets around $150 and $180. The breakout aligns with broader bullish sentiment in the crypto market and may attract new buyers looking to ride the trend.
For traders or investors interested in entering a position, the $136–$137 range could offer a potential entry point, provided the breakout holds and is supported by volume. As always, proper risk management is recommended, and watching for confirmation on the next few candles could be key.

Many bullish signs for Solana longSolana is starting to look like building bullish momentum.
Bullish signs:
Daily:
The price broke out of a prolonged descending parallel channel, retested the top trendline of the channel and started to move up.
The price broke and closed above EMA21 (first hurdle of many!) and has been above it for several days.
The price is above the major support zone around 117.
RSI and MACD are both still in the bear zone, however, they are clearly pointing up and about to enter the bull zone.
4H:
MACD and RSI are both in the bull zone.
The price is above EMA 22.EMA 21 is above EMA55.
EMA 200 is traveling horizontally across the recent price range, but the latest candle was strongly bullish and closed above all EMAs.
While EMA200 is horizontally moving, the price will probably oscillate in the range bound. But once EMAs line up for the bullish set up (EMA21 > 55> 22) in 4H, I will consider open a long position based on the 4H chart.

SOLANA (SOL/USDT) – TP: 170 - 252 & 295SOLANA (SOL/USDT) is currently trading at $130.17 after rebounding from a well-defined sell-side liquidity zone between $98 and $131. The recent weekly candle shows a strong bullish recovery (+22.93%), suggesting that liquidity has been swept and buyers are stepping in. This level has historically served as a key accumulation zone, and the bounce aligns with oversold conditions on the StochRSI, which is now curling upward — indicating growing bullish momentum. If price sustains above the $125–131 level, the next immediate upside target lies between $170 and $188, where prior supply and consolidation occurred. A confirmed breakout above this range opens the path toward a higher resistance zone between $254 and $295 — a region that aligns with unfilled inefficiencies and previous price distribution.
The ideal swing trade approach would be to enter on a pullback within the $110–125 range, set a stop loss below $98, and scale out at the $170 and $254 levels. This setup offers a favorable risk-to-reward ratio of approximately 1:3.5.
Trade Strategy Suggestion (Swing or Positional):
Entry: Ladder between $115–$125 on retrace
SL: $105–110 (below wick low)
TP1: $170–188
TP2: $254–295
Scaling Out: 50% at TG1, rest at TG2 or trail stops above $200
With macro tailwinds like renewed interest in Solana’s DeFi and meme coin ecosystems, institutional flow returning, and technical confirmation across multiple timeframes, this could be a high-conviction mid-term play for swing traders and positional investors alike.
🔮 Narrative & Fundamentals:
ETH L2 congestion → SOL gets transactional inflows
SOL’s DeFi, NFT, and memecoin activity resurging (e.g., SEED_WANDERIN_JIMZIP900:WIF , SEED_DONKEYDAN_MARKET_CAP:BONK ecosystem)
Institutional flow picking up (Grayscale SOL trust rallying)
SOL remains one of the fastest L1s with growing developer traction


SOLUSD Solana Bullish Change: LongAs I published yesterday the bearish trade setup,shortly before reaching the profit target,I have closed it manually and updated below the trade idea in the comment section,to inform you. Because of bullishness of tech,and weaker USDolalr, now crypto,specially Bitcoin, Solana and Eth following Tech: Bullish.
Important:
177.93 (red line9 IS MAJOR RESISTANCE: AND PROTECTED TWICE BY THE EBARS;WHO CONTROL THAT REGION:
Once broken Solana can climb higher to 228-244. If not, we will face sudden fast drop down, and possible midterm bearish sideways:
aS IT WILL BE THE THIRD ATTEMPT OF sOLANA TO BREAK THIS MAJOR RESISTANCE; IF NOT SUCCESSFULLY; WE CAN ESTIMATE BEARISH SIDEWAYS8sALAMI DOWNRUN).
Also it will be possible,that in April 2025 because of Trumps tariffs, the market participants
will liquidate their positions immediately,capital outflow.
Currently as Godl and silver also bearish,check my other ideas, the bullish trendchange is cinfirming.
Neverthe less I mad 4 different setups and profit targets,to help ya making better decisions.
Additionally expect the unexpeted:If the market conditions change before your profittarget reached,take that profit and prepare for the other direction.
Volatility and many unexpected events awaiting us.
I,for my part,ignore news, even what Trump says,and just focus to the chart, because it tells exactly when then market starts to change its direction.So I recommand ignoring the hype and news, but being focused on what the market and price does:The market is always right!
Have a nice day.

JUST IN: First Solana ETFs to Launch in The US TomorrowThe highly functional open source project that banks on blockchain technology’s permissionless nature to provide decentralized finance (DeFi) solutions is set to debut its First Spot ETFs in the US tomorrow.
Price of Solana ( CRYPTOCAP:SOL ) surged 5% today amidst Solana ETFs set to to be launch tomorrow. A news that made Solana reclaim the $130 zone. With build-up momentum and RSI barely overbought at 53 CRYPTOCAP:SOL is set to break the 38.2% Fibonacci retracement point a level that aligns with $150- 160.
A break above this pivot point could send solana on a bullish course with eyes set on the $200- 270 price points.
Similarly, in the case of a reprieve, CRYPTOCAP:SOL might find support in the 78.6% Fibonacci retracement point before picking momentum up.
Solana Price Live Data
The live Solana price today is $130.00 USD with a 24-hour trading volume of $2,966,846,344 USD. Solana is up 5.12% in the last 24 hours, with a live market cap of $66,305,695,632 USD. It has a circulating supply of 510,033,072 SOL coins and the max. supply is not available.

Solana ($SOLUSD) - Monthly Demand InboundQuick TA for Solana $SOL. Many cryptos are at inflection points and will likely break higher or roll over from current prices (I think a move down is more likely, per long-term charts, and am hoping this happens for the sake of buying opportunities). Solana, like many other cryptos, has failed to develop meaningful 1D bullish momentum (RSI holding below 50). Should COINBASE:SOLUSD get another leg down, I'll be watching its behavior as it enters lower demand zones. 101.75-78.87 = monthly demand; 74.85-51.37 = weekly demand, but there are also buy areas higher. If Solana trades lower and approaches the aforementioned levels, use LTFs for signs of exhaustion/downtrend reversal. Personally, I wouldn't use "set-and-forget" buy limit orders; higher-beta cryptos may keep selling off until majors bottom/reverse and/or prices might not trade low enough to hit your limit price. I prefer more of a "hands-on" approach to trading, but to each their own.
On the road, so truncated analysis. Will update when I can. Thank you for your interest and let me know what you think!
Jon
@JHartCharts

SOLANA – Technical and Fundamental OutlookTechnical Analysis
Solana (SOL) remains within a Falling Wedge structure, a historically bullish reversal pattern. The price is currently testing a key support zone at $124.29, where demand accumulation could trigger a breakout. A successful rebound from this level may confirm a shift in momentum.
A breakout above $150.51 would validate a bullish reversal, with the next key resistance target aligning with the previous All-Time High (ATH) of $296.99. Failure to hold $124.29 as support could extend the correction, requiring confirmation of price action before further positioning.
Fundamental Analysis
Solana continues to exhibit strong growth, with a 37.09% price increase in the last 30 days and 79.96% gains over the past 90 days, reflecting sustained investor confidence. Institutional sentiment remains positive, with VanEck analysts projecting a $520 price target by the end of 2025, contingent on continued adoption and ecosystem expansion.
Key fundamental drivers include Solana’s high-throughput architecture, enabling thousands of transactions per second with low fees, positioning it as a competitive layer-1 blockchain. Recent integrations, including Visa's USDC settlement adoption, further reinforce its real-world utility.
Risk Considerations
Regulatory uncertainties remain a critical factor, with SEC classification concerns presenting potential headwinds. Additionally, speculative market activity, particularly within Solana's meme coin sector, has contributed to heightened volatility, necessitating cautious risk management.
Conclusion
The confluence of technical support levels and strong fundamental adoption metrics suggests a pivotal moment for Solana. A breakout from the Falling Wedge structure would reinforce bullish momentum, while macro and regulatory developments remain key monitoring factors.

ICT TA Daily view, we are in a Fib golden zone + OB!We have reached a Golden Fib retracement Zone , With a an OB in that Zone too + VFG1 . and thar happened after positive BOS!
We need to see a strong reaction there, with good volume to go up!
Internal structure is showing reversals, but waiting for External Structure to confirm .
Over all, we are still in a bullish bias, this is a good area to start buying, but confirming a stronger signal is better to wait a daily candle closes above 209$ .
We can buy from here, and if continued to go down, the second buy Zone is between (82 to 105$)
Keep in mind this is daily analysis, don't leverage or over leverage!
and this is Technical Analysis, however Crypto could not follow over TAs, spicily if market updates on Fundamentals showed something.

Solana Faces Pressure as Pump.fun Offloads $28M SOLThe cryptocurrency market has recently witnessed a notable shift as Pump.fun, Solana’s memecoin launchpad, executed a massive sell-off of 148,759 SOL, worth approximately $28.22 million, to Kraken. This move has triggered speculations regarding Solana’s potential downtrend, raising concerns among investors and traders.
Market Reaction to the Sell-Off
Despite the global crypto market reaching an impressive $3.16 trillion, Solana is facing notable resistance. The recent sell-off by Pump.fun has heightened fears of a continued bearish trend. To date, the launchpad has transferred a staggering 2,280,377 SOL, valued at approximately $462 million, to Kraken. While 264,373 SOL has already been sold for 41.64 million USDC, Pump.fun still holds 16,877 SOL, indicating the possibility of further market activity.
Additionally, Solana’s decline comes as Binance Coin (BNB) surpasses it in market capitalization, now standing at $96.15 billion compared to Solana’s $93.16 billion. Market sentiment is shifting as Solana’s 24-hour trading volume has decreased by 11.51%, now at $3.39 billion.
Technical Analysis
At the time of writing, Solana is trading at $191.17, experiencing a minor 0.20% increase in the last 24 hours. However, the broader trend presents a concerning outlook.
Key Technical Indicators:
- Break of Structure (BOS) Nearing $180: Currently, Solana is hovering around the BOS level. A confirmed breakdown below $180 could trigger a severe selling spree, pushing SOL toward deeper support zones.
- Fibonacci Retracement Analysis: A breakout above the 38.2% Fibonacci retracement level could invalidate the bearish sentiment and spark a bullish rally. If Solana reclaims this level, it could set sights on the $400-$500 range in the long term.
Conclusion
Solana is at a critical juncture, with its price movement hanging in the balance between bearish pressure and potential recovery. The recent Pump.fun sell-off has introduced uncertainty, but key technical levels and broader market sentiment will dictate the next move. A break below $180 could trigger a major decline, while a decisive move above the 38.2% Fibonacci level could renew bullish momentum. Traders should stay alert and adapt their strategies accordingly in this volatile environment.

Franklin Templeton Joins Solana ETF Race: A Game-Changer for SOLThe race for a Solana ( CRYPTOCAP:SOL ) ETF is heating up, and Franklin Templeton has just thrown its hat into the ring. The global investment giant has filed documents in Delaware to register the Franklin Solana Trust, marking a significant step toward launching a spot Solana ETF. This move comes hot on the heels of similar filings by VanEck, Grayscale, and Canary Capital, signaling growing institutional interest in Solana. But with CRYPTOCAP:SOL ’s price down 3.34% in the last 24 hours and 9.99% over the past week, is this ETF momentum enough to reverse the bearish trend? Let’s break it down.
Institutional Adoption Heats Up
Franklin Templeton’s entry into the Solana ETF race is a major vote of confidence for the blockchain platform. Known for its high-speed transactions and low fees, Solana has become a favorite among developers and users alike. Now, with institutional heavyweights like Franklin Templeton, VanEck, and Grayscale vying for a Solana ETF, the cryptocurrency is poised to gain even broader recognition.
Key Developments:
1. Franklin Solana Trust:
Franklin Templeton’s filing in Delaware is the first step toward launching a spot Solana ETF. While the SEC has yet to approve any Solana ETF, the growing number of applications highlights the asset’s potential.
2. SEC’s Stance:
The SEC has acknowledged filings from Grayscale and Canary Capital, opening a 21-day public comment period. However, Solana’s classification as an unregistered security remains a hurdle. Analysts suggest that Litecoin and Hedera ETFs might have a better chance of approval due to their clearer regulatory standing.
3. Franklin’s Crypto Index ETF:
Franklin Templeton has also filed for a **Crypto Index ETF**, which initially tracks Bitcoin and Ethereum but could expand to include other altcoins like Solana. This shows the firm’s long-term commitment to the crypto space.
Technical Analysis
Despite the bullish news, Solana’s price action tells a different story. Here’s what the charts are saying:
CRYPTOCAP:SOL is currently trading at $195, down 2.36% in the last 24 hours. The token has struggled to maintain momentum, with a 9.99% drop over the past week.The Relative Strength Index (RSI) is in bearish territory at 41, indicating that selling pressure outweighs buying interest. This suggests that CRYPTOCAP:SOL could face further downside before finding support.
If Bitcoin dips to $90,000, CRYPTOCAP:SOL could test the $180–$160 zone, a critical support area. However, a breakout above $240 (38.2% Fibonacci retracement level) could reignite bullish momentum, potentially pushing CRYPTOCAP:SOL toward its all-time high of $270.
Solana’s 24-hour trading volume is down 14.03% to $3.81 billion, despite its $95.94 billion market cap. This divergence suggests that retail interest may be waning, even as institutional demand grows.
Conclusion
Franklin Templeton’s entry into the Solana ETF race underscores the growing institutional interest in the blockchain platform. While the current price action is bearish, the potential approval of a Solana ETF could be a game-changer, driving CRYPTOCAP:SOL to new heights. For now, investors should keep an eye on key support and resistance levels, as well as regulatory developments.
Will Solana break out of its slump and reclaim its all-time high? Only time will tell, but one thing is clear: the race for a Solana ETF is just getting started.

Will Breakouts Happen Here?as you see on the chart a critical zone has been pointed which if Solana Price and Volume can breakout this Zone we will have an powerful uptrend for short term trend which we can Call it;
Go Too the Moon ASAP Sol Jan
Do Not Scared for any downward cause all of them are the opportunities for Having and Holding this valuable Coin which is very related To ETH too But the act of them will be different in next 6 month but after approvement of SOLANA's ETF both Mother Coins will have Same Trend as best Ecosystem of
Cryptocurrency Market
at last: Solana In Unhopeful condition

We're off to a great start SOLANAWe're off to a great start SOLANA
🚀 Trade with the professionals of THS - Wave Theory!
🔹 All trades are based on wave analysis.
🔹 Fixed stop loss and take profit for risk management.
🔹 100% automation: copy trades through CopyFX service.
🔹 Reliability and transparency: the results are confirmed by the market.
📈 Don't miss the chance to earn steadily!
👉 Connect to CopyFX with THS and start copying profitable trades right now!
💡 Details on our channel and in the app!
Solana ($SOL) - ATH Break-Out - A Bull To RememberTRADENATION:SOLANA and I are good friends.
I called the ultimate #Support and went #Bullish on $SOL.
Went #Long on COINBASE:SOLUSD ever since 10, then 15, then ramping the the #Bull on 145.
* see related idea for details.
Cashed in at 250, was the #ATH and had doubts, seen the #Correction coming.
What's next for BINANCE:SOLUSDT ?
A Massive #Pump, that's what!
TRADENATION:SOLANA will become Number 3 on #TotalMarketCap ( CRYPTOCAP:TOTAL ), mark my words.
Why? Why will TRADENATION:SOLANA pump?
It's quite simple actually.
It's all about the MARKETSCOM:BITCOIN pushing #MarketSentiment up.
But even BITSTAMP:BTCUSD will need to provide some #Correction, and that is seen on the CRYPTOCAP:BTC.D chart.
There will be some wild #Swings on #BTC.
I believe that with the #AltSeason and #AltCoins Cycle starting, CRYPTOCAP:SOL will bloom.
That's because of TRADENATION:SOLANA connection with the #Solana #Meme Coins Ecosystem.
CRYPTOCAP:TOTAL2 & CRYPTOCAP:TOTAL3 are about to shoot.
Billions printed, coded #MemeCoins.
COINBASE:SOLUSD - #TechnicalAnalysis
- #ElliottWave: Wave 4 Complete
- #RunningFlat at #ATH
- #Break-Out
- Wave 5 Confirmation
My CRYPTOCAP:SOL Buy Levels
- Entry @ 240
- SL @ 140
- TP @ 500

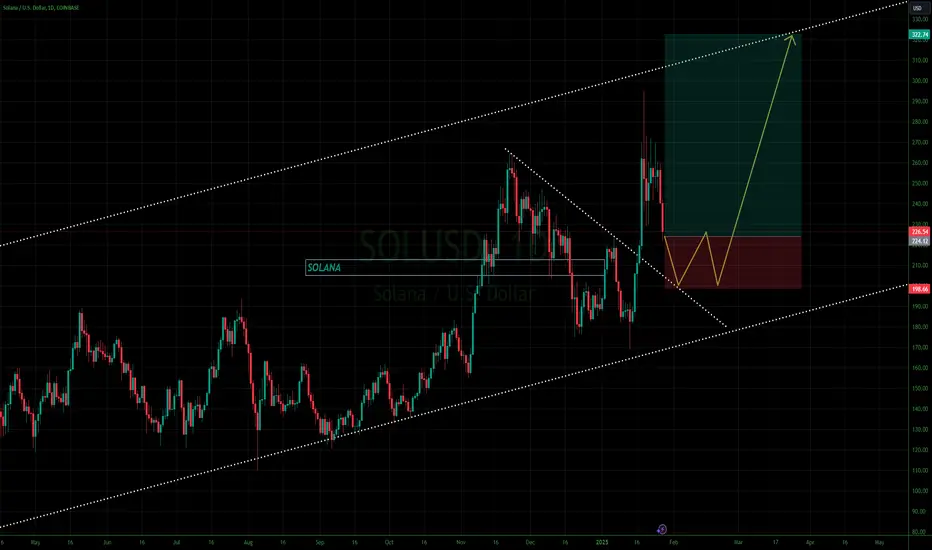
SOlANA: will this buy continue?SOlANA: will this buy continue?
This baby has once broken out of the consolidation and descending resistance zones.
Will this buy continue?

SOLANA - 900% profit?main idea:
An upward momentum is forming.
At the moment we are in the corrective 4 wave, if we look at the daily candlestick signal, we can assume that we have completed it.
Further I expect growth and formation of the 5th wave, which completes the whole impulse.
The growth target is the area of 656.00 - 1380.00$.
In percentage ratio 400 - 900%. Quite impressive figures.
I'm going in to buy.
I'm targeting maximum targets
As it approaches the designated area, I will keep a close eye on it, so as not to miss the reversal and fix the profit.
Stop - below 121.81
SL/TP ratio - 1/70.
P.S. - who is with me, click on the rocket and subscribe.

SOLANA - Conservative trade for long My most conservative way to enter long based on technical analysis:
1) Daily chart
2) Identify the prolong range bound area and draw Fibonnaci line
3) Wait for daily candle to clearly break and close above Fib 0.786.
4) MACD crosses above 0 line, 1st green histogram shows up5) both RSI and Stochastic (9,3,3) cross, point upwards in 50 zone.
The price on Nov 7th 2024 (blue vertical line) is a good example. Fib 0.786 often works as the very last line of defence for the bear. The price often struggles to move above it and often gets pushed down. When it breaks decisively above and momentum indicators support that move, it often is a high probability trade in my experience. I know Solana will go up sooner or later, but if you are going to trade and want a very conservative entry point, I wiill wait for a daily candle to break and close above $246 where Fib 0.786 and the previous month high are. It also clears the large sell block. But MACD, RSI, Stochastic all need to be in agreement for the bull move.
