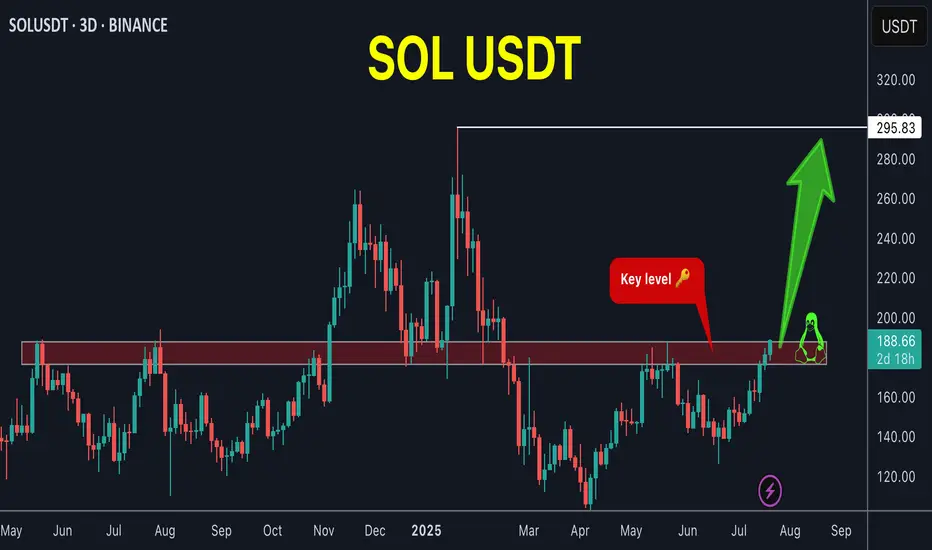
SOL is preparing for new ATHSOL / USDT
Solana didn't make a move since long time but i think its time will come very soon
Currently SOL is trying to breakout the most important key level in chart
Breaking out here => very high chance of making a new ATH
For those who interested in SOL …its the time
Solanasignals
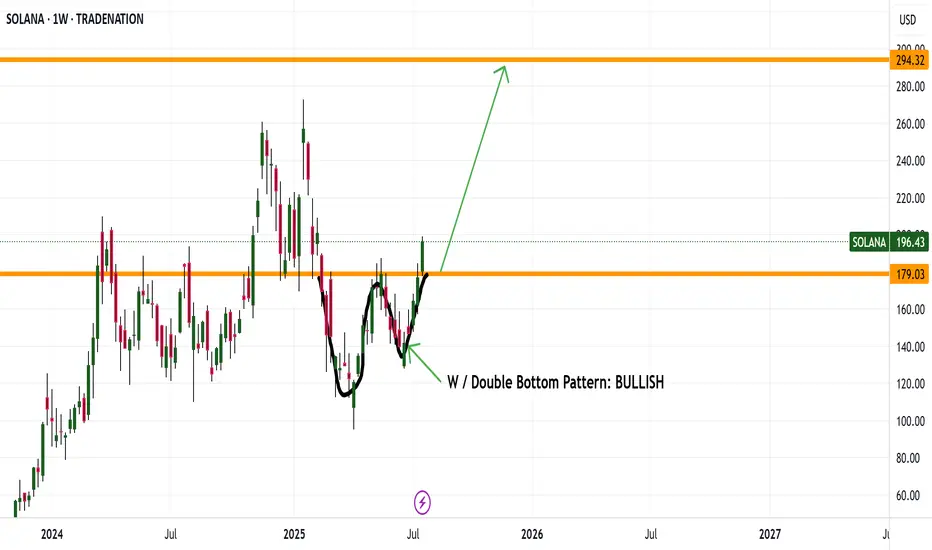
SOLANA DRIVING UP TO 294 Good evening everyone
It looks like SOL made a nice W pattern and now breaking its weekly high is driving up to 294
Enjoy happy trading this bull run
Kris/ Mindbloome Exchange
Trader Smarter Live Better
SOLANA - BULLISH & BAERISH
Hello everyone,
here is my current outlook on Solana (SOL):
Personally, I am currently only watching Solana as we may already be in a correction phase. Nevertheless, there is an interesting scenario where we could still be in a green wave 5, which could potentially reach prices above USD 300.
Possible course:
In April 2025, the bottom may have been found following an ABC formation.
Wave 1 (yellow) could be completed in May 2025.
Wave 2 (yellow) could end in June 2025.
We could currently be in wave 3 (yellow).
Important point to watch:
If the price does not make it sustainably above the yellow wave 1 (approx. USD 190), the probability increases strongly that we are still in a B wave.
This would mean that we are still in a major correction, which could theoretically take us back to around USD 60. In this scenario, wave 1 would have already ended in January 2025 and we would still be in the correction of wave 2.
Conclusion:
The indicators are particularly important in this phase. Keep a close eye on them to better understand the structure.
SOL DOWN TO 146 ? Is this possible? Good evening trading family
Based on what we are seeing here is a typical correcting of any good bull mark needed to sustain our movement upwards. Currently we have spotted 3 levels down to the 146 marker with a these of a bullish move upwards if they hold.
Happy trading folks
Kris/ Mindbloome Exchange
SOL Sell / Short SetupSell at cmp 163.49, 2nd entry mentioned and tp also mentioned, Must keep SL, best of luck.

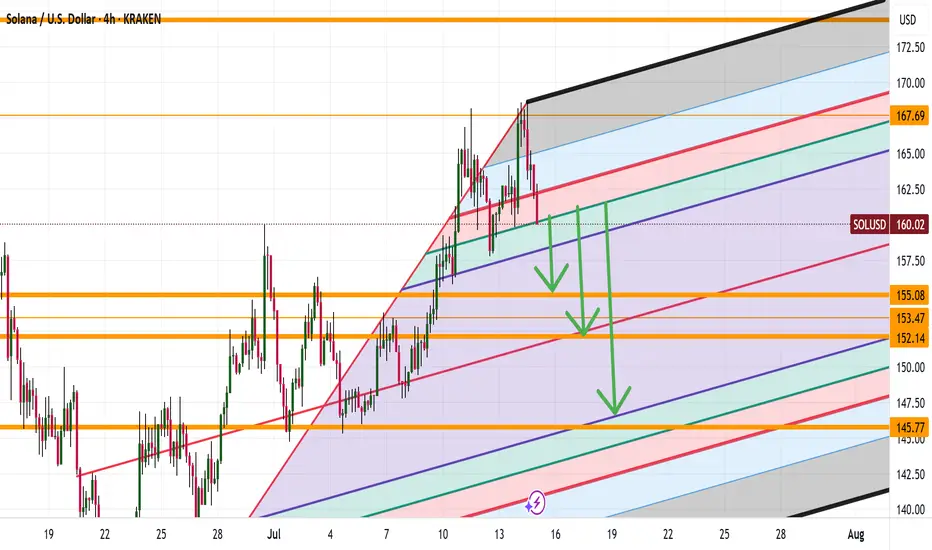
SOL TO 167?Good morning folks
so it looks like we are correcting down possibly down to 153 then seeing a drive up to 167. What are your thoughts on the market for Solana
Looks like things are heating up for Solana
Kris/Mindbloome Exchange
Trade Smarter Live Better

SOL/USD in Clear Downtrend – Short Setup in PlayHi traders! , Analyzing SOL/USD on the 30-minute timeframe, price is currently moving within a defined descending channel, respecting lower highs and lower lows. A recent rejection from the channel top suggests continuation to the downside.
🔹 Entry: 150.09
🔹 Take Profit (TP): 145.47
🔹 Stop Loss (SL): 154.51
The price failed to hold above the 200 EMA and has resumed its downward trajectory. The RSI shows a recent bounce from overbought levels, supporting the bearish momentum. This short setup offers a favorable risk-reward ratio within the context of the broader downtrend.
A clean rejection at resistance and confirmation of the trendline add confluence to this trade idea. Keep an eye on the 145.47 zone, where buyers may attempt to defend the support.
⚠️ DISCLAIMER: This is not financial advice. Every trader is responsible for their own decisions and risk management.

SOL/USD "Solana vs U.S Dollar" Crypto Heist Plan (Day/Swing)🌟Hi! Hola! Ola! Bonjour! Hallo! Marhaba!🌟
Dear Money Makers & Robbers, 🤑 💰💸✈️
Based on 🔥Thief Trading style technical and fundamental analysis🔥, here is our master plan to heist the SOL/USD "Solana vs U.S Dollar" Crypto Market. Please adhere to the strategy I've outlined in the chart, which emphasizes long entry. Our aim is to escape near the high-risk Yellow MA Zone. Risky level, overbought market, consolidation, trend reversal, trap at the level where traders and bearish robbers are stronger. 🏆💸"Take profit and treat yourself, traders. You deserve it!💪🏆🎉
Entry 📈 : "The heist is on! Wait for the MA breakout (156.00) then make your move - Bullish profits await!"
however I advise to Place Buy stop orders above the Moving average (or) Place buy limit orders within a 15 or 30 minute timeframe most recent or swing, low or high level for Pullback entries.
📌I strongly advise you to set an "alert (Alarm)" on your chart so you can see when the breakout entry occurs.
Stop Loss 🛑: "🔊 Yo, listen up! 🗣️ If you're lookin' to get in on a buy stop order, don't even think about settin' that stop loss till after the breakout 🚀. You feel me? Now, if you're smart, you'll place that stop loss where I told you to 📍, but if you're a rebel, you can put it wherever you like 🤪 - just don't say I didn't warn you ⚠️. You're playin' with fire 🔥, and it's your risk, not mine 👊."
📍 Thief SL placed at the nearest/swing low level Using the 4H timeframe (130.00) Day / Swing trade basis.
📍 SL is based on your risk of the trade, lot size and how many multiple orders you have to take.
🏴☠️Target 🎯: 175.00 (or) Escape Before the Target
🧲Scalpers, take note 👀 : only scalp on the Long side. If you have a lot of money, you can go straight away; if not, you can join swing traders and carry out the robbery plan. Use trailing SL to safeguard your money 💰.
💰💵💸SOL/USD "Solana vs U.S Dollar" Crypto Market Heist Plan (Swing/Day) is currently experiencing a bullishness,., driven by several key factors. .☝☝☝
📰🗞️Get & Read the Fundamental, Macro, COT Report, On Chain Analysis, Sentimental Outlook, Intermarket Analysis, Future trend targets... go ahead to check 👉👉👉🔗🔗🔗
⚠️Trading Alert : News Releases and Position Management 📰🗞️🚫🚏
As a reminder, news releases can have a significant impact on market prices and volatility. To minimize potential losses and protect your running positions,
we recommend the following:
Avoid taking new trades during news releases
Use trailing stop-loss orders to protect your running positions and lock in profits
💖Supporting our robbery plan 💥Hit the Boost Button💥 will enable us to effortlessly make and steal money 💰💵. Boost the strength of our robbery team. Every day in this market make money with ease by using the Thief Trading Style.🏆💪🤝❤️🎉🚀
I'll see you soon with another heist plan, so stay tuned 🤑🐱👤🤗🤩

Solana can we hit 186 from this correction ? Hey everyone
currently Solana made a nice correction and looks like if price action can confirm it making a higher high this could be a nice spot for everyone to possibly look at taking a nice long position to 186-191
Let me know what you think
Kris/Mindbloome Exchange
Trade Smarter / Live Better

SOLANA's massive 1W MA200 rebound hints to enormous rally ahead.Solana (SOLUSD) made a very strong rebound on its 1W MA200 (orange trend-line) on the very first week of April. Now that the month is about to close, it has already completed three straight green 1W candles and is aiming for the critical 1W MA50 (blue trend-line) test.
If broken, we expect it to turn into a long-term Support again and target the Higher Highs of the Wedge at $350. After all, the 1W MA200 rebound also made contact on the 2-year Higher Lows trend-line of the Bull Cycle, so technically it is a massive Bottom cluster. The 1W RSI also broke above its MA last week, confirmed the buying pressure.
Given that the recent 3-month correction was -67.23%, identical to the last correction (May 2021) of the previous Cycle, we expect one final rally to the 2.0 Fibonacci extension at $900, if the Higher Highs trend-line breaks.
-------------------------------------------------------------------------------
** Please LIKE 👍, FOLLOW ✅, SHARE 🙌 and COMMENT ✍ if you enjoy this idea! Also share your ideas and charts in the comments section below! This is best way to keep it relevant, support us, keep the content here free and allow the idea to reach as many people as possible. **
-------------------------------------------------------------------------------
💸💸💸💸💸💸
👇 👇 👇 👇 👇 👇

SOL Trade Plan: Daily Support, Liquidity Grab & Trade Idea.Solana (SOL) is currently navigating a challenging market environment, with broader sell-offs across the crypto space weighing heavily on its price action. On the daily and 4-hour timeframes, SOL has traded into a significant support zone, marked by previous swing lows. This area has historically acted as a magnet for buyers, but the recent dip below these levels suggests a liquidity grab is underway. This move has likely triggered sell stops sitting below the lows, creating the potential for a reversal as smart money steps in. ⚡
Zooming into the 15-minute timeframe, SOL is consolidating within a tight range, reflecting a period of indecision. This range-bound behavior often precedes a breakout, and a bullish break above the range could signal the start of a recovery. A shift in market structure—marked by higher highs and higher lows—would provide further confirmation of bullish intent.
Key Insights:
Daily Timeframe: SOL has dipped below key support levels, sweeping liquidity.
4-Hour Timeframe: Price is overextended, trading into a critical demand zone.
15-Minute Timeframe: Consolidation within a range, awaiting a breakout for directional clarity.
Trading Plan:
Patience is Key: Wait for SOL to break out of the 15-minute range to the upside. 🚀
Market Structure Confirmation: Look for a clear shift to bullish market structure (higher highs and higher lows). 📊
Entry Strategy: Enter long positions after confirmation, with a stop-loss placed below the range low. 🛡️
Profit Targets: Focus on resistance levels on the 4-hour and daily timeframes for potential take-profit zones. 🎯
Levels to Watch:
Support Zone: Previous daily swing lows, now acting as a liquidity zone.
Resistance Zone: The upper boundary of the 15-minute range and key levels on the 4-hour chart.
This setup highlights the importance of waiting for confirmation before entering a trade. While the liquidity grab below support is a promising signal, a breakout and bullish structure are essential to avoid false moves. As always, this is not financial advice—traders should conduct their own analysis and manage risk appropriately. ⚠️

Crypto Sell-Off: Is Solana Headed for $80?Without a doubt, Solana was the hottest topic in the crypto market last year and at the start of this one—especially with the meme coin craze.
However, after peaking near $300, the price began to decline in what initially appeared to be a normal correction. But once Solana broke below the $200 mark, things turned ugly, and the price quickly dropped to the key $120 support zone—a level that held strong over the past year.
Now, it looks like Solana is on the verge of breaking below this support, which could trigger an acceleration toward $80, with the $100 psychological level as an intermediate stop.
________________________________________
Why the Downside is Likely to Continue
📉 Bulls Can’t Hold Gains – Short-term rallies are fading fast, showing a lack of real buying strength.
📉 Bearish Engulfing Candle – Yesterday’s price action printed a lower high, adding further pressure on support.
📉 $120 Breakdown Incoming? – If this level fails, expect a sharp decline toward $80.
________________________________________
Trading Plan: Selling Under $130
🔻 Sell Rallies Below $130 – Targeting a move to $80 in the medium term.
🔻 Only a Sustained Move Above $130 – Would shift Solana to a neutral stance—not bullish by any means.
For now, the bearish pressure remains, and selling rallies is the strategy to follow. 🚀

SOL/USDT May SOL lose the weekly support? Key Level to buy!Hey traders! 👋 Let’s dive into the weekly chart for SOLUSDT.
📊 Current Price Action:
SOL is trading at $112.20, down 10.96% on the weekly chart. The price has been consolidating in a "Buying Zone" between the weekly support levels of $110.17 and $131.68. This zone has historically acted as a strong base, with the price bouncing from this area multiple times since late 2023.
🟢 Buying Zone and Support:
The current price is sitting in a critical "Buying Zone" between $110.17 and $131.68. This area has acted as a springboard for previous rallies, and if SOL holds above $110.17, it could be a good opportunity for accumulation. A break below $110.17, however, might lead to further downside toward the next support at $80.18 or even $54.00.
🎯 Target:
If SOL manages to break through the $195.71 resistance, the next major target is its previous ATH at $260. I’ve projected a potential move to $295.71, which would be a 95.71% increase from the current price of $112.20. This target aligns with the historical price structure and Fibonacci extensions.
⚠️ Risk Management:
Keep an eye on the $110.17 support. A weekly close below this level could signal bearish momentum, potentially driving the price toward lower supports. On the upside, watch for a strong breakout above $195.71 with high volume to confirm the bullish scenario.
What do you think about SOL’s setup? Are you bullish or bearish on Solana? Let’s discuss in the comments!
#SOLUSD #Solana #Crypto #TechnicalAnalysis #Breakout

SOL/USD "Solana vs U.S Dollar" Crypto Market Heist Plan🌟Hi! Hola! Ola! Bonjour! Hallo!🌟
Dear Money Makers & Robbers, 🤑 💰🐱👤🐱🏍
Based on 🔥Thief Trading style technical and fundamental analysis🔥, here is our master plan to heist the SOL/USD "Solana vs U.S Dollar" Crypto Market. Please adhere to the strategy I've outlined in the chart, which emphasizes short entry. Our aim is the high-risk Green Zone. Risky level, oversold market, consolidation, trend reversal, trap at the level where traders and bullish robbers are stronger. 🏆💸Book Profits Be wealthy and safe trade.💪🏆🎉
Entry 📈 : "The heist is on! Wait for the breakout (160.00) then make your move - Bearish profits await!"
however I advise placing Sell Stop Orders below the breakout MA or Place Sell limit orders within a 15 or 30 minute timeframe. Entry from the most recent or closest low or high level should be in retest.
Stop Loss 🛑:
Thief SL placed at the recent / nearest low level Using the 1D timeframe (200.00) swing trade basis.
SL is based on your risk of the trade, lot size and how many multiple orders you have to take.
Target 🎯:
1st Target - 125.00 (or) Escape Before the Target
Final Target - 90.00 (or) Escape Before the Target
🧲Scalpers, take note 👀 : only scalp on the Short side. If you have a lot of money, you can go straight away; if not, you can join swing traders and carry out the robbery plan. Use trailing SL to safeguard your money 💰.
📰🗞️Fundamental, Macro, COT, Sentimental Outlook:
SOL/USD "Solana vs U.S Dollar" Crypto Market is currently experiencing a bearish trend,., driven by several key factors.
⚡⭐Fundamental Analysis
Blockchain Trends: Solana's blockchain growth is expected to slow down, driven by increasing competition from other blockchain platforms.
Smart Contract Activity: Smart contract activity on Solana's blockchain is expected to decrease, driven by growing competition from other blockchain platforms.
Mining Difficulty: Solana's mining difficulty is expected to decrease, driven by decreasing network hash rate.
Transaction Volume: Solana's transaction volume is expected to decrease, driven by decreasing demand for cryptocurrency transactions.
⚡⭐COT Data
Non-Commercial Traders (Institutional):
Net Short Positions: 55%
Open Interest: 100,000 contracts
Commercial Traders (Companies):
Net Long Positions: 30%
Open Interest: 50,000 contracts
Non-Reportable Traders (Small Traders):
Net Short Positions: 15%
Open Interest: 20,000 contracts
COT Ratio: 0.6 (indicating a bearish trend)
⚡⭐Sentimental Outlook
Institutional Sentiment: 40% bullish, 60% bearish.
Retail Sentiment: 35% bullish, 65% bearish.
Market Mood: The overall market mood is bearish, with a sentiment score of -50.
⚡⭐On-Chain Analysis
Network Hash Rate: Solana's network hash rate has decreased by 10% over the past month, indicating a decline in mining activity.
Transaction Volume: Solana's transaction volume has decreased by 20% over the past month, indicating a decline in network activity.
Active Addresses: Solana's active addresses have decreased by 15% over the past month, indicating a decline in network adoption.
⚡⭐Market Data Analysis
Order Book Analysis: The SOL/USD order book is showing a significant imbalance, with more sell orders than buy orders, indicating a bearish market sentiment.
Liquidity Analysis: Solana's liquidity has decreased by 10% over the past month, indicating a decline in market participation.
Volatility Analysis: Solana's volatility has increased by 20% over the past month, indicating a more unpredictable market.
⚡⭐Positioning
Long Positions: 30% of total positions
Short Positions: 70% of total positions
Neutral Positions: 0% of total positions
Leverage: 2:1 (average)
⚡⭐Next Move Prediction
Bearish Move: Potential downside to 140.00-125.00.
Target: 125.00 (primary target), 90.00 (secondary target)
Next Swing Target: 80.00 (potential swing low)
Stop Loss: 190.00 (above the 30-day high)
Risk-Reward Ratio: 1:2 (potential profit of 30.00 vs potential loss of 15.00)
⚡⭐Overall Outlook
The overall outlook for SOL/USD is bearish, driven by a combination of fundamental, technical, and sentimental factors. The expected slowdown in Solana's blockchain growth, decreasing smart contract activity, and bearish market sentiment are all supporting the bearish trend. However, investors should remain cautious of potential upside risks, including changes in global economic trends and unexpected regulatory developments.
⚠️Trading Alert : News Releases and Position Management 📰 🗞️ 🚫🚏
As a reminder, news releases can have a significant impact on market prices and volatility. To minimize potential losses and protect your running positions,
we recommend the following:
Avoid taking new trades during news releases
Use trailing stop-loss orders to protect your running positions and lock in profits
📌Please note that this is a general analysis and not personalized investment advice. It's essential to consider your own risk tolerance and market analysis before making any investment decisions.
📌Keep in mind that these factors can change rapidly, and it's essential to stay up-to-date with market developments and adjust your analysis accordingly.
💖Supporting our robbery plan will enable us to effortlessly make and steal money 💰💵 Tell your friends, Colleagues and family to follow, like, and share. Boost the strength of our robbery team. Every day in this market make money with ease by using the Thief Trading Style.🏆💪🤝❤️🎉🚀
I'll see you soon with another heist plan, so stay tuned 🤑🐱👤🤗🤩

Solana SOL Will Bounce, But Then Scam!Hello, Skyrexians!
Couple of weeks ago we told you that BINANCE:SOLUSDT will reach $110 in the wave 5 inside the major wave A. You can find this analysis here . Exactly from this zone we have seen the bounce. This bounce is a major correction and those who listen this analysis could already be in the great profit. But anticipated bounce is not the bull run continuation and finally Solana will drop hard because its era is finished.
Let's take a look at the weekly time frame. Here we can see that 5 Elliott waves with the Awesome Oscillator's divergence. After that the major correction has been started. Wave A has been finished at $110 with the green dot at the Bullish/Bearish Reversal Bar Indicator and now we will see wave B, which will reach the Fibonacci 0.5 approximately at $200. From there we will see the scam drop in wave C. It will likely break the major Fibonacci 0.61 support. In this case game is over and Solana can fall for a years or even scam.
Best regards,
Skyrexio Team
___________________________________________________________
Please, boost this article and subscribe our page if you like analysis!

Solana SOL Weakness Continues: Is the Next Leg Lower Coming? 📉 Solana ⚡ is showing signs of weakness, maintaining a clear bearish trend on this 4H timeframe. Price action has traded into a key support zone, with a potential pullback offering an opportunity to enter short at a premium before the next leg lower 🔻.
If sellers remain in control, we could see a continuation to lower levels 📉.
⚠️ Not financial advice—always manage risk appropriately!

SOLUSD Megaphone bottomed. $205 min and $340 max Targets.Solana (SOLUSD) has been trading within a Megaphone pattern, which technically had the price bottomed on its Lower Lows 3 days ago. That bottom was also a 1D RSI oversold barrier (30.00) test, which is exactly where the December 22 2024 Low was priced.
Being below both the 1D MA200 (orange trend-line) and the 1D MA50 (blue trend-line), the natural short-term Target is again the 1D MA50 at $205.00, similar to the January 03 test.
On the longer term, if SOL makes a 1W candle closing above the 1D MA50, we can resume buying and target the top (Higher Highs trend-line) of the Megaphone at $340, which is where the 1.236 Fibonacci extension is, exactly where the January 19 High was priced.
-------------------------------------------------------------------------------
** Please LIKE 👍, FOLLOW ✅, SHARE 🙌 and COMMENT ✍ if you enjoy this idea! Also share your ideas and charts in the comments section below! This is best way to keep it relevant, support us, keep the content here free and allow the idea to reach as many people as possible. **
-------------------------------------------------------------------------------
💸💸💸💸💸💸
👇 👇 👇 👇 👇 👇

SOL/USD LONG SET UPTitle: BUY SOL/USD LONG
Order Type: MARKET BUY
Time Frame: 1D
entry 1- 200.50
entry 2- 180.50
stop loss 160.50
take profit 1 $220.50
take profit 2- $240.50
take profit 3- $260.50
take profit 4- $280.50

Solana Buy Setup - Possible Next Big Move Towards $213!CRYPTOCAP:SOL is heading towards a key support zone, a level that has before seen strong buying interest. If this happens I can see this scenario play— price dips a bit below support, shaking out weak hands before reversing higher. It’s the classic liquidity grab, a move that could start the next leg up.
If this happens, we could see SOLANA take support with strength, signaling that buyers are stepping in aggressively. From there, momentum could build towards $213.
But there’s always the other side of the trade. If buyers fail here and SOL struggles, the direction could shift. What looks like a simple liquidity grab could turn into a breakdown, and be aiming for a deeper correction.
It all comes down to confirmation. Does price reclaim support with strength, or does it get stuck below resistance? That will be the key to watch.
Just my take on support and resistance zones—not financial advice. Always confirm your setups and trade with solid risk management!
Please boost this post, every like and comment drives me to bring you more analyses! I’d love to hear your perspective in the comments below.

SOLUSD Triple bottom initiates new rally to $380.Solana (SOLUSD) has been trading within a Channel Up pattern since the July 29 2024 High. The recent February 03 2025 Low isn't just a Higher Low on the Channel Up but also a Triple Bottom on the Support Zone and a Double Bottom on the 1D MA200 (orange trend-line).
Needless to say, this shows that technically this is a level of high demand, thus long-term Support and within the next 30 days maximum, it should initiate the new Bullish Leg of the pattern, similar to the September 06 2024 Low. Even the 1D RSI sequences between those fractals are identical.
Since the previous Bullish Leg rose be +119.43%, we see no reason to do otherwise now, hence our new long-term Target is set a $380.00.
-------------------------------------------------------------------------------
** Please LIKE 👍, FOLLOW ✅, SHARE 🙌 and COMMENT ✍ if you enjoy this idea! Also share your ideas and charts in the comments section below! This is best way to keep it relevant, support us, keep the content here free and allow the idea to reach as many people as possible. **
-------------------------------------------------------------------------------
💸💸💸💸💸💸
👇 👇 👇 👇 👇 👇

Next motive wave on SolanaHi fellow traders, SOLUSDT is getting ready to make a move higher after it completes the correction. Target the 313.6902 level. Good luck and trade safe!

We're off to a great start SOLANAWe're off to a great start SOLANA
🚀 Trade with the professionals of THS - Wave Theory!
🔹 All trades are based on wave analysis.
🔹 Fixed stop loss and take profit for risk management.
🔹 100% automation: copy trades through CopyFX service.
🔹 Reliability and transparency: the results are confirmed by the market.
📈 Don't miss the chance to earn steadily!
👉 Connect to CopyFX with THS and start copying profitable trades right now!
💡 Details on our channel and in the app!
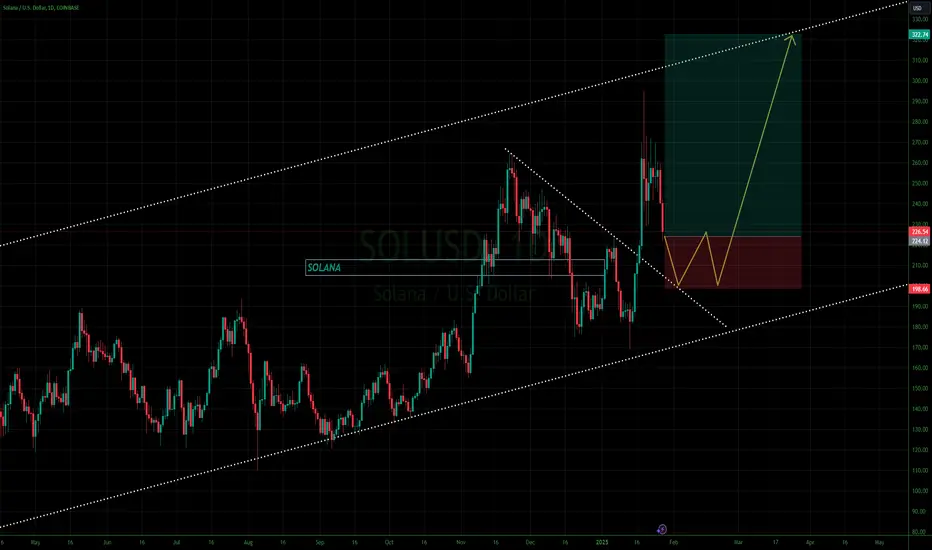
Solana's All-Time High: Symmetrical Triangle Pattern in Play..!Solana is currently exhibiting a symmetrical triangle pattern as it approaches its all-time high of $260. This pattern typically indicates a period of consolidation, where the buying and selling pressures are in relative equilibrium. Traders and analysts are closely monitoring this development, as a breakout from this formation could lead to a significant price movement, either upwards or downwards. The potential direction of the move will depend on which side the price ultimately breaks out from. Therefore, investors must stay vigilant and watch the market closely for any signs of a breakout, as it could herald a pivotal change in momentum for Solana.
