SOLUSDT, Capture H&S SOLANA!!!!So our team expect this method for Solana !!!!
Always use SL in your trading and proper risk management, this is very important to become a professional trader.
Have a great profit :)))
Solanausd

SOLUSD might drop to 79.8700SOLUSD on the monthly chart has been confirmed with the Wyckoff Schematic. After retesting the 241.2325, the price dropped to 149.3500 to clear the liquidity on the previous lows. After retesting the unmitigated supply zone (196.2150) it dropped and is now on its way to the previous unmitigated demand zones and to fulfill the imbalances on its way. all the imbalance zones on the chart were found using the monthly chart

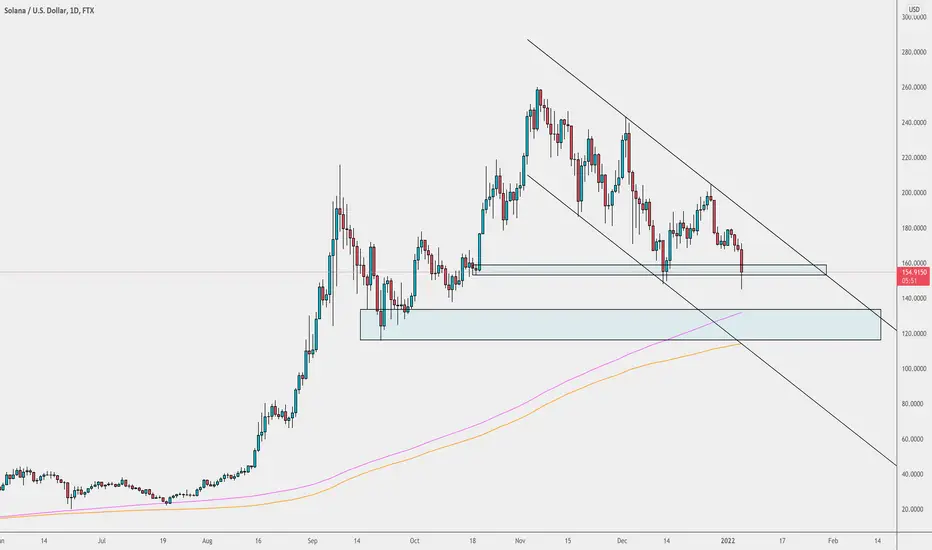
Solana down to $120 as i described earlierAs discussed earlier, the price is moving down and now sitting on our first support zone. As this zone was previously hit, it is more likely for it to break so I would be very cautious about buys from where we currently are. Looking at moving into the 200MA and 320 EMA along with the demand zone.
For those who missed the opportunity in Solana For those who missed the opportunity in Solana. Waiting for the golden area at ( 115$ / 140$ )
Good Luck.

Solana down into the $120 mark?From what we can see Sol has been trending bearish within a channel. The higher marked zone as acted as a very strong support once, however if we come back to it for a second time, it may not be as strong and be more likely to break. The lower zone we have marked which lines up with that $120 region, also has the 200MA and 320 EMA, which if we look back, have always acted as strong supports with the trending price. That can be a strong demand area for buyers.

Solana beginning of the year predictionSolana has a Sell signal for the beginning of 2022.
I look for a return to $130 area by the end of January!
Happy New Year!

Solana Breakout Before January 13thTop Chart - SOL /BTC Heikin Ashi candlestick
Bottom Chart - SOL/USDT Japanese candstick
Pretty clear breakout for solana coming very soon sometime before Mid January 2022. Using the SOL/BTC chart with Gann Fanns on Heikin Ashi we can see a clear squeeze coming in. Infact using this SOL/BTC chart with the Gann Fans would have resulted in some great short trades.
Even tho three rejections of the 8/1 Gann Fann is very bearish we have to remember that is a Dominance chart and not a price chart.
Straightforward trade here on solana high reward and low risk.
Long 173
Stop Loss 167
Take Profit starting from 330 upwards
May cycle top prediction for solana 1000 dollars
Anyone know if there an exchange that offers inverse sol contract on margin? :P

Solana first yearInfos about a start of a very successful Coin.
Hodl was a richmaker here.
I am trying to find the next Solana so I compare its start with other new coins.


SOLANA CORRECTION INCOMING?Solana looks to be heading towards the monthly open level at 208 which is a golden pocket retracement from the previous swing high on the daily.
Green horizontal lines : Monthly levels
Blue Horizontal lines: Weekly levels
twitter: @divitastrading

Solana Rising Wedge Breakout, Dec 26Solana pattern broke from bottom after it reached ATH target (4.236 Fib)
This is how I imagine Solana path
This scenario is valid till price is under the red trend line. Even it's possible that sol reach near ATH again and then go down
Anyway, I expect the wave 5th of Solana

SOLANA BEAR MARKET???Believe the chart is very much self-explanatory.
Third Wave Extension.
Expect a retracement back to $60 levels.
Sidenote: I know everyone is bullish on solana and the hype is there, but consider this and be cautious.

Solana looks sketchy but might be a trapSolana looks sketchy but might be a trap. Just posting to archive thoughts.

SOL for $500-900🌬Now, depending on how actively the project is being developed and used. I make a bold assumption that we will see Solana for $ 500-900! If the alt season still happens, then it won't be long to wait
🌫But if, however, we decide to go into a long consolidation, then in the next cycle it is even more likely, only if even stronger projects do not appear
🧐Why? Why $ 500?
When predicting the previous growth of SOL, I use Elliott and Fibonacci waves, as well as various figures. Also now.
🚨I believe we are completing a big five-wave move with an ABC or ABCDE retracement. And we fall to the values of $ 140-165 for the testament of the correction. Then we accumulate in the $ 140-170 zone and the beginning of a new wave in the 500-900 zone
Buy area: $ 140-170 🟢
Goal1 $ 300 (+150) 🎯
Goal2: $ 500 (+ 230%) 🎯
Goal3: $ 800 (+ 423%) 🎯
Stop Loss: $ 79⭕️

solusd solana solusd solana sol solanasolusd solana sol solanasolusd solana sol solanasolusd solana sol solana

SOL downward trend (next promotion)Solana is a project of the highest quality and every adjustment should make you happy, because it will not suddenly disappear, it is becoming more and more noticeable to the largest funds, take advantage of this time of Christmas promotions

SOLANA ROADMAP FOR THE NEXT 3-4 MONTHSEmissary over here.
Hello again everyone.
Today we take a look at SOL.
As you can see on the chart, offer and demand zones are noted by purple horizontal lines. Macrotrend support zones are noted by light-blue trend lines. We are aproaching one in the short term.
Entry zone is noted by the green box and exit zone, for me at least, is noted by the red box.
The roadmap, based on price action, is as follows.
I think from the current price well reach the 214 area. Then price will be pushed back again to 177, where I have a buy order placed at the moment. From there price will breakout local downtrend to the 239 lvl. Price then will come back to 214 or to our macro light-blue trend line at around 188. From there I think well have a clear path to reach ath once again. From there im out for the moment.
Thank you for reading the message.
If you like my work give it a thumbs up and leave a follow for more everyday analysis. Remember the message never sleeps.
Also remember this is no financial advise, DYOR and trade at your own pace and risk.

SOLANA in a Descending Broadening WedgeSolana is on the hour in a Falling wedge in which the bulls are now pressing against the resistance line. However, a slight negative divergence has been spotted on the hour
whether that will really have an effect on the bulls remains to be seen, This could give the price another swing downward.
For the time being, if the price were to break out upwards, I expect the bulls to point their horns at $211, there will be some resistance around the psychological $200
once the $211 resistance is broken (incl re-test) there is a good chance we could also break the resistance of the bigger picture pattern, the Descending Broadening Wedge. Because if we look at the Daily Chart, we see the bulls and bears created an Descending Broadening Wedge. I drew a diagonal white “support” line where secretly the hope lies that if the bears bring the price more down a bit the bulls could support at that level. In the event of a breakout on the upside, there could be an opportunity for the bulls to seek out a new All Time High.
I also like to share the link to Solana where the Consensus mechanism of Solana is explained. Because instead of a Proof-of-Work or Proof-of-Stake, this is a Proof-of-History at Solana and that is of course quite interesting and is explained in a fairly accessible way.
solana.com
1H
Keep calm, do your own research! trade safe and manage your risk.
*(Disclaimer: this is not financial advice)*

SOLANA 1H Falling wedgeSolana is on the hour in a Falling wedge in which the bulls are now pressing against the resistance line. However, a slight negative divergence has been spotted on the hour
whether that will really have an effect on the bulls remains to be seen, This could give the price another swing downward.
For the time being, if the price were to break out upwards, I expect the bulls to point their horns at $211, there will be some resistance around the psychological $200
once the $211 resistance is broken (incl re-test) there is a good chance we could also break the resistance of the bigger picture pattern, the Descending Broadening Wedge. Because if we look at the Daily Chart, we see the bulls and bears created an Descending Broadening Wedge. I drew a diagonal white “support” line where secretly the hope lies that if the bears bring the price more down a bit the bulls could support at that level. In the event of a breakout on the upside, there could be an opportunity for the bulls to seek out a new All Time High.
I also like to share the link to Solana where the Consensus mechanism of Solana is explained. Because instead of a Proof-of-Work or Proof-of-Stake, this is a Proof-of-History at Solana and that is of course quite interesting and is explained in a fairly accessible way.
solana.com
1D
Keep calm, do your own research! trade safe and manage your risk.
*(Disclaimer: this is not financial advice)*

BULLISH ON SOLANA Sol is currently testing the $200 level, if it holds as support price should further increase zone to zone. Here's my thoughts. Feel free to comment any ideas !

Solana Entry Signal! Solana is short term bearish, I am looking to buy at these price ranges that are marked, and I Strongly believe this will go even higher before January or even December.
Solana has a big future with easy and fast transactions, I believe it will ride along side ETH. Hang tight!

SOL CORRECTION Sol outperformed the whole market and I think its gonna go to a little correction to around 200$.
MY IDEA ONLY NOT A FINANCIAL ADCVICE!

Solana - Small Pullback then UP!Updated Idea for Solana
It can be seen that price even though bullish, moves downward out of the channel (chart on the left) and then recovers back into the channel, what I am proposing is that this occurs again (placed green oval)
On the right chart, I have plotted similar points on the 'MavilimW' indicator that support this dip hypothesis
I do think SOLANA has big potential
