SOLANA could have a major retracement Solana completed a major ABC correction into a supply zone on the higher time frame (HTF), taking out the previous quarter’s highs.
On the daily chart, the RSI is overbought and signals the potential for a significant retracement.
Price action on the 4-hour chart shows a series of lower highs, indicating a bearish trend. If Solana fails to break above the previous high and trigger a market structure shift, the downtrend is likely to continue, leading to a deeper retracement on the higher time frames.
Solanausdt

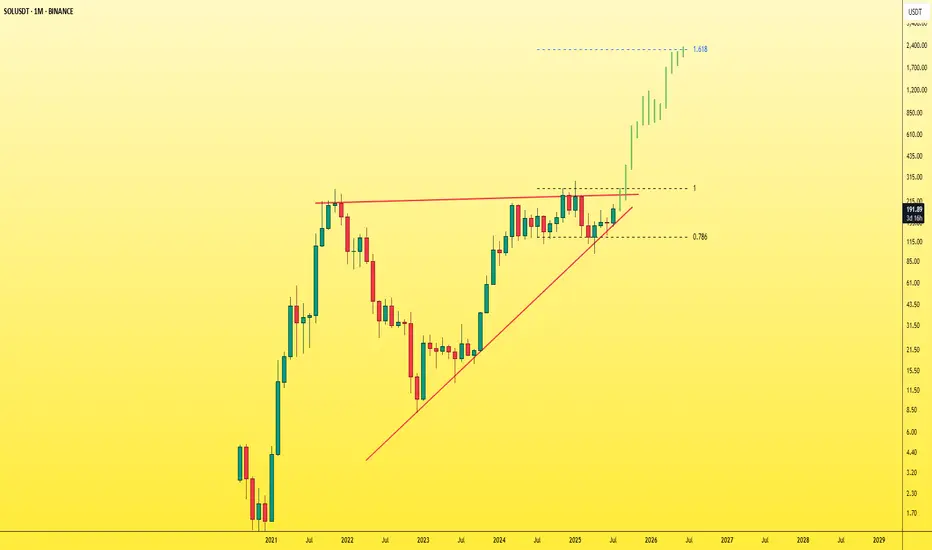
SOL - Don't miss the breakout before it's too late!The symmetrical triangle pattern on the monthly timeframe is showing signs of weakening after multiple failed breakout attempts — and now, a breakout seems highly likely.
Once SOL breaks out of this triangle, it will enter price discovery mode , opening the door to a massive bullish move. At that point, most traders will start saying “it’s too late”, while SOL keeps rallying aggressively — fueled by FOMO and liquidity traps.
You'll see:
- People outside the market waiting for a pullback that never comes.
- Traders inside the move getting shaken out by small dips and volatility.
Right now, SOL is still in a fair trading zone and available at a reasonable price .
Don’t wait for it to explode and then chase. Get in before the breakout .
Best Regards:
Ceciliones🎯
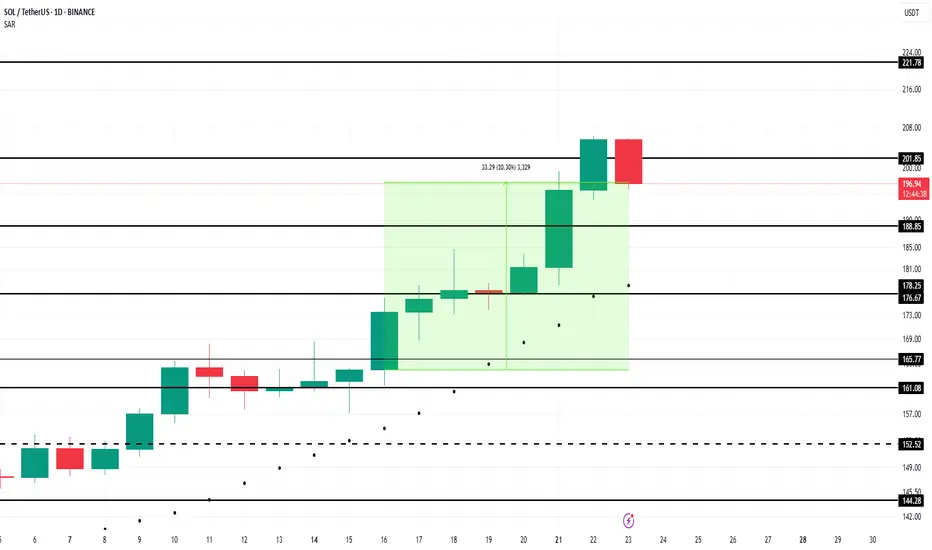
Solana Price Faces Reversal At $200 As Profits Hit 5-Month HighBINANCE:SOLUSDT price has risen 21% in the past week , now trading at $199. Despite breaching the $200 mark, Solana has failed to maintain this level, marking a five-month high.
The Net Unrealized Profit/Loss (NUPL) indicator for BINANCE:SOLUSDT shows that profits have reached a five-month high . This signals that many investors are in profit, raising concerns about a potential sell-off.
If these factors hold true, BINANCE:SOLUSDT price could decline toward the support levels of $188 or even drop to $176 . A move below these levels could erase a significant portion of the recent gains and shift the altcoin into a bearish trend.
However, if investor confidence remains strong and the market continues to show bullish signs, BINANCE:SOLUSDT could stabilize above $200 . Securing this level as support could propel the price back toward $221, invalidating the bearish outlook.
SOLUSDT on Fire! Bullish Wedge Fuels INSANE Upside Potential!BINANCE:SOLUSDT has been exhibiting strong bullish momentum, currently trading within a broadening wedge pattern. This technical structure often signals increased volatility and the potential for decisive moves in either direction. In the present scenario, the breakout above the psychological $200 resistance level suggests that bulls are firmly in control, fueling hopes of further upside.
The continuation of momentum hints at the market preparing for another leg up. The immediate price target lies at $300, where traders may expect some profit-taking and resistance. However, should momentum sustain and buying pressure persist, BINANCE:SOLUSDT has the potential to surge toward the $700 region, aligning with the pattern’s projected price expansion.
As always, managing risk is key. Use a well-placed stop loss below the support level to protect your capital. Breakouts can be explosive, but discipline and proper risk management make all the difference.
BINANCE:SOLUSDT Currently trading at $201
Buy level : Above $200
Stop loss : Below $150
Target 1: $250
Target 2: $300
Target 3: $500
Target 4: $700
Max leverage 2x
Always keep stop loss
Follow Our Tradingview Account for More Technical Analysis Updates, | Like, Share and Comment Your thoughts

SOLANA - BULLISH & BAERISH
Hello everyone,
here is my current outlook on Solana (SOL):
Personally, I am currently only watching Solana as we may already be in a correction phase. Nevertheless, there is an interesting scenario where we could still be in a green wave 5, which could potentially reach prices above USD 300.
Possible course:
In April 2025, the bottom may have been found following an ABC formation.
Wave 1 (yellow) could be completed in May 2025.
Wave 2 (yellow) could end in June 2025.
We could currently be in wave 3 (yellow).
Important point to watch:
If the price does not make it sustainably above the yellow wave 1 (approx. USD 190), the probability increases strongly that we are still in a B wave.
This would mean that we are still in a major correction, which could theoretically take us back to around USD 60. In this scenario, wave 1 would have already ended in January 2025 and we would still be in the correction of wave 2.
Conclusion:
The indicators are particularly important in this phase. Keep a close eye on them to better understand the structure.
"SOL/USD BULLISH HEIST! Steal Profits Like a Pro"🏆 "SOLANA HEIST ALERT! 🚨 Bullish Loot Ahead – Thief Trading Style (SOL/USD)" 🏆
💸 Steal Profits Like a Pro – Day/Swing Trade Plan 💸
🌟 Greetings, Market Pirates & Profit Raiders! 🌟
Hola! Bonjour! Hallo! Marhaba! 🤑 Dear Thieves & Trend Snipers, the SOL/USD vault is WIDE OPEN! Time to execute the heist with precision.
🔥 THIEF TRADING MASTER PLAN 🔥
🎯 Mission: LONG SOLANA (Escape Near Blue ATR Line)
⚠️ Danger Zone: Overbought | Consolidation | Bear Trap Ahead
🏆 Rule: "Take Profit & Treat Yourself – You’ve Earned It!" 💪💰
📈 ENTRY STRATEGY (The Heist Begins!)
"SWIPE THE BULLISH LOOT!" – Enter at any price, but smart thieves use:
Buy Limit Orders (15-30min timeframe)
Swing Low/High Pullbacks for optimal entry
DCA/Layering Strategy (Multiple limit orders for max loot)
🛑 STOP-LOSS (Escape Plan)
📍 Thief SL: Below nearest low (Daily MA @ $160.00)
⚠️ Adjust SL based on: Risk tolerance, lot size, & DCA layers.
Pro Tip: Tighten SL if market flips bearish!
🎯 TARGETS (Profit Escape Routes)
🎯 Main Take-Profit: $220.00 (or exit earlier if momentum fades)
🧲 Scalpers: Only LONG! Use trailing SL to lock gains.
💰 Big Bank Thieves: Go all-in. Smaller Raiders: Join swing traders.
📰 WHY SOLANA? (Fundamental Boosters)
Bullish Momentum (Tech + Sentiment Driving Price)
Macro Trends, On-Chain Signals 👉 Check Liinkss 🔗
Intermarket Analysis: Crypto & equities syncing for gains!
⚠️ TRADING ALERTS (News & Risk Control)
🚨 News = VOLATILITY! Avoid new trades during major releases.
🔒 Protect Running Trades: Use trailing stops to secure profits.
💥 SUPPORT THE HEIST! (Boost & Win Together) 💥
🔥 Hit the "LIKE" & "BOOST" button to strengthen our Thief Trading Squad!
🚀 More Heist Plans Coming Soon – Stay Tuned! 🤑🎉
📌 Reminder: This is NOT financial advice – DYOR & manage risk!

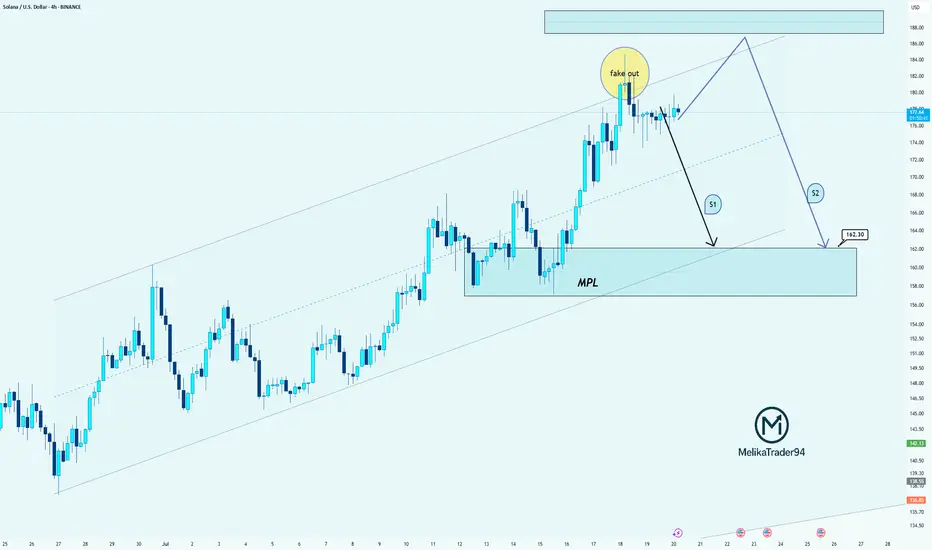
SOL: Clean Fakeout & Two Bearish Scenarios AheadHello guys!
Price just created a textbook fakeout above the resistance zone, grabbing liquidity and quickly dropping back into the range!
Here’s what the chart is showing:
Price is still inside the ascending channel, but the breakout attempt failed
The MPL (maximum pain level) around $162.30 is the key downside target
Two possible paths:
S1: Direct drop from here toward the MPL
S2: Another move up to retest the highs or form a lower high before the deeper drop
I think the S2 is more probable!
Solana - The Cup is Almost FullSolana is printing a textbook cup & handle formation on the daily, and price is now pressing against the neckline resistance near $185, just below the psychological $200 zone.
This structure reflects months of accumulation and rising momentum. A confirmed breakout above the $185–$199 resistance would likely trigger the next upward leg.
This setup signals trend reversal continuation, and if SOL closes above $199 on high volume, momentum traders may pile in quickly.
📌 Invalidation below $150 = pattern risk-off.

"Solana Heist in Progress! Will the Breakout Hold or Fake Out?"🔥🚨 "SOLANA HEIST ALERT: The Ultimate Bullish Raid Plan (Breakout or Fakeout?)" 🚨🔥
🌍👋 Greetings, Market Pirates & Profit Bandits!
(English, Spanish, Portuguese, French, German, Arabic—we speak MONEY.)
💎 STRATEGY BASED ON THIEF TRADING STYLE 💎
(High-risk, high-reward—steal the trend or get caught in consolidation!)
🎯 MISSION: SOL/USD (Solana vs. Dollar) CRYPTO HEIST
🐂 Direction: LONG (But watch for traps—cops & bears lurk nearby!)
🚀 Escape Zone: ATR line (High-Risk Profit-Taking Area)
⚠️ Warning: Overbought? Reversal? Police line at resistance? TAKE PROFITS EARLY!
📈 ENTRY: "THE BREAKOUT HEIST BEGINS!"
Trigger: Wait for candle close ABOVE 148.50 (MA)
Alternative Entry: Buy stop above MA OR buy limit on pullback (15m-30m TF)
🛎️ SET AN ALERT! Don’t miss the breakout—thieves strike fast.
🛑 STOP LOSS: "DON’T GET CAUGHT!"
Thief SL: 136.00 (2H Previous structure Swing Low) (Adjust based on your risk & lot size!)
⚠️ Warning: If you ignore this, you’re gambling—your loss, not mine.
🎯 TARGET: "LOOT & BOUNCE!"
🎯 167.00 (or escape earlier if the trend weakens!)
🧨 Scalpers: Only play LONG—use trailing stops to lock in gains!
📢 NEWS & RISK WARNING
🚨 Avoid new trades during high-impact news! (Volatility kills heists.
🔒 Use trailing stops to protect profits if the market turns.
💥 BOOST THIS HEIST! (More boosts = more profit raids!)
👉 Like ✅ | Follow 🚀 | Share 🔄
💬 Comment your take—bullish or bearish trap?
🚀 Next heist coming soon… Stay tuned, bandits! 🤑

SOLANA Loves THIS Pattern | BULLISHSolana usually increases alongside ETH. Possible because its a big competitor.
We can see SOL follows ETH very closely, with the exception of dipping earlier than ETH by a week:
In the 4h, we see a push to breakout above the neckline resistance:
In the daily timeframe, SOL is just about to break out above the moving averages - which would be the final confirmation of a bullish impulse to come:
Could this pattern be the confirmation of the start of another big pump for SOL?
_______________________
BINANCE:SOLUSDT

#SOL Update #3 – July 8, 2025🟠 #SOL Update #3 – July 8, 2025
Solana, much like Litecoin, is still undergoing corrections following its latest impulsive move. While it currently holds above a strong support level, two significant resistance zones are ahead.
The market is undecided, and Solana's direction remains uncertain, making it one of the riskiest assets to trade today.
If the $145 support fails, the price may drop toward $137. Conversely, a daily close above $159 could trigger a move toward $167. For now, it's best to stay on the sidelines and monitor the price action closely.

Solana's fate: pump or dump ?Hello friends
You see that Solana, after its good growth, got stuck in a range and is gathering strength. Now, considering the strong upward trend of this currency, it can be said that this force can push the price upwards, but everything is possible in the market, so observe capital management and trade with your will and wisdom.
*Trade safely with us*

SOL – Compression at Resistance IISolana remains locked in a corrective sequence, unwinding from the mid-June $164 high. Price has now respected a clearly defined descending trendline, recently validating it with a third consecutive rejection—establishing it as dominant short-term resistance. Compression is now occurring just above a well-tested 2H order block near 144–139, where bulls must respond or risk cascading into inefficiency zones.
Structural and Momentum Breakdown:
Descending Resistance Structure: Three clean rejection wicks off the same trendline establish this as firm structural resistance. The latest failed bounce confirms this diagonal as active seller control.
Fib Cluster Rejection: Price has struggled below the 50–61.8% retracement (152–155 zone) from the June high, marking that cluster as distribution resistance.
Volume Profile (VRVP): Sitting atop a low-volume pocket between 144.88 and 139.71; below that lies high-acceptance around 132.
Volumized OB Zones: 2H OB between 144–139 overlaps with key support shelf—any breakdown from here opens path to 132–129 range sweep.
RSI: Persistently sub-40 with no bullish divergence—momentum continues to degrade.
PVT: Flat-to-declining, showing no inflow response to support retests—suggests buyers are stepping back even at local lows.
Example Trade Strategy:
Bullish Reclaim Setup:
Entry: Only with breakout and 2H close above 152–153 (above OB and breaking descending resistance).
SL: Below 144.50 (reclaim invalidation).
TP1: 158–160 (Fib 78.6%)
TP2: 164 (100% retrace)
Confirmation Criteria: RSI >50 + breakout volume + PVT uptick.
Bearish Continuation Setup (If OB breaks):
Entry: 2H close under 144.88, confirming OB loss and trend continuation.
SL: Above 148.
TP1: 140
TP2: 138
TP3: 132–129 (macro demand + HVN)
Confirmation Criteria: Momentum stays sub-40 RSI, increased sell volume, and continued PVT drop.

Solana Price Poised to Explode — But Only If This Level BreaksThe chart shows Solana trading around $153.85 USDT after a corrective rally from the June lows. Overall market structure has shifted in recent sessions, highlighted by a clear Break of Structure (BOS) on June 29, which signaled the first real attempt to reclaim higher ground after persistent weakness. However, the price has now approached a cluster of supply zones, which could either trigger a further rally if absorbed or mark a fresh rejection.
Above the current level, you can see strong red zones between 160–180 USDT, representing prior swing high supply and institutional sell interest. These are areas where large sellers previously stepped in to push price lower, so if Solana fails to break above this region with convincing volume, sellers may become more active again. In contrast, the nearest major demand zone sits around 137–140 USDT, highlighted in blue. This zone has acted as a key support and liquidity pocket where price has rebounded multiple times.
The Smart Money Concepts on the chart, including frequent CHoCH (Change of Character) and EQ/CHoCH labels, indicate that liquidity sweeps and engineered reversals have been common. This suggests the market may be preparing to hunt stops above recent highs or below recent lows before committing to a longer-term move.
At this point, the trend bias is cautiously neutral to bullish in the short term because the BOS suggests an attempt to reclaim higher levels. However, this bullish bias remains unconfirmed until Solana cleanly breaks and holds above 160–170 USDT. If sellers defend that area, the market could revert to the 137–140 zone.
Below is a clear trade scenario based on what the chart is showing:
Potential Trade Setup (Not Financial Advice)
Scenario: Short from Supply Resistance
o Entry: 153.85–154.35 USDT (currently being tested)
o Stop Loss: Above 160 USDT (invalidates bearish rejection)
o Take Profit Target: 137–140 USDT demand zone
Alternatively, if Solana rejects and returns to retest demand, this would offer a possible buy scenario for traders looking to play the rebound:
Scenario: Long from Demand
o Entry: 137–140 USDT demand zone
o Stop Loss: Below 135 USDT (confirms demand failure)
o Take Profit Target 1: 153.85 USDT resistance retest
o Take Profit Target 2: 170 USDT upper supply
At the moment, the price is balanced between these zones, so a wait-and-see approach can help confirm whether supply breaks or holds. A clean break above 160 USDT with strong momentum could invalidate the short idea and favor continuation higher toward the upper supply region around 170–180 USDT.
In summary, the chart structure is showing early signs of potential accumulation but still faces significant overhead resistance. Careful confirmation around the 154–160 level is critical before committing to either direction. If you’d like, I can help you refine these plans further or overlay additional indicators like volume or moving averages for extra confirmation.

SOL/USDT - Visible double top formationAfter hitting the projected reversal zone near 144–145, SOL/USDT has now formed a clean double top, reinforcing the bearish thesis initially outlined by the harmonic pattern. The second peak failed to break the macro descending trendline, and the price is now trading back below the 100% Fibonacci retracement of the XA leg.
This double top adds structural confirmation to the harmonic C-point rejection:
Volume remained lower on the second peak
RSI on the 30m chart printed a lower high while price matched previous highs — a textbook bearish divergence
PVT continues to flatten despite price volatility, suggesting a lack of bullish conviction
Price is now slipping below 143, and bearish momentum is building.

SOL/USDT – Bearish Harmonic Completion Near 144–145The 2H chart shows an extended X‑A‑B‑C‑D harmonic structure (an extended Bat/ABCD). Leg XA was the initial down-leg (from the recent swing high down to A), AB was a corrective pullback, and BC retraces sharply into the 88.6–100% zone of XA (around $144–$145). In a classic Bat/ABCD, the CD leg often completes near an 88.6% retracement of XA, so this C zone is a potential reversal point (PRZ). Importantly, C also sits on the chart’s long-term red descending trendline – a confluence of fib and trendline. A break below this level would “validate the bearish harmonic pattern,” with the downtrend line amplifying selling pressure. The projected D-point is ~$122.63 (late June/early July), which coincides with the lower green channel support on the chart.
Harmonic pattern (2H SOL/USDT): XA and AB moves set up a deep BC up into the 88.6–100% fib zone (around $144–145) at C. This confluence of fib levels and the macro descending trendline makes C a strong Potential Reversal Zone (PRZ). The CD leg targets ~122.63, aligning with lower channel support (green). Across timeframes the momentum is waning into point C. RSI is rolling over – price made a lower high while RSI failed to confirm (a classic bearish divergence). Meanwhile, the PVT (Price Volume Trend) line has flattened even as price crept higher, indicating the rally is not supported by volume.
Volume patterns also signal distribution: rallies into C have occurred on declining volume, a textbook sign that buying interest is drying up. Wyckoff distribution theory notes that as a top forms, “rallies during this stage often show lower volume” and ensuing drops on higher volume. In short, weakening RSI, a flat PVT, and thinning volume all confirm the selling pressure around $144–$145, consistent with a bearish reversal at C. Momentum and volume (15m SOL/USDT): RSI has peaked lower while price nears $145, and PVT has flattened (highlighted). Rallies into C come on lower volume, matching Wyckoff distribution cues. These divergences suggest the upward move into C is exhausted.
Trade Plan & Risk Management
Entry: Short initiated at $145.00 (near the PRZ around C).
Stop Loss: $146.20 (just above the red trendline and invalidation of point C).
Take Profit Targets:
TP1 : $129.00 (minor fib support, ~61.8% retrace of the last swing).
TP2: $122.63 (harmonic D projection and channel support).
TP3: $120.00 (extension to lower channel boundary).
Confirmation: Watch for a break of the short-term support at ~$139.50 for added conviction before letting profits run.
Note: A short position was opened at $145. This outline is for informational purposes – it is not financial advice. Trade with proper risk management.
Each target corresponds to technical levels (fib retracements and channel support). The first target aligns with a ~61.8% retracement (common fib TP level), and the final targets sit on the longer-term channel floor. If price breaks under $139.50, it would further confirm the bearish thesis.

Bearish Breakdown Alert: SOL Eyes $136.46 — Is $126.25 Next?The current SOLUSDT 4-hour chart reflects a strong bearish trend structure, supported by the price consistently respecting a descending channel. This channel has been intact for several weeks, and recent price action shows Solana approaching the upper boundary of this channel once again. Historically, this has acted as a sell zone, and unless there is a confirmed breakout, it remains a high-probability short setup.
Adding to the bearish sentiment is the Ichimoku Cloud. Price is currently trading beneath the cloud, and the cloud itself is shaded red and expanding, signaling ongoing bearish pressure. The Tenkan-sen (conversion line) has just crossed slightly above the price, but the Kijun-sen (base line) sits just above current levels, offering resistance. Most importantly, the Chikou Span (lagging line) is still below both the price and the cloud, which reinforces the idea that momentum remains on the downside.
Within this structure, a clean trade setup emerges:
• Entry: Around $143.87 (Kijun-sen + upper channel area)
• Stop Loss: $152.84 (above the cloud + upper trendline)
• Take Profit 1: $136.46 (mid-channel + local support)
• Take Profit 2: $126.25 (channel bottom)
Given the overall confluence of the bearish channel and Ichimoku resistance, any rejection from the $143–$144 area would support continuation toward the lower bounds of the trend. As always, watch for a strong bearish candle or wick rejection before entering to improve timing.

Daily EMA 55 needs to move above EMA 200!!
My general bias for Solana is bullish. However, the current setup is very similar to the setup in Feb-Apr 2022 before Solana started a macro bear trend. (see blue rectangular box)
I am still waiting for a long trade opportunity. I am not looking for a short trade. I just need to sit tight and see how the price is going to unfold in the next few months in the daily chart.
The 2022 setup (see blue rectangular box in the chart):
1) EMA55 crossed below EMA 200 on 16th Feb 2022. (red vertical line in the chart)
2)The price found the temporary floor around $80 and sharply moved above both EMA55 and
200. (see light blue rectangular box)
3) It was the dead cat bounce. It was the beginning of the macro down trend.
4)The price spent months and months under $40 in 22 and 23, however, the price eventually
broke above both EMA 55 and 200 and when EMA55 crossed above EMA 200 in Oct
2023 (red vertical line in the chart), the macro bull trend started.
The current setup (see orange rectangular box in the chart):
1) EMA 55 crossed below EMA 200 on the 4th March 2025.
2) The price moved down to $95 area and sharply moved above both EMA 55 and EMA200. However, it failed to stay above them.
3) The price has been oscillating between $140 and $18. The price is still below EMA55 and EMA200. (see orange rectangular block)
In order to start a strong bull trend,
1) the price needs to close and stay above EMA 55 and EMA200.
2) EMA 55 needs to cross and stay above EMA 200. EMA55>EMA200
3) MACD and RSI need to enter the bull zone.
EMA55 and EMA200 do not cross easily (I mean decisively cross). It only happened three times since 2022, however, when they cross, the price moves very aggressively in one direction.
I think Solana is bullish fundamentally. I am not suggesting it is going to start the macro bear cycle. I am pointing out the price is still not showing a clear direction. From a technical analysis point of view, it might take some time before the trend forms. For now, it is only testing my patience!

Red Lights for SOLANASolana has recently completed its 5-wave impulsive rise, and now a correction phase appears to be underway. Notably, a diamond top formation has formed and already broken to the downside, further supporting the short-term bearish outlook.
As long as SOL trades below the $180 resistance, this corrective scenario remains valid.
I currently do not expect a drop below the $146 support zone, making this a structured micro pullback within a larger bullish macro trend.
This setup offers opportunities for both short-term short and long entries, depending on how the price reacts near key levels. While the macro structure and fundamentals remain highly bullish for Solana, this correction could provide an ideal re-entry point before the next major leg up.
— Thanks for reading.

Solana >>> all trendlines are brokenHello guys!
As you can see, all of the trendline is broken, and after forming a double top in Solana, we can see a bearish trend is running!
I believe this downward movement will continue until the price touches the mentioned area!
The pointed area is the target level!
And the blue area has its own potential for getting long!

Price respected the level. The rest is execution.BINANCE:SOLUSDT just tapped the 1H OB near 155.75 — a zone defined by structure, not emotion. If you’ve been following the narrative, this isn’t a dip. It’s reaccumulation before displacement.
Here’s the setup:
Price tagged the OB at 155.75, perfectly aligning with the 0.618 fib — the algorithm’s comfort zone
Below this lies 153.95 — the invalidation level for the long idea
First upside target sits at 158.27 → then 159.83 → then a full rotation into 164.46, where we meet a 1H OB stacked with prior inefficiencies
The volume profile shows clear acceptance in this range. If we hold and rotate back above 157.01 with strength, expect continuation. If we sweep below 153.95 and fail to reclaim, the idea flips.
Execution clarity:
Longs from 155.75–155.00, invalidation below 153.95
First reaction target: 158.27
Full structure target: 164.46
Below 151.67 = deeper reprice scenario into weekly inefficiencies
No noise. No hype. Just structure. The chart is clean — the plan is already in motion.
Want more setups like this before they move? Profile description has them.

They see a rejection. I see a setupSOL swept the low, ran back to premium, and is now hovering in a reactive FVG.
Most traders see uncertainty here — but this is exactly where structure sharpens.
Here’s what just happened:
Price reversed off a well-defined STB and reclaimed the inefficiency above
It pierced into 162.35 before rejecting — not a failure, but a setup
That move left behind two stacked 1H FVGs
We’re now in the upper one — a re-entry pocket if you understand what this is
This zone between 158.21 and 156.93 is where I expect a reaction. If it holds, structure is preserved and the push toward 161.41 → 168+ resumes.
If it fails, we likely probe 153.83 or deeper into 151.51 — one last shake before the run.
Bias: Long
Trigger: Clean reaction off 1H FVG, higher low formed
Invalidation: Below 151.51
Target: 162.35 first, then 168.93+ on continuation
More setups like this — structured, timed, no fluff — are in the profile description.
No group chat noise. Just levels that matter.

They saw consolidation. I saw controlled accumulation at OB.SOL just printed what looks like sideways noise — but structure tells a different story.
Price swept the 0.786 fib at 151.44, tapped into a refined 4H OB, and held. That isn’t indecision. That’s deliberate compression — Smart Money accumulating just beneath the surface while the herd waits.
Volume profile confirms it. We’re sitting on a high-volume node, and price hasn’t broken it with conviction. Every wick down is a test — and every recovery is another sign of intent.
If price holds above the 4H OB zone, I expect delivery first into 161.49 — an unmitigated OB that lines up with prior liquidity. From there, 171.62 becomes the macro draw. That’s where imbalance meets memory.
Execution alignment:
🟩 Entry: 151.44–153.00 (OB retest zone)
🎯 TP1: 161.49
🎯 TP2: 171.62
❌ Invalidation: Break below 150.53 with displacement
This isn’t consolidation. This is foundation.
I don’t wait for permission. I wait for price to tip its hand.
