Is Solana poised for a reversal?Solana’s (SOL) price has faced notable volatility in recent weeks, struggling to overcome resistance at $160. After multiple failed attempts to breach this level, SOL experienced a significant 20% drawdown towards the end of August.
This decline has left many investors cautious, but recent shifts in behavior suggest a potential rebound. Key indicators now point to a possible resurgence in Solana’s price, raising optimism among traders and analysts.
A key factor in assessing Solana’s potential recovery is the recent negative turn in the funding rate. This metric, which tracks the cost of holding positions in the futuresmarket, often signals shifts in market sentiment.
Brian Quinlivan, Lead Analyst at Santiment, noted in an exclusive comment for BeInCrypto that the funding rate is turning negative. This indicates that the bearish sentiment may be reaching an extreme, which sets the stage for a rebound.
Furthermore, the Chaikin Money Flow (CMF) indicator, which measures the cumulative flow of money into and out of an asset, has established a notable pattern for SOL.
Currently, Solana’s price is trading at $132 after bouncing back from the support level of $126. For SOL to resume its upward trajectory, it must break through the local resistance at $137.
Achieving this would pave the way for a push towards the $160 mark. Historical data shows that Solana has experienced similar consolidation phases between $126 and $160, suggesting a rise to this level could be next.
The factors supporting this forecast are substantial, given that in the past, SOL around $126 has led to subsequent price increases. If SOL maintains its gradual upward momentum, the range-tested level of $137 could act as a springboard for further gains, making a rise to $160 possible.
Solanausdt

SOL LONG TRADE IDEASol/Usdt has done MSS and turned into bullish after breaking bearish structure. As Market structure turned into bullish so we will look for longs. For taking entries most important factor is order block with fvg and also SSL above order block. And this OB+FVG+SSL combination has been marked onto the chart.

Long Setup on SOLUSDT / Setup SettingBINANCE:SOLUSDT
COINBASE:SOLUSD
SL1 ---> Low-risk status: 3x-4x Leverage
SL2 ---> Mid-risk status: 5x-8x Leverage
👾The setup is active but expect the uncertain phase as well.
➡️Entry Area:
Yellow zone
⚡️TP:
0.001276
142.00
144.20
147.14
150.3
154.19
🔴SL:
125.42
🧐The Alternate scenario:
If the price stabilizes below the trigger zone, the setup will be cancelled.

SOLANA (SOLUSD) 170% Profit - Price from $154 to $127SOLANA (SOLUSDT)
Short entry at $124 on 27 August, 2024
Profit target 4 reached on 4 Sep, 2024
At 10x lev, the total profit is 170%
The trailing stoploss for this trade is at $145, so if you are in profit, you can sell 50% and hold your short trade by setting the trailing stop loss at $145
Good luck and all the best.
Namaste!

SOL Price Update & Analysis in a Daily Timeframe.Hello everyone, I’m Cryptorphic.
I’ve been sharing insightful charts and analysis for the past seven years.
Follow me for:
~ Unbiased analyses on trending altcoins.
~ Identifying altcoins with 10x-50x potential.
~ Futures trade setups.
~ Daily updates on Bitcoin and Ethereum.
~ High time frame (HTF) market bottom and top calls.
~ Short-term market movements.
~ Charts supported by critical fundamentals.
Now, let’s dive into this chart analysis:
From our previous analysis, SOL failed to hold the 21 EMA support and the primary support at $150-$155. The price dropped by 15.5% and is currently holding at the support trendline of $130.
SOL has strong support ranging between $120-$130, and it must hold this level to sustain and rebound back to the upper resistance trendline. A failure to hold this support will be concerning and a red alert for traders.
Key levels:
- Crucial Support/Accumulation: $120-$130.
- Primary Resistance: 35 EMA at $146.
- Target: $176-$180.
- RSI: Bullish Divergence Formation.
DYOR, NFA.
Please hit the like button to support my content and share your thoughts in the comment section. Feel free to request any chart analysis you’d like to see!
Thank you!
#PEACE

SOLANA: September Early TrendingThis is where SOL is heading if it able to stays above $134 ONLY as a start for this week. Check on the Fibs. and the the Support Line Vs. Resistant Line. Resistant Line is very near to take notice on as at anytime breakdown is possible.

$SOL wants to flyBut today I would like to focus on the Technical Analysis CRYPTOCAP:SOL perspective:
- The Weekly Stoch RSI it's as oversold as it was in early January, just before the Solana bull run.
- The Daily Stoch RSI it's also quite oversold pointing for a breakout
- We are reaching the final squeeze momentum against the local downtrend
- The $125 support has worked like magic 6 times already
- In every single test we have had a flush followed by a pump of around +32%
- The risk/reward looks top notch to me here

SOLANA (SOLUSD) Short Trade - All Targets DoneSOLANA (SOLUSD) pretty one-sided trade caught using the Risological indicator.
Short entry: 154.1
Take Profit 1: 149
Take Profit 2: 140
Take Profit 3: 132
Take Profit 4: 127
All profit targets done and dusted!

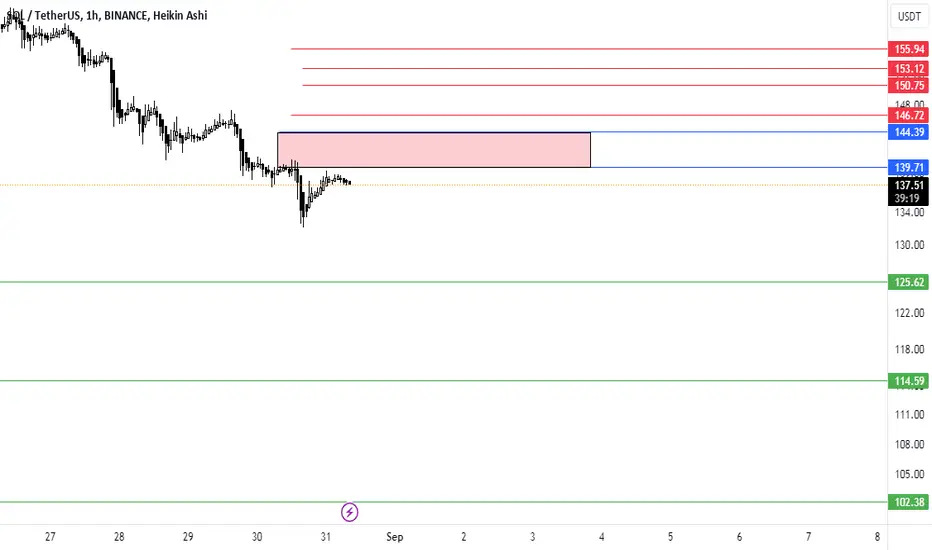
solIf the red box is broken, the next targets are the specified lines, otherwise, I am waiting for a buy step in the green lines.
#SOL/USDT#SOL
The price is moving in a descending channel on the 4-hour frame and is sticking to it very well and is expected to break it upwards
We have a bounce from a major support area at the lower line of the channel at a price of 140
We have a downtrend on the RSI indicator which supports the rise
We have a trend to stabilize above the moving average 100
Entry price 142.20
First target 149.31
Second target 152.89
Third target 156.31

SOLANA Update - About to get BEARISH?SOLANA (SOLUSDT) looking weak here.
SOLANA has hit the Trailing stop loss at $154.8 and I have closed my LONG position as per the Risological swing trading indicator.
If the current 4H candle closes in red, I will look for fresh SHORT opportunity.
In any case, Iam ready to catch the right trend and trade.
Market is looking weak right now, though that might change in just one reversal candle.
Cheers and all the best.

SOLANA will rise againI see the ABC correction on Solana, it will rise to 190-200 next week.
Note : Please follow your strategy, this is just my idea and i will gladly see your ideas in this post.
Don't forget to put STOP LOSS for your position, remember STOP LOSS is the key of consistency trading for long term.

#SOL/USDT#SOL
The price is moving in a descending channel on the 1-hour frame and is about to break upwards
We have a trend to stabilize above the moving average 100
We have a downtrend on the RSI indicator that supports the rise by breaking it upwards
We have a major support area in green at a price of 136.50 from which the price rebounded
Entry price 139
First target 144
Second target 150
Third target 156

SOLUSDT Rectangle Pattern FormationSOLUSDT Technical analysis update
SOL has been forming a rectangle pattern for the last 170 days. The price is now approaching the rectangle's resistance, indicating a potential breakout. If the breakout occurs, we can expect a strong bullish move in SOL, with the price possibly reaching $500 in this bull run.
In day chart 200 EMA act as a good support for SOL
A similar pattern formed at the bottom, where the price stayed within a rectangle for 280 days before breaking the resistance and surging 600%. We could see a similar move once the current rectangle is broken.
Regards
Hexa

Solana : WHICH WAY Could it go??Solana was one of my TOP PICKS for alts in 2024.
Second to Ethereum, the SOL space keeps growing as more and more dApss are being built on SOL. The market cap for Solana is looking healthy, after recently peaking at $93B:
This is an incredible achievement, and I expect the market cap to continue to grow in the longer time. Naturally, we can expect SOL to continue growing when the price of BTC starts another impulse wave up. My thoughts on that HERE👇:
Until then, don't lose hope just yet! December is usually a great time for the crypto markets.
_________________________________
CRYPTOCAP:SOL COINBASE:SOLUSD

SOLANA Possible to form Cup And Handle patternSOLANA being sideways for several months, but overall trend still strong bullish momentum for longterm right now. Nowadays they have chance to form " Cup and Handle " pattern to bring price to higher target price at 1.272 and 1.618 fibonacci extension.

SOLUSDT 1WSOL ~ 1W
#SOL There's still a long way to go for NASDAQ:COIN CRYPTOCAP:ETH Killer,. Our target for $Solana is $400-$500.
Hold and buy again if the price dips.

SOLUSDT Bullish Flag!SOLUSDT Technical analysis update
SOL price has formed a bullish flag pattern on the 4-hour chart, and a breakout has been confirmed. We can expect a strong bullish move from the current level.
Buy zone : Below $1.07
Stop loss : $0.88
Regards
Hexa

SOL (Solana): Sideways ChannelTrade setup : Price remains in an Uptrend, trading in a Sideways Channel. Swing Traders: can trade the Channel, enter near channel support of $120 and exit near channel resistance of $190. Stop Loss (SL) at $115. Learn how to trade Sideways Channel in Lesson 6 of our Trading Course.
Pattern : Price is trading in a Sideways Channel , which is a neutral pattern (indication of market indecision). Trend Traders ought to wait for a breakout in either direction, although typically it breaks in the direction of the existing trend. Swing Traders can trade the range - Buy near Support and Sell near Resistance. Learn to trade Sideways Channel in Lesson 6.
Trend : Short-term trend is Strong Down, Medium-term trend is Down and Long-term trend is Strong Up.
Momentum is Bearish ( MACD Line crossed below MACD Signal Line) BELOW days ago. Price is neither overbought nor oversold currently, based on RSI-14 levels (RSI > 30 and RSI < 70).
Support and Resistance : Nearest Support Zone is $120.00, then $100.00. Nearest Resistance Zone is $160.00, then $190.00.

SOL Current Downtrend Channel Placed Itself Just Above Last HighThe red downtrend channel has formed above the process continuing from the $194 high area. The price has been using this channel since it rose from the $110 area.
However, in the last 2 days, the price has reached the upper area of the channel again and if it is rejected as before, it will accelerate the downward momentum by following the blue channel below and move to the $115 area.
But if it breaks the area it is currently stuck in, it will follow the green arc and move to the $180 area. In both cases, the breakout seems very close.

SOL is so clear!!! Follow me!!SOL has a very attractive position, as you can see it can have a heavy drop after climbing to the specified area.
Tank you for subscribe and like me

SOL (Solana): Sideways ChannelTrade setup : Price remains in an Uptrend, trading in a Sideways Channel. Swing Traders: can trade the Channel, enter near channel support of $120 and exit near channel resistance of $190. Stop Loss (SL) at $115. Learn how to trade Sideways Channel in Lesson 6 of our Trading Course.
Pattern : Price is trading in a Sideways Channel , which is a neutral pattern (indication of market indecision). Trend Traders ought to wait for a breakout in either direction, although typically it breaks in the direction of the existing trend. Swing Traders can trade the range - Buy near Support and Sell near Resistance. Learn to trade Sideways Channel in Lesson 6.
Trend : Short-term trend is Down, Medium-term trend is Down and Long-term trend is Strong Up.
Momentum is Bearish ( MACD Line crossed below MACD Signal Line) BELOW days ago. Price is neither overbought nor oversold currently, based on RSI-14 levels (RSI > 30 and RSI < 70).
Support and Resistance : Nearest Support Zone is $120.00, then $100.00. Nearest Resistance Zone is $160.00, then $190.00.
