SOL/USD "SOLANA" Crypto Market Heist Plan on Bearish Side🌟Ola! Bonjour! Hi! Hallo!🌟
Dear Money Makers & Robbers, 🤑 💰
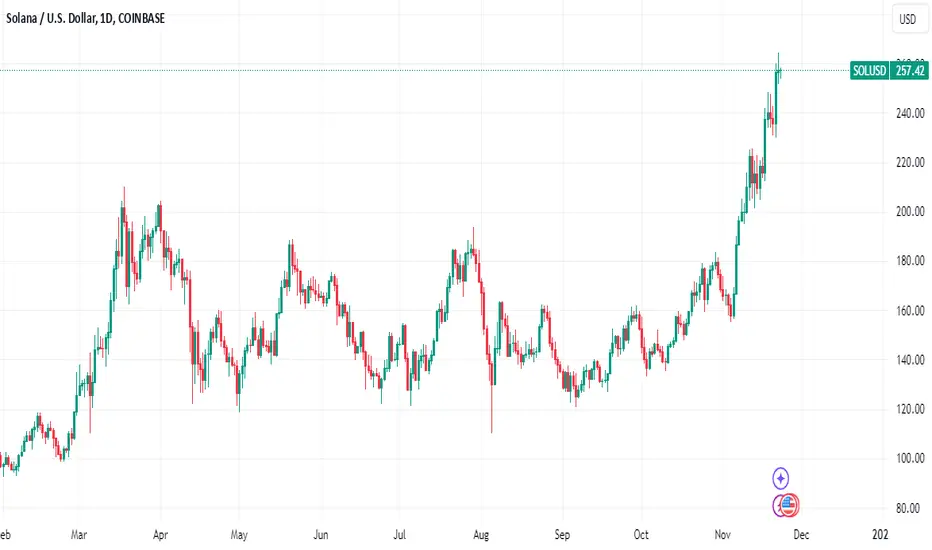
Based on 🔥Thief Trading style technical analysis🔥, here is our master plan to heist the SOL/USD "SOLANA" Crypto market. Please adhere to the strategy I've outlined in the chart, which emphasizes short entry. Our aim is the high-risk Green Zone. Risky level, oversold market, consolidation, trend reversal, trap at the level where traders and bullish robbers are stronger. 👀 So Be Careful, wealthy and safe trade.💪🏆🎉
Entry 📉 : You can enter a trade anywhere,
however I advise placing sell limit orders within a 15 or 30 minute timeframe. Entry from the most recent or closest high level should be in retreat.
Stop Loss 🛑: Using the 2H period, the recent / nearest high level.
Goal 🎯: 192.00
Scalpers, take note : only scalp on the Short side. If you have a lot of money, you can go straight away; if not, you can join swing traders and carry out the robbery plan. Use trailing SL to safeguard your money 💰.
Warning⚠️ : Our heist strategy is incompatible with Fundamental Analysis news 📰 🗞️. We'll wreck our plan by smashing the Stop Loss 🚫🚏. Avoid entering the market right after the news release.
Take advantage of the target and get away 🎯 Swing Traders Please reserve the half amount of money and watch for the next dynamic level or order block breakout. Once it is resolved, we can go on to the next new target in our heist plan.
💖Supporting our robbery plan will enable us to effortlessly make and steal money 💰💵 Tell your friends, Colleagues and family to follow, like, and share. Boost the strength of our robbery team. Every day in this market make money with ease by using the Thief Trading Style.🏆💪🤝❤️🎉🚀
I'll see you soon with another heist plan, so stay tuned 🫂
Solanausdt

Solana might be topping around 1500.I see solana behaving similar to eth on cycle behind. If this plays out we could be topping around 1500 and bottoming at these levels in 2026

SOLANA TO DUMP?Just a quick & simple update for SOL. I have a few of my entry criteria being met for a trend change short opportunity on Solana. On the daily time frame you can clearly see the crossover of the SMA's (1)
The market has pulled back to retest the crossover price area which also lines up with the %61.8 fib retracement level which is additional confirmation for me the trend is changing, coupled with continuous LH's & LL's.
I would look to target the $180 price for a target which also lines up with the %61.8 target projected by the Fib. Lets see how it plays out around the current level, if BTC continues to consolidate and looks bearish and all the resistance levels continue to reject on SOL then i'll look for entry on this providing there is confluence on entry criteria.
Potential 30% to be made, all eyes on XRP, SOL & BTC for the moment. Don't forget how BTC pans out will have a lot to do with all the Alts, so if BTC pumps it'll void this trade idea as SOL is highly correlated.

Solana Best DCA LevelsAs an investor who likes to act with the DCA strategy, I have compiled the best buy zones for you by determining the support and resistance points for Solana on a weekly basis. I will explain why I named these buy zones in this way.
$260 - $202.29 (Not Preferable): Since this level is the psychological resistance level where the previous ATH is located, I think those who have Solana in their pocket should keep it at this level. If an investor who does not have Solana in their pocket wants to buy Solana, since this level is psychological resistance, the probability of rejection and breaking is 50-50. Therefore, it is not a very suitable position for buying. In the correction that will occur in the event of a resistance break, buying would be much more logical.
$202.29 - $128.16 (Good to Buy): This level has found good volume in 2024 and a side channel has been experienced. As long as the price does not fall permanently below the moving averages or the Hodrick-Prescott filter that I am currently showing on the chart, this level is a very good buy level. Investors who are especially waiting for an ATH breakout have made their preparations at this level.
$128.16 - $87.79 (Cautious): Although it has been used as support twice, this level cannot be considered a perfect buy area since it is a level with relatively low volume. Therefore, it would be more accurate to expect Solana to converge to one side.
$87.79 - $48.72 (Not Preferable): Probably one of the worst buy areas on the chart. Volume is almost non-existent. There is a big gap. Therefore, the price moves very sharply from $87 to $48.
$48.72 - $28.26 (Good to Buy): This is the area where Solana is starting to recover. It is a good area to buy.
$28.26 - $14.48 (Best Place to Buy): I don't know if this level will be seen again, but it is the level where Solana is extremely cheap. While most investors cry at this level, smart investors continue to collect Solana.
Any DCA is suitable for investors who think Solana has a 4-digit intrinsic value. This analysis only indicates the best areas.

Solana: Time to buy | go long BINANCE:SOLUSD Solana has found multiple support at 210, daily pivot, daily Anchored VWAP and 50% Fib retracement. Buy entry activated at 230 and Stop loss at 210. First TP 267 and second TP 300. Manage your risk properly. Use trailing stop loss.

SOL $260 - Bounce from Support for 26.72% ReturnAltcoins, including BINANCE:SOLUSDT , got hit today and tumbled more than 10%. Nevertheless, the situation remains bullish overall. Solana hit support at $204.00 and bounced right off from it. We're currently targeting the last HH (higher high) at $260.00 which could give us up to 26% in return for this trade. Of course, if we break below $204.00 and close the daily candle there the trade would be disqualified.
We are also inside a bullish flag (blue channel) that looks like a healthy consolidation of the former leg up we made during November.
Support Zone:
$204.00
Resistance/Target Zone:
$260.00
Let me know what you think!

SolanaSol usdt analysis
Time frame 4 hours
Risk rewards ratio >3 👈👌
Base on technical analysis
Head and shoulders pattern is created . Then price dropped
Now the price is close to strong support
Solana reached new peak after 2 years and then dropped.
Now this support area is good to enter and give a good benefit

Solana breaks from a consolidation point: analysisSolana has surpassed BNB to enter the top fifth crypto after rising over the consolidation around $230. The rise in the value of the star token, Bitcoin, helped the SOL price rise break the crucial resistance. Now that the price has initiated a huge breakout, the token is believed to maintain a steady ascending trend. However, the possibility of a bearish reversal also emerges, which could drag the levels back to $235 and levels slightly below.
The bearish activity had outpowered the Solana bulls ever since the token formed a new ATH above $264. The price dropped further and the plunge in volume prevented the bulls from lifting the levels from the interim lows. However, with the beginning of the fresh monthly trade, the bulls seem to have gained acute strength. As a result, after the current breakout, the SOL price is primed to surpass the current ATH to reach $270 shortly.
The short-term price action of Solana suggests the price has broken the upper resistance of the descending parallel channel and attracted bearish attention. However, the technicals continue to remain bullish, which suggests the price may withstand the bearish pressure and eventually enter the resistance zone between $247.09 and $250. The stochastic RSI has rebounded from the interim descensing trend, indicating the levels to remain around the upper threshold for a while. This hints towards an extended bullish consolidation that may assist the SOL price to rise above $250.
Therefore, the Solana price could reach $300 before the end of 2024, provided the upcoming weekly close needs to be above the current ATH. Otherwise, the price may remain consolidated below the ATH for a long time and just before the yearly close could validate a strong upswing.

Is Solana (SOL) Setting the Stage for a Historic All-Time High?Solana (SOL) Ignites a Bullish Fire: Is a New All-Time High Imminent?
Solana (SOL), a high-performance blockchain platform, has recently showcased remarkable bullish momentum, captivating the attention of both seasoned investors and crypto enthusiasts. With a significant portion of traders holding long positions, SOL appears poised to break out of its consolidation phase and potentially reach new all-time highs.
A Technical Analysis Deep Dive
A closer look at SOL's technical analysis reveals a compelling bullish narrative:
• Breaking the Bearish Trend: SOL has successfully broken out of a two-week descending trendline, signaling a shift in market sentiment. This bullish breakout has propelled the price towards its all-time high.
• Strong Demand Zone: The price's reaction to a previously identified demand zone has further fueled the bullish momentum. This indicates strong underlying buying pressure and a potential catalyst for further price appreciation.
• Key Resistance Level: The $251 level represents a crucial resistance zone. A successful breakout above this level could pave the way for a significant upside move, potentially towards the $300 or even $500 mark. However, a rejection at this level could lead to a temporary pullback or consolidation phase.
Why is SOL Attracting Bullish Sentiment?
Several factors are contributing to the bullish sentiment surrounding SOL:
• High Performance and Scalability: Solana's innovative proof-of-history consensus mechanism enables it to process a high volume of transactions at a low cost, making it a compelling choice for developers and users alike.
• Growing Ecosystem: The Solana ecosystem is rapidly expanding, with a growing number of decentralized applications (dApps) being built on the platform. This increased adoption and utility can drive demand for SOL tokens.
• Institutional Interest: Institutional investors are increasingly recognizing the potential of Solana and are allocating capital to the platform. This institutional interest can provide significant support to the price of SOL.
• Positive Market Sentiment: The overall bullish sentiment in the cryptocurrency market has also positively impacted SOL's price. As investor confidence grows, more capital is flowing into promising projects like Solana.
The Road Ahead for SOL
While the current bullish outlook for SOL is promising, it's important to remember that the cryptocurrency market is inherently volatile. Factors such as broader market trends, regulatory developments, and technological advancements can influence SOL's price.
Investors should conduct thorough research and consider their risk tolerance before investing in SOL or any other cryptocurrency. It's also advisable to diversify one's portfolio and avoid putting all eggs in one basket.
In conclusion, SOL's recent price action and strong technical indicators suggest a potential for significant upside. However, investors should remain cautious and monitor market developments closely. With a strong foundation, a growing ecosystem, and increasing institutional interest, SOL has the potential to continue its upward trajectory and deliver substantial returns to its holders.

SOL road to 500+Solana can lead the alt coin market. Do not miss this one. Price discovery mode can lead to higher prices very quickly.
NOT A FINANCIAL ADVICE
ALWAYS USE STOPLOSS AND MANAGE YOUR RISK

Will Solana see extreme bullish reversal?Solana (SOL) has been in a downward spiral over the past week. Since reaching a new all-time high of $264.63 on November 22, SOL has encountered a surge in selling pressure. This has caused its price to drop by almost 10% in the past seven days.
This decline has led to an uptick in long liquidations in the SOL futures market. With strengthening bearish sentiments, Solana long traders may face more losses. Here is why.
Over the past week, SOL’s 8% price drop has wiped out $64 million in long positions from its derivatives market.
This is a bearish signal for SOL because as Solana long traders attempt to avoid further losses to their investments, their selling pressure can increase and contribute to further downward movement in the market.
Notably, the decline in SOL’s price has led to a significant drop in activity in its derivatives market. This is reflected in the coin’s open interest, which currently rests at a weekly low of $3.34 billion.
Solana’s Awesome Oscillator confirms the uptick in bearish bias toward the coin. As SOL’s price records a decline over the past week, the indicator has returned red histogram bars.
If selling activity gains more momentum, SOL’s price will break below the crucial support level, formed at $231.54. A dip below this price point will send SOL’s price downward to $205.56.
On the other hand, if buying pressure gains momentum, SOL’s price will climb toward its all-time high of $264.63.

Solana Eyes $290 After Testing $260 Resistance📊 Solana is trading within an ascending channel, currently targeting the key resistance at $260.
✅ If this level breaks, the price could rise further toward $290, the next major resistance.
👉🏼 A rejection at $260 might lead to a pullback within the channel.

Solana faces $6 billion short bet as price drops 12% from peakSolana (SOL) has faced increased selling pressure since it climbed to an all-time high of $264.63 on November 24. Exchanging hands at $232.72 at press time, the coin’s value has since dropped by 12%.
With waning bullish sentiment in the broader cryptocurrency market, this downward trend has prompted a surge in short positions, with traders betting on a further SOL price drop.
According to Coinglass, over the past 24 hours, the total value of Solana short positions has reached $6 billion, significantly outpacing long positions at $5.38 billion. This indicates a strong bearish sentiment among traders.
On the daily chart, SOL’s price is poised to break below its 20-day Exponential Moving Average (EMA). This indicator tracks the asset’s average price over 20 days, giving more weight to recent prices.
Since October 11, it has consistently served as a dynamic support level for SOL. Currently, the 20-day EMA provides support at $226.52, and a decisive break below this level would confirm the shift toward bearish momentum. If this happens, the SOL price drop may reach $205.56.
On the other hand, if market sentiment becomes more bullish, SOL’s price may rally toward its all-time high of $264.63.

SOL - What To Expect NextMartyBoots here , I have been trading for 17 years and sharing my thoughts on SOL.
SOL is looking good still , into a huge level
Very similar to BTC which moved up hard from this level
Do not miss out on SOL as this is a great opportunity
Watch video for more details

Can we make it to 700 dollars for SolanaThis crypto has been so strong this bullmarket that I am not surprised seeing at least a 700 dollars target.

Solana (SOL) Price Technical Analysis - Nov, 2024Solana SOL, priced at currently ($256.83) picked up momentum after breaking out of $249 on Nov. 21st and hit a new all-time high above $264 on Nov. 22nd, breaking from the previous high from 2021.
The new all-time high is a bullish sign as it shows solid demand for the asset from the bulls. With no overhead resistance above the region now, a new high clears the path for further gains. If buyers maintain the price above $248, the SOL/USDT pair is likely to skyrocket to $300.

Solana (SOL): 430% Gain at 10x LeverageSolana (SOL) Trade Overview:
Solana (SOL) has delivered an incredible rally on the 4-hour timeframe. Using the Risological Swing Trader , the trade not only hit all predefined targets but exceeded expectations, achieving a 430% gain at 10x leverage.
Key Levels:
Entry Price: $175.68
Stop Loss (SL): $165.36
Take Profit Targets:
TP1: $188.45 ✅
TP2: $209.10 ✅
TP3: $229.75 ✅
TP4: $242.51 ✅
Analysis:
The Risological Lines perfectly highlighted a sustained bullish trend. Solana maintained its upward momentum, achieving rapid target hits. The Risological green lines provided a clear path for the trade's continuation, enabling traders to maximize their profits.
Outlook:
With all targets hit, Solana's trajectory remains strong. Traders may look for additional entries or secure profits as the bullish momentum shows no signs of slowing down. A well-executed trade like this emphasizes the power of Risological indicators for precision trading.

Understanding Solana: The Potential for Continued GrowthSolana's native cryptocurrency, SOL, has recently hit a new all-time high, sparking excitement and speculation among investors. This surge in price can be attributed to several factors, including the broader cryptocurrency market rally, increased institutional interest, and the growing popularity of Solana's blockchain network.
The Memecoin Mania Factor
One of the key drivers behind Solana's recent price surge has been the memecoin mania that has swept the cryptocurrency market. Solana has emerged as a popular platform for launching new memecoins, attracting significant trading volume and investor interest. The rapid growth of the memecoin ecosystem on Solana has led to increased demand for SOL, the network's native token.
Bitcoin's Influence
Bitcoin's recent price rally has also had a positive impact on Solana. As the dominant cryptocurrency, Bitcoin often sets the tone for the broader market. When Bitcoin's price rises, it tends to lift the prices of other cryptocurrencies, including Solana. This correlation between Bitcoin and Solana has contributed to SOL's recent upward momentum.
Increased Institutional Interest
Another factor driving Solana's price surge is the increasing interest from institutional investors. Many large financial institutions are now exploring opportunities in the cryptocurrency market, and Solana has emerged as a promising platform for building decentralized applications (dApps). Institutional investors' growing adoption of Solana could lead to further price appreciation in the long term.
Solana's Unique Value Proposition
Solana's unique value proposition, including its high throughput, low transaction fees, and fast block times, has attracted a significant developer community. The growing number of dApps being built on the Solana network has increased the demand for SOL, as it is used to pay transaction fees.
Potential Challenges and Risks
While Solana's future looks promising, it is important to acknowledge that the cryptocurrency market is highly volatile and subject to significant price swings. Several factors could potentially impact Solana's price, including regulatory uncertainty, network congestion, and competition from other blockchain platforms.
Additionally, the recent surge in Solana's price has raised concerns about the sustainability of its momentum. Some analysts believe that the current price levels may not be justified by the underlying fundamentals of the network. As such, investors should exercise caution and conduct thorough research before investing in Solana.
Conclusion
Solana's recent price surge has been impressive, but it is important to approach the future with a balanced perspective. While the long-term potential of Solana is significant, short-term price fluctuations are inevitable. Investors should focus on the underlying technology and the long-term growth prospects of the Solana ecosystem, rather than short-term price movements.
As Solana continues to attract developers, users, and institutional investors, it is likely to remain a major player in the cryptocurrency market. However, it is essential to manage risk and diversify investments to mitigate potential losses.
Solana hits new ATH of $264. Is $300 next?As Bitcoin surpasses the $99,000 mark, with a new all-time high of $99,314, Solana shares the momentum to hit a new ATH. With a 10% surge in the last 24 hours, the bull run in SOL price powers tailwinds for other altcoins.
In the weekly chart, the SOL price action showcases a descending triangle breakout rally, completing a cup and handle pattern. This pattern breakout with the neckline at the $249 mark has resulted in a new all-time high for Solana.
Currently, it is trading at $257, with a 24-hour high of $264. As the bullish trend continues, SOL price action is on the verge of completing the third consecutive bullish week.
As Solana is trading at uncharted levels, the underlying bullish momentum is teasing an uptrend continuation. Furthermore, with the broader market recovery at play and Bitcoin inching closer to the $100,000 mark, Solana is likely to hit the $300 mark.
What is more, MACD is also showing a strong bullish reading via positive crossover and a spike of bullish histograms.
Based on the Fibonacci levels, the upside price target for Solana is at $602.92. This price coincides with the 1.272 Fibonacci level on the logarithmic chart and makes $300 a potentially easy target.
On the flip side, a retest of the $250 breakout is possible if the buying pressure recedes.

Solana’s Path to $500: Is It the Investment of the Year?Solana ( CRYPTOCAP:SOL ) continues to defy expectations, showcasing resilience and growth even in a volatile market. With SOL Global Investments Corp announcing plans to raise CAD 3.6 million to acquire Solana tokens, institutional interest is reaching new heights. This strategic move comes as Solana gains traction as a leading blockchain platform, further solidifying its reputation as the "Ethereum Killer."
Fundamental Highlights
SOL Global Investments Corp, a Canadian firm, is raising CAD 3.6 million through a private placement to bolster its digital asset portfolio, focusing heavily on Solana. The offering consists of 18 million units priced at CAD 0.20 per unit, with each unit containing one common share and half a purchase warrant exercisable at CAD 0.30. The proceeds will fund Solana token acquisitions at current market prices.
This investment reflects a broader strategy by CRYPTOCAP:SOL Global to capitalize on Solana's growth potential in blockchain and digital assets. The decision underscores the increasing institutional confidence in Solana's robust ecosystem and its ability to deliver scalable, decentralized solutions.
Solana’s market performance supports this optimism:
- Market Cap: $112 billion, making it the 4th largest cryptocurrency.
- Trading Volume: $6.63 billion, reflecting heightened liquidity.
- Recent Performance: +43% over the past month, with a current price of $237.
These fundamentals highlight Solana’s growing dominance in the crypto space, particularly as institutional investors like SOL Global position themselves to benefit from its upward trajectory.
Technical Analysis
Solana's price action suggests it’s poised for further growth. Currently trading at $237, the token shows mixed signals on the daily chart but retains an overall bullish outlook.
The appearance of a doji candlestick signals indecision among traders. However, this often precedes a continuation of the prevailing trend, which in Solana’s case has been upward.
Solana’s RSI stands at 70, entering overbought territory. While this suggests caution, it also indicates strong momentum that could drive the price higher. CRYPTOCAP:SOL has consistently traded above key moving averages for over a week following an extended consolidation period. This is a bullish sign, confirming the token’s breakout strength.
We predict Solana (SOL) could rally towards $500 in the coming months, supported by institutional inflows and the platform’s growing ecosystem.
The Broader Picture: Solana’s Ecosystem
Solana ( CRYPTOCAP:SOL ) has cemented its status as a premier blockchain platform, boasting faster transaction speeds and lower costs compared to Ethereum. Its increasing adoption for decentralized applications (dApps), DeFi protocols, and NFTs highlights its utility and scalability.
This narrative is further reinforced by SOL Global’s significant investment, which not only validates Solana’s potential but also sets the stage for a continued price rally. With strong fundamentals and technical indicators aligning, Solana is well-positioned to capitalize on the growing demand for blockchain solutions.
Conclusion
Solana’s journey to $500 may not be far-fetched. The combination of institutional backing, strong market fundamentals, and bullish technical signals suggests the blockchain is on a path to greater adoption and valuation.
Will CRYPTOCAP:SOL hit $500 before Christmas? With the current momentum and growing interest, Solana might just redefine what’s possible for the crypto market this holiday season.

Solana's Rise: A Challenger to Ethereum's Throne?
Solana, the high-performance blockchain, has made significant strides in the cryptocurrency market, particularly against the long-standing Ethereum. With a 70% rally against Ethereum in 2024, Solana has positioned itself as a strong contender, despite its significantly lower market capitalization.
The Solana Advantage
Solana's ascent can be attributed to several key factors:
• High Throughput: Solana boasts impressive transaction speeds, capable of processing thousands of transactions per second. This is a significant advantage over Ethereum, which often faces scalability issues.
• Low Transaction Fees: Solana's low transaction fees make it an attractive option for users, especially for smaller transactions.
• Smart Contract Functionality: Solana supports smart contracts, enabling the development of decentralized applications (dApps) and other innovative projects.
The Dark Cloud Over Solana's Horizon
While Solana's performance has been impressive, concerns have emerged regarding the sustainability of its growth. A recent report revealed that a significant portion of Solana's record-breaking $318 billion transfer volume was driven by bots, rather than organic user activity. This raises questions about the true level of interest and adoption of the Solana network.
What Does This Mean for Solana's Future?
The revelation of bot-driven activity could have significant implications for Solana's future. If the network's growth is not supported by genuine user adoption, it may struggle to maintain its momentum. A decline in user interest could lead to a decrease in network activity and potentially a drop in the price of SOL.
The Impact on Your Crypto Holdings
As an investor, it's crucial to consider the potential impact of Solana's rise and the concerns surrounding its growth on your crypto portfolio. Here are a few things to keep in mind:
• Diversification: Diversifying your portfolio across multiple cryptocurrencies can help mitigate risks. Consider investing in a mix of established cryptocurrencies like Bitcoin and Ethereum, as well as promising altcoins like Solana.
• Due Diligence: Before investing in any cryptocurrency, conduct thorough research and analysis. Pay attention to factors such as the project's technology, team, community, and market sentiment.
• Risk Tolerance: Assess your risk tolerance and invest accordingly. If you're comfortable with higher risk, you may consider investing in Solana. However, if you prefer a more conservative approach, it may be wise to stick with more established cryptocurrencies.
• Stay Informed: Keep up-to-date with the latest news and developments in the cryptocurrency market. Follow reputable news sources and analysts to stay informed about potential risks and opportunities.
Conclusion
Solana's rapid rise has captured the attention of the cryptocurrency community. However, it's essential to approach this emerging blockchain with a critical eye. While its technology and performance are impressive, the concerns surrounding its growth and the potential impact of bot-driven activity cannot be ignored. As an investor, it's crucial to make informed decisions and carefully consider the risks and rewards before investing in Solana or any other cryptocurrency.
Disclaimer: This article is for informational purposes only and should not be construed as financial advice. Please consult with a qualified financial advisor before making any investment decisions.1

Analyzing Solana's Bullish Surge: Is a $250 Rally on the Horizon
Solana (SOL), the high-performance blockchain platform, has recently embarked on a significant upward trajectory, surpassing the $220 resistance level. As the cryptocurrency market continues to exhibit bullish momentum, Solana's price action suggests a potential rally to the $250 mark.
Key Factors Driving Solana's Rise
Several key factors are contributing to Solana's bullish sentiment:
1. Enhanced Network Performance:
o Solana's robust network infrastructure, capable of processing thousands of transactions per second, has attracted developers and users alike.
o Recent upgrades and optimizations have further improved network performance, reducing transaction fees and latency.
2. Growing DeFi Ecosystem:
o Solana's DeFi ecosystem has witnessed substantial growth, with a diverse range of decentralized applications (dApps) emerging.
o Projects like Serum, Raydium, and Orca have gained significant traction, driving demand for SOL tokens.
3. Institutional Adoption:
o Institutional investors are increasingly recognizing the potential of Solana as a scalable and efficient blockchain platform.
o This growing institutional interest could lead to increased capital inflows and price appreciation.
4. Positive Market Sentiment:
o The broader cryptocurrency market has been experiencing a period of bullish sentiment, with Bitcoin and Ethereum leading the charge.
o This positive market sentiment has spilled over to altcoins like Solana, fueling its upward momentum.
Technical Analysis: A Bullish Outlook
From a technical perspective, Solana's price chart exhibits a bullish outlook:
• Breakout Above $220: The recent breakout above the $220 resistance level is a significant bullish signal, indicating a potential shift in market sentiment.
• Consolidation Phase: Solana's price is currently consolidating gains, which could be a precursor to a more substantial upward move.
• Target Price of $250: The next major resistance level for Solana lies at $250. A successful break above this level could trigger a further rally.
• Bullish Indicators: Technical indicators such as the Relative Strength Index (RSI) and Moving Average Convergence Divergence (MACD) are signaling1 bullish momentum.
Potential Risks and Challenges
While Solana's future looks promising, it's important to acknowledge potential risks and challenges:
• Network Congestion: As Solana's popularity grows, network congestion could become a concern, leading to increased transaction fees and slower processing times.
• Regulatory Uncertainty: Regulatory uncertainty surrounding cryptocurrencies could impact Solana's price and adoption.
• Market Volatility: The cryptocurrency market is inherently volatile, and sudden price swings can occur without warning.
Conclusion
Solana's strong fundamentals, growing ecosystem, and positive market sentiment have positioned it for a potential rally to $250 and beyond. However, investors should exercise caution and conduct thorough research before making investment decisions. As with any investment, it's crucial to diversify your portfolio and manage risk effectively.
Disclaimer: This article is for informational purposes only and should not be construed as financial advice. It's important to consult with a qualified financial advisor2 before making any investment decisions.

Solana OI nears $5 million. Is new ATH on a horizon? Solana’s price rally has brought it close to forming a new all-time high, stirring optimism among traders and investors. The altcoin’s upward momentum reflects heightened market activity, but challenges remain as Solana struggles to breach critical resistance levels.
Solana traders exhibit strong optimism, with the asset’s Futures Open Interest (OI) reaching a record $4.7 billion. This surge highlights increasing confidence among traders as they pour significant capital into SOL amid its ongoing rally. With OI nearing $5 billion, Solana is experiencing a notable rise in market participation, reflecting heightened anticipation for further gains.
However, this growing OI highlights a divergence between expectations and current price movement. While traders are heavily investing, Solana’s price has yet to break past critical resistance levels. This contrast between open interest and price action raises questions about whether the bullish momentum can sustain itself or lead to a correction.
From a technical perspective, Solana’s Relative Strength Index (RSI) indicates overbought conditions, sitting well above the neutral range. Also, Solana’s macro momentum remains strong, driven by broader market cues and increased adoption. These factors contribute to the asset’s resilience, but the overbought conditions warrant caution. Investors will need to monitor whether Solana can maintain its upward trajectory or succumb to market pressures.
However, mixed signals from market sentiment and technical indicators suggest potential difficulties in overcoming $245. A failure to break through could send Solana down to $221 or lower, testing investor confidence.
