8/3/22 RUNSunrun Inc. ( NASDAQ:RUN )
Sector: Utilities (Alternative Power Generation)
Market Capitalization: $6.459B
Current Price: $30.74
Breakout Price: $34.25
Buy Zone (Top/Bottom Range): $28.80-$19.50
Price Target: $36.00-$37.30 (1st), $48.70-$49.60 (2nd)
Estimated Duration to Target: 21-22d, 84-88d
Contract of Interest: $RUN 8/19/22 35c, $RUN 10/21/22 35c
Trade price as of publish date: $0.93/contract, $3.05/contract
Solarenergy

ENPH M-pattern targets 328 if it BO of 283 D.top OR 222 retest?TAN solar etf together with its main component ENPHASE energy has been on a tear lately. ENPH made a W-pattern in 2021 & is again repeating it this 2022. It currently made a double top at 283 but shows no sign of rejection yet. If it retraces then the W=neck at 222 will be retested. But if it breaks above 328, then the Fib 1.272 at 328 will be the next target.
Not trading advice

TAN big break outbig down trend break on TAN ( solar etf). retesting the break out now intraday. solar can really be the leader of next run when ever we get that. solar names like ENPH SEDG are 7-8% away from ATH's. extra ordinary relative strength.
TAN is already up 15% in 2 days, so might be over heated in short term but long run looks really good.

Enphase Energy: Tight Consolidation & Golden CrossSolar energy has been one of a few bright spots in this bearish market. Today we’re looking at the company in the group with the largest market cap: Enphase Energy (ENPH).
The first pattern on this daily chart is the uptrend since mid-May -- the opposite of the broader market’s price action. In fact, ENPH hasn’t made a new 52-week low in 117 sessions. (The S&P 500 last made a new low 16 candles ago.)
Next is the tight consolidation illustrated by Bollinger Bands Width.
Third, you have the level around $220. ENPH probed and reversed at this area in April, June and July. But combined with the uptrend and narrowing price range, traders may look for a breakout if prices manage to cross this resistance. That could be especially true with earnings expected later this month.
Finally, notice how the 50-day simple moving average (SMA) is just now rising above the 200-day SMA. That kind of “golden cross” may signal that the longer-term trend is getting more positive. (Only 10 percent of the S&P 500 have their 50-day SMAs above the 200-day SMAs, according to TradeStation data.)
TradeStation has, for decades, advanced the trading industry, providing access to stocks, options, futures and cryptocurrencies. See our Overview for more.
Important Information
TradeStation Securities, Inc., TradeStation Crypto, Inc., and TradeStation Technologies, Inc. are each wholly owned subsidiaries of TradeStation Group, Inc., all operating, and providing products and services, under the TradeStation brand and trademark. You Can Trade, Inc. is also a wholly owned subsidiary of TradeStation Group, Inc., operating under its own brand and trademarks. TradeStation Crypto, Inc. offers to self-directed investors and traders cryptocurrency brokerage services. It is neither licensed with the SEC or the CFTC nor is it a Member of NFA. When applying for, or purchasing, accounts, subscriptions, products, and services, it is important that you know which company you will be dealing with. Please click here for further important information explaining what this means.
This content is for informational and educational purposes only. This is not a recommendation regarding any investment or investment strategy. Any opinions expressed herein are those of the author and do not represent the views or opinions of TradeStation or any of its affiliates.
Investing involves risks. Past performance, whether actual or indicated by historical tests of strategies, is no guarantee of future performance or success. There is a possibility that you may sustain a loss equal to or greater than your entire investment regardless of which asset class you trade (equities, options, futures, or digital assets); therefore, you should not invest or risk money that you cannot afford to lose. Before trading any asset class, first read the relevant risk disclosure statements on the Important Documents page, found here: www.tradestation.com .

7/10/22 TANInvesco Solar ETF ( AMEX:TAN )
Sector: Miscellaneous (Investment Trusts/Mutual Funds)
Market Capitalization: $--B
Current Price: $76.68
Breakout price: $78.20
Buy Zone (Top/Bottom Range): $71.60-$60.00
Price Target: $82.40-$83.90 (1st), $98.20-$101.00 (2nd)
Estimated Duration to Target: 55-59d (1st), 200-216d (2nd)
Contract of Interest: $TAN 8/19/22 80c, $TAN 1/20/23 80c
Trade price as of publish date: $3.50/contract, $8.20/contract

ENPH holds better than TAN;if mid165 fails, 120 will be retestedENPHASE is holding better than its mother ETF, TAN. Since 2021, it has basically been consolidating horizontally except for an overshoot 4Q2021. In contrast, the TAN etf is in a falling wedge formation.
BULLISH CASE: Better yet, it is holding above the middle of this conso box, the 165 to 170 zone. (Middle of 120 to 220). This is also a convergence of 3 VWAPs from recent highs & recent bottoms. If it holds 165, then 220 will be retested.
BEARISH CASE: If this midzone is lost, then a retest of 120 will be next or even a double bottom sometimes in 3Q2022 to create a divergence.
Not trading advice

TAN solar etf 55.50-77.50 range bound,may retrace to 68 mid/TLTAN is now on a shortterm uptrend forming a channel just like ENPH in the post last week.
It may retrace to 68 to retest the lower channel just like ENPH did. 68 is also the neck of a previous M-pattern. It is also the middle of the current trading range of 55.50 to 77.50.
TAN still have a long way to go especially with the Biden Administration boosting solar energy to lessen the future dependency on oil.
Target prices are 90 & 100 & the all-time-high at 125.
Not trading advice

JinkoSolar May Be Attempting a BreakoutJinkoSolar has shuffled in a range for more than a year, but now the Chinese PV stock may be attempting a breakout.
Notice how JKS closed above its November high on Monday and Tuesday. The result? A new 52-week high at a time when the S&P 500 is still 14 percent below its high.
Second, the 50-day simple moving average (SMA) recently rose above the 200-day SMA. Such a “golden cross” can potentially signify the longer-term trend is turning bullish.
Third, MACD has been steadily rising for the last three weeks.
Finally, the weekly chart above shows the big surge in September 2020 after management boosted manufacturing capacity. The stock retraced almost all the move to retest and hold its pre-pandemic high. It then proceeded to make an incrementally higher low in February and has been climbing since.
Bollinger Band Width also narrowed. This is important because dramatic moves like late 2020 often need to be digested. The tighter bands may suggest this has happened. Traders waiting for the stock to move again could start to get active.
TradeStation has, for decades, advanced the trading industry, providing access to stocks, options, futures and cryptocurrencies. See our Overview for more.
Important Information
TradeStation Securities, Inc., TradeStation Crypto, Inc., and TradeStation Technologies, Inc. are each wholly owned subsidiaries of TradeStation Group, Inc., all operating, and providing products and services, under the TradeStation brand and trademark. You Can Trade, Inc. is also a wholly owned subsidiary of TradeStation Group, Inc., operating under its own brand and trademarks. TradeStation Crypto, Inc. offers to self-directed investors and traders cryptocurrency brokerage services. It is neither licensed with the SEC or the CFTC nor is it a Member of NFA. When applying for, or purchasing, accounts, subscriptions, products, and services, it is important that you know which company you will be dealing with. Please click here for further important information explaining what this means.
This content is for informational and educational purposes only. This is not a recommendation regarding any investment or investment strategy. Any opinions expressed herein are those of the author and do not represent the views or opinions of TradeStation or any of its affiliates.
Investing involves risks. Past performance, whether actual or indicated by historical tests of strategies, is no guarantee of future performance or success. There is a possibility that you may sustain a loss equal to or greater than your entire investment regardless of which asset class you trade (equities, options, futures, or digital assets); therefore, you should not invest or risk money that you cannot afford to lose. Before trading any asset class, first read the relevant risk disclosure statements on the Important Documents page, found here: www.tradestation.com .

ENPHase W-pattern may reach 328 for wave 5 if 200 holdsENPH is the strongest component of the TAN solar ETF. Just like the biotech sector, it has started to gain ground after a long hammer candle at the week of May 9,2022. Since then it bounced with 4 consecutive green weekly candles from 165, the middle of a big trading range since 2021 (110-210).
BULLISH CASE: ENPH is now at 210 the top of the range. It may retrace back down & retest the 165 midpoint or the VWAPs before a rally to again BO the 200 to 210 red zone with 328 as the destination of its wave V. This assumes that wave IV is a running flat & the 5-wave wave V is underway. It is now at the wave 3 of a bigger wave V.
BEARISH CASE got hammered when ENPH bounce above all my VWAPs & is now attempting to breakout the 200-210 red zone.
Not trading advice

TAN (Solar) Taking off?I bought TAN etf @ $66....looks to be breaking out in a wave 3 long position. Next Stop $80.....

$AEI Begins Breakout $TSLA+Solar+SmartHomes+Crypto$AEI A Smart Home builder began its next leg up today. The company which combines $TSLA vehicles with its homes which also utilize Solar Energy, Filtration systems for water, Organic Farming and Intelligent designs has been steadily putting out updates in addition to the CEO buying millions in shares over the last few weeks.
The company is also in the crypto mining sphere and several other niche markets.
Click below to find out more about the company.
PT $10

How can you not be bullish free energy?Breakouts are coming, parabolic phase across the markets seem well setup as we are in a disbelief period. Get ready to fight inflation.

BRQS cheapest EV and 5G playBRQS Borqs is a global provider of 5G wireless solutions, Internet of Things and innovative clean energy. It operates in the U.S., India and China.
Borqs and its recently acquired subsidiary, HHE, will jointly develop EV chargers and generators which will be integrated with HHE Smart Load Panel in its solar energy + battery solution.
BRQS Market Cap 35.463Mil
52 Week Range 0.20 - 1.60
The minimum upside potential is 2-3X from here in my opinion.

$ISUN - TIME TO RUNISUN is one of the solar plays that hasn't ran yet.
Check out this breakout!
This name will be a fun play today.

TAN lookin like a significant opportunity. I believe we will be testing all time highs on TAN here as the solar industry continues to consume energy market cap and we accelerate into exponential growth in solar. Stay smart out there.

Fibo levels of TSLAFibo levels:
X=$604
AB=0.61 XA=$80
BC=0.38 AB=$23
1.6 BC=$168
0.78 XA=$195
2 BC=$268
0.88 XA=$331
2.24 BC=$359
2.6 BC=$569
1.13 XA=$1200
3.6 BC=$1925
1.27 XA=$2539
4.23 BC=$4087
1.41 XA=$5261
1.6 BC=$15771

$PPSI LONG - HV1 Highest Volume in Over a YearSolar is one of the best sector right now. I'm willing to bet on NASDAQ:PPSI .
Reason to buy:
Low market cap - under $100m
high institutional volume - +4795% few days ago
Good for long term position trading
entered below $8.00 earlier. Starting to accumulate right now. I will continue to buy more when it dip below $8.
TP: $12+
good entry: $8 below

why TATA POWER will touch 140 points??we all know EVs are the future and surgings sale numbers also confirm their acceptability in public.
and there are several segments in it like 2 wheeler, 4 wheeler, and CVs and just like that there are many companies in each segment.
But the catch is if EVs run in an economy they need infrastructure. here TATA POWER comes into the picture they are the first-mover with no other competitor.
and results are also showing good
that's why I see this stock for future growth
and in short term, it will touch 140 points hopefully.
Ibran Ansari.

NextEra Energy looks like its in need of a retracementNEE looks like a really interesting stock at the moment. Based on the quant signals it looks like its in need of a retracement before any meaningful upward move thereafter. The company appears to have a relatively strong balance sheet and provides a range of services within the renewable energy sector including power generation from wind, solar and natural gas. Could this be a stock to hold for the next 3-5 years?
Thematically lets just say that renewable/clean energy continues to be a growing industry globally. What fascinates me it how cheap and readily accessible the technology should be in the next 10 years. Someone or a group of monopolistic companies will need to lead that drive. NEE looks like it could be one of those players.
To be clear i think a short term retracement is on the cards based purely on the quant signals. Beyond that i think it could be a great company to hold in one's portfolio. For that reason my investment strategy is "Neutral" as it consider both the down and the upside over different time frames.
Please like and follow. Please also share your views on the trading ideas and whether or not you find them to be of any value to you as a trader.
Please note, this idea is shared for educational and discussion purposes only and should not result in speculative investment decisions in any asset class.

Canadian Solar - Jump back to top!-After market, this boy dropped to $38 where the strong support is located.
-Suggesting entry tomorrow at market price and holding on this boy!

🌻 SOLAR ENERGY - About to BOOM! 🌞Some posts I like to go back to and say 'Hey, I bought at a great time, i did well'
I have a feeling this will be exactly in this category in a years time. Same as it happened with Lithium for example
Looking at this chart I have a statement to make: It WILL rise and it WILL make me money. That's my opinion after i have also done research:
🌄 Fact 1 : US is about to invest heavily and compete with China
🌄 Fact 2 : There is a Global urgency to limit emissions
🌄 Fact 3 : Biden's plan is clearly to Boost this industry NOW!
🌄 &utm_content= &twclid=11414976558985617409]Fact 4 : Some of the major disadvantages have been improved. (Cost and efficiency)
🌄 Fact 5 : The Sahara can be Europe's next big investment
🌄 Fact 6: Our civilization depends on it's ability to use the Sun's energy!!!! (Google Kardashev scale )
🌅Advantages:
🔆Solar power is pollution free and causes no greenhouse gases to be emitted after installation
🔆Reduced dependence on foreign oil and fossil fuels
🔆Renewable clean power that is available every day of the year, even cloudy days produce some power
🔆Return on investment unlike paying for utility bills
🔆Virtually no maintenance as solar panels last over 30 years
🔆Creates jobs by employing solar panel manufacturers, solar installers, etc. and in turn helps the economy
🔆Excess power can be sold back to the power company if grid intertied
🔆Ability to live grid free if all power generated provides enough for the home / building
🔆Can be installed virtually anywhere; in a field to on a building
🔆Use batteries to store extra power for use at night
🔆Solar can be used to heat water, power homes and building, even power cars
🔆Safer than traditional electric current
🔆Efficiency is always improving so the same size solar that is available today will become more efficient tomorrow
🔆Aesthetics are improving making the solar more versatile compared to older models; i.e. printing, flexible, solar shingles, etc.
🔆Federal grants, tax incentives, and rebate programs are available to help with initial costs
🔆No trenching is needed since the solar can be close to or at the place of installation
To the moon? Well as a Greek. I do prefer the Sun ( Helios )
One Love,
the FXPROFESSOR 🌞🌻

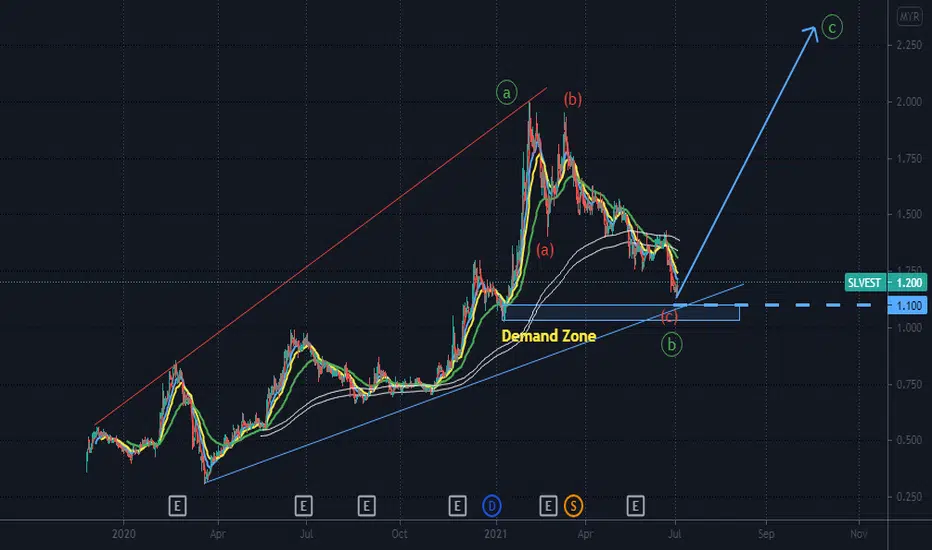
SLVEST. solar enrgy. may found support at ≈1.10. 4/July/21SolarVest Price may found its major support at around Rm 1.10 where there will be a confluence zone of 1) Next Demand Zone 2)Up Trend line Support area