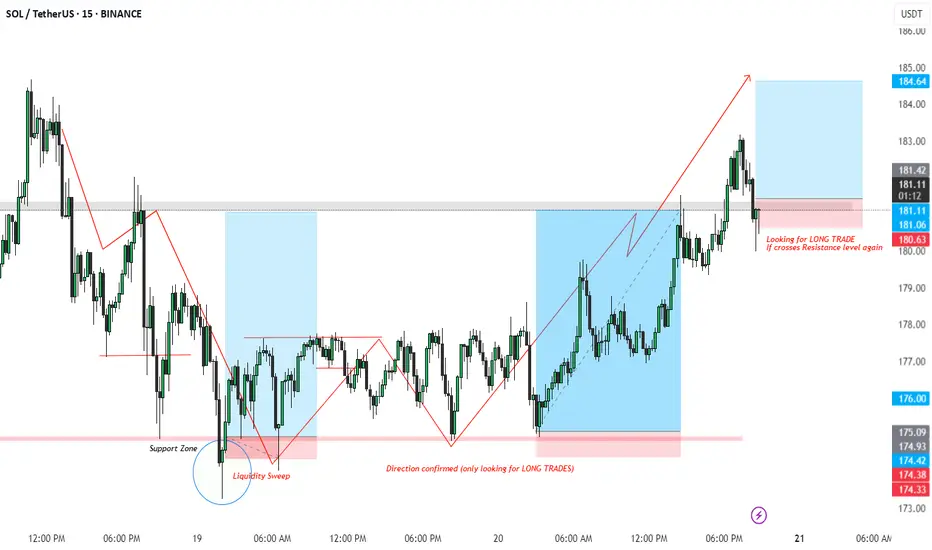
SOL/USDT LONG Setup – Liquidity Sweep + Break of Structure
Timeframe: 15m
Market Bias: Bullish (Long only)
Setup Type: Liquidity Sweep + BOS + Retest
📌 Breakdown:
Liquidity Sweep Identified:
Price dipped below the previous support zone, triggering stop hunts and grabbing liquidity.
Marked as a clear sweep of lows, signaling possible reversal.
Shift in Structure:
Following the sweep, price printed a Higher High and Higher Low, confirming change in structure.
At this point, we shift bias to Long Only trades.
Retest & Entry Zone:
After bullish momentum, price has pulled back to a key resistance-turned-support zone (highlighted in pink).
Looking for long entry on confirmation if price reclaims the resistance again (~181 zone).
📈 Trade Plan:
Entry: On reclaim and candle close above 181.00
SL: Below the recent structure low (~180.00 or dynamic based on confirmation)
TP: Previous high at 184.60 zone (approx 1:3 RR)
🧠 Trading Psychology:
Patience is key — wait for structure confirmation and avoid pre-emptive entries. The liquidity sweep setup gives us a solid probability edge when combined with market structure shift.
#SOLUSDT #CryptoTrading #SmartMoneyConcepts #LiquiditySweep #TradingSetup #BOS #MarketStructure #ReversalPattern #CryptoAnalysis #LongTradeOpportunity #PriceActionTrading #15MinSetup
Solcoin
Most see rejection. I see a launchpadWhat looks like a failed breakout is actually SOL setting up for a higher timeframe reversal, right at a refined zone of inefficiency and Smart Money interest. The narrative isn’t over — it’s just beginning.
Technical Breakdown:
Current Price: ~$143.30
Context:
Price tagged the Fair Value Gap (FVG) on the daily and showed reaction — a sign of algorithmic awareness
Volume profile suggests thin liquidity above, ripe for expansion if momentum kicks in
Key Levels:
FVG (1D) zone: just under current price (~140.19)
Order Block (OB): ultimate demand zone near 137.23 — strong structural support
Downtrend Line: recently broken, retest in motion
Major Upside Target: 168.36 — a clean liquidity magnet
Strategic Thesis:
Price dipped into FVG but held above the OB — a classic Smart Money accumulation setup
The dashed projection shows potential higher lows forming, giving fuel for a push through prior highs
FVG + OB form the discount zone, where risk/reward is maximized before the next impulse move
Execution Plan:
Entry zone: $140.00–137.50
→ Expect small shakeouts before confirmation
Invalidation: Daily close below $136 kills the bullish case
Target:
Primary: $168.36
Stretch Goal: $172–176 if momentum is sustained into August

SOL – Sweep & Spring Play at Local DemandWe’ve got a clean rounded top → breakdown → demand sweep setup.
Current price action suggests a potential reversal is brewing.
🔍 What’s happening on this chart?
Rounded top marks a local distribution — aggressive short entries
Price broke lower, swept the demand zone (gray box), and now shows rejection wick + bullish reaction
Fibonacci levels mapped out the structure
0.5 = 154.51
0.618 = 157.76 = key resistance liquidity zone
🎯 Trade idea:
Entry: inside demand zone (OB marked on chart)
Target 1: 151.25
Target 2: 157.76 (0.618)
Full fill: 162.40 – 168.30 (complete inefficiency sweep)
🧠 Mindset:
This setup is classic spring + reclaim. If price consolidates and flips 147.2, upside becomes favorable.
If you like clean trade setups with logic and clear invalidation, check the account bio for more updates and live breakdowns.

SOL Spot Long Trade Re-entry
When the price breaks below the trendline and support, retail traders typically enter short trades.

MAGA PEPE Harmonic Breakout Could Take it to a $1 Billion FDMCMAGAPEPEUSDT has broken free from a Descending Trendline now starting what could be a Bullish Dragon, this breakout has only come after what has been a successful bounce off of the confluence zone between the Linear 1.272 and Log Scale 2.618 Extensions which happen to align with the HOP level of a Bullish Gartley. If this turns out to be the Bottom we could get some similar performance that we got on the ERC-20 MAGA Coin except this time around it's an SPL coin that has much more liquidity and much clearer stats on having a fixed supply. Considering all of this I think we could target for a 100 Million Dollar Market Cap which would put it up at the 1.618 upside extension but if things get really good we may even see it challenge $1 Billion which would put it up at the 2.618 Upside Extension.

BONK2SOL: Attempting to be Supportive above the 0.618/0.236 ZoneBONK2SOL is currently trading above the log scale high to low 0.236 and the linear scale 0.618 Fibonacci Zones which happen to be confluent with one another, in addition to that the 21-Day SMA has come in at these zones and also seems to be adding a bit of support here. If BONK2SOL can hold these levels, I'd picture it as some sorta Bullish Consolidation that could eventually lead to a Breakout targeting some of the higher log scale High to Low Fibonacci levels, potentially stretching all the way up to the log scale 1.618 Extension.

#SOL Below 50 USD in Future I am also confused about what problems might arise in SOL. But the technical chart on the daily time frame is indicating that SOL will crash in the coming time and could go below $50. I would be happy in the future if my analysis proves wrong. But if you are long in SOL futures or margin, you should definitely reconsider this once.
SAFE TRADING.. SOL IS NOT SAFU..

SOL will it hold?Solana is near an important support level, would be perfect if could jump off from it.
GOOD LUCK!

SOL USDT HAVE IT, WITHOUT FAILit seems there is no target for SOL. it's broken every resistance supper easy. I don't know any thing about FA of it. who knows? please clue me in.
anyhow, some thing is so clear, each resistance lines becomes supportive area, super easy.
pattern= FLAG

SOL / BTC 4HF Techincal analysisSOL / BTC
🌟 4H frame technical analysis 🌟
Form flag pattern
EMA 100 act as support
EMA 200 act as resistance
If ema 100 hold then we are going to restest ema 200 again
We can also see below in RSI potential hidden bullish div start in formation
Safest area to enter is after break local resistance and also break above 200 EMA
If that happens we can expect a nice jump in SOL
Good luck and happy trading 🌹
Support us by like and subscribe
Show your opinion below

Sol/btc breakout soon ?
Bullish pattern
As long as sol is holding above local support 21600sat-18600sat
We can see nice move to 27000-31000 level next resistance
**Buy the break
