SOLUSD

SOL/USDThello friends
Due to the price drop and the new bottom, now we have two scenarios:
1_ According to its downward trend, the price hits the resistance range and hits a new bottom.
2- The price succeeds in breaking the resistance range and our trend becomes upward.
In our opinion, scenario 1 is more tolerant.
*Trade safely with us*

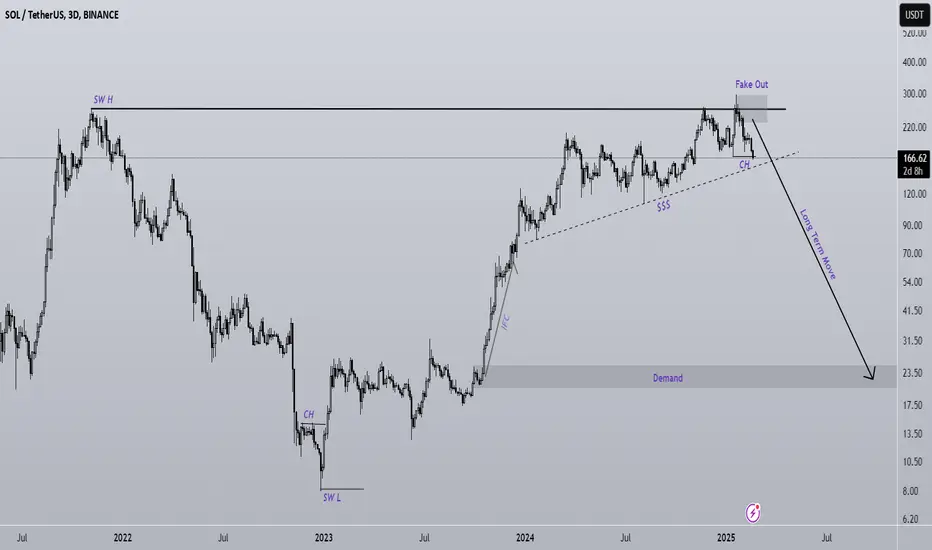
The bearish superwave of SOL has begun (3D)It seems that the The bearish superwave of SOL has begun.
A large liquidity pool has formed below the price, which is likely to break soon.
The all-time high has been broken falsely. This could lead to heavy drops in the weekly timeframe.
In the mid-term and long-term, Solana appears bearish.
Do not enter the position without capital management and stop setting
Comment if you have any questions
thank you
How do i get access to chat? Here's a chart for SOLUSDTrying to get chat access. Here's a chart to show buying opportunity that I see for weekly SOLUSD chart. We're currently entering a long term support channel for SOLUSD, about 120-160. imo, it's a good channel to buy if you are bullish this year.

SOLUSD: Libra crash is a buy in disguiseSolana is suffering heavy losses these past few days due to the prevailing news regarding Libra and has turned oversold on its 1D technical outlook (RSI = 30.523, MACD = -8.449, ADX = 53.479). Since the long term pattern is a Channel Up and the price is headed for its bottom, while the 1D RSI is at 30.000, which has been a buy signal for over 1 year, this is technically a buy opporutnity in disguise. The similar buy signal of June 23rd targeted the R1 level at the top of the corrective Channel. Go long, TP = 260.00.
## If you like our free content follow our profile to get more daily ideas. ##
## Comments and likes are greatly appreciated. ##

Solana: Poised for a Breakout Towards a New All-Time HighSolana (SOL) is currently trading at the expanding channel support level of $163.69, a critical demand zone that presents a strategic entry point for long positions. A successful rebound from this level could drive the price toward the initial resistance at $206.38.
If SOL manages to break above and sustain momentum beyond this minor resistance, it could confirm a bullish continuation, targeting the expanding channel resistance. A breakout at this level would pave the way for a potential rally towards a new all-time high at $327.32.
However, if SOL fails to hold the expanding channel support and experiences a breakdown, selling pressure may intensify, pushing the price toward the major support level at $124.29. This level could serve as a crucial re-entry point for buyback opportunities.
Fundamental analysis :
On March 1, 2025, approximately 11.2 million SOL tokens—equivalent to 2.29% of the total supply—are scheduled to be unlocked. This event could introduce significant downward pressure on SOL's price, potentially triggering a bearish movement as market participants anticipate increased sell-side liquidity.

SOL Retesting the Descending ChannelBINANCE:SOLUSDT drops back to retest the descending channel.
The last two times it touched this level, it held and bounced up.
Let’s see if it can hold again this time—if not, it might drop to $146.
From the last two experience of bouncing back, we might know if it can hold this key support within a week.
🔴 Read my signature & publications for more info you don’t want to miss.
🔥 for more future "guesses" like this!

SOL/USDT – Critical Reversal or Major Breakdown?🚀 Key Market Insight:
Solana ( BINANCE:SOLUSDT ) is testing a high-stakes demand zone at $156-$162, aligning with major trendline support and previous liquidity grabs. This level will dictate the next big move—a strong bounce could fuel a rally, while a breakdown may trigger a deeper correction.
🛑 Key Levels to Watch:
✅ Support Zone: $156-$162 – Holding above = potential reversal.
🚨 Break Below $154: Could lead to $145-$135 and lower targets.
⚡ Resistance to Reclaim: $182, $195, $204, $212, and $219.
🧠 What to Look For:
🔹 Bullish Signal: Price reclaims $170+ with strong volume → Higher targets unlocked.
🔹 Bearish Signal: Price fails to hold $154 → Expect deeper downside.
🔹 Liquidity Trap? Smart money may hunt stop-losses before a reversal— watch for fakeouts .

Breaking News - SOL MartyBoots here , I have been trading for 17 years and sharing my thoughts on SOL here.
SOL looks bad overall and this news may make SOL drop more
Do not miss out on SOL as this can affect the entire market
Watch video for more details

Sol short/Bearish!Here is another idea for the sol, it is falling from the pattern with double top on 1D time frame. Let's see how it goes.
Bounce zones are marked on previous idea!

Sol turning bearish!Sol swept the highs but failed (which was a short signal). Marked zones are the bounce levels, first zone has been tapped already with bounce, now it is showing weakness in the zone, next zones are untapped, so a bounce at marked levels is highly likely, however if first zone breaks, I will look for swing short.
In short, marked zones are good for long, if broken, we can look for short at the bounce.

Time to buy Solanahello friends
Well, I must say that it is very difficult to predict the route, but we can buy step by step.
Here, the price has fallen, and now it is on an important support. If the support is broken, we can buy lower support with capital management and move forward with it.
*Trade safely with us*

SOL emerging head & shoulder providing opportunitiesBYBIT:SOLUSDT has an emerging H&S structure that is providing opportunities described below, which can be utilised based on risk appetite and preference for a swing trade or investment.
Note: The overall chart structure at the moment is highly complex and pattern failure risks, such as that experienced with BYBIT:XRPUSDT remains very high.
Scenario
An H&S structure has emerged since 23 Dec 2024. Neckline support has been confirmed 3 times around: 11 Jan, 07 Feb and 12 Feb. The price is still close to the neckline providing opportunity for entry into trades and/or investment.
DCA entry into a longer term investment - recommended approach
Allocate a percentage of your portfolio's available fund to this as an asset to hold, decide upon how many months or weeks you would like to DCA into the total position (I recommend no less that 3 months and no more than 6) and begin DCA. This approach will safeguard against mistiming the start of the DCA now before the beginning of a bearish cycle, finally ending at an as yet unknown lower support level (of 4 potential candidate price levels stated further down the text below).
The case for beginning the investment approach now
The project remains solid and has established itself as a competitor to ETH. Furthermore, it is the layer 1 of choice for memecoins and has had more new projects use it that ETH recently. Additionally, overall positive market sentiment remains as do utterance (although no formal new policies of note) of the Trump administration and financial institutions towards crypto. Finally, the large gyrations in price recently are making it more difficult to judge appropriate SL levels thereby making trading of any kind less attractive at the moment.
The case against beginning the investment approach now
The future of the project, like most projects is still unknown (crypto is the most volatile and riskiest of assets for a reason!). Although the industry is maturing, it is possible a newer project can come and usurp the place of SOL. There are further support levels (130, 90, 55, 20) that can provide better DCA entry levels, and as market sentiment can change on an utterance of Musk or Trump, patience for a better entry point caused by further bearish moves might be wiser, particularly as on the weekly chart, SOL appears to be printing it's 2nd consecutive doji - implying market indecisiveness and no clear indication that the bulls are about to become incharge again. SOL has also double topped (mid Nov 24 and mid Jan 25), near the ATH (250), indicating either upcoming bearish sentiment or another uncertain attempt at breaking the ATH.
Swing trade
Entry: 200
TP:280 - near the absolute top of the head
SL: 160 - past the dragonfly candle of 13 Jan (this candle has the risk of indicating a new support leval and all traders must be wary of the 160-150 level as that was the support level in mid Oct 24 Additionally, 170 is also near the 200 EMA and crypto daily price gyrations are sometimes very large; therefore a daily low of a dragonfly and a EMA has the potential of being a support level that should be accounted for when setting a SL )
R/R: 1:2
The case for the swing trade
The rate of change indicated is trending upwards. The neckline has proven to be a support level and has been validated 3 times.
The against a swing trade
Other technical indicators like the RSI (middling with little upwards trend) and MACD (likewise) do not provide strong positive support for the trade thesis. Having found support at the 200 EMA and broken out of the downward trend since 20 Jan, there is a possibility that the price will just range between the 50 EMA and 200 EMA (approx. 210 and 180) unless there is further external, fundamental cause for upwards momentum. Previous momentum was driven largely by the optimistic market sentiment for crypto following on from Trump's election win. Finally, a R:R of 1:2 is generally not considered worthy of such a speculative trade.
Note: There is very little justification for a margin trade at the moment - the dragonfly candle on 03 Feb carries too much risk and invalidates a margin trade theses' risk/reward ratios. Margin trading this pair is best left to when a pattern emerges that is not part of a structure that includes the 03 Feb candlestick.

SOL/USDT 1H: Bullish Breakout Holding – $210 in Sight?!SOL/USDT 1H: Bullish Breakout Holding – $210 in Sight?
🚀 Follow me on TradingView if you respect our charts! 📈 Daily updates!
Market Structure & Momentum:
Bullish momentum intact with a clear pattern of higher lows and higher highs.
Current Price: $203.28, confirming a strong breakout above $202 resistance.
RSI at 69.43, nearing overbought territory but still showing strength.
Pattern: Inverse Head & Shoulders completed, with neckline at $198 confirming breakout.
Trade Setup (Confidence 8/10):
Entry Zone: $201 - $202 (on slight pullback).
Targets:
T1: $206 (short-term resistance).
T2: $210 (key level from previous structure).
Stop Loss: Below $198 (recent support level).
Risk Score:
7/10 – Strong bullish setup, but overbought RSI warrants caution on aggressive entries.
Smart Money Analysis:
Institutional accumulation evident around $196-$198, indicating strong buying interest.
Volume profile confirms heavy Smart Money involvement, supporting continuation.
No significant bearish divergences visible, keeping the uptrend intact.
A minor pullback could offer a better long entry before continuation.
Recommendation:
Long positions favorable on pullback to $201-$202 for better risk-reward.
Avoid chasing entries at current levels—wait for slight retracement.
Monitor price action near $206—strong breakout there confirms a push toward $210.
Confidence Level:
8/10 – Trend is bullish, but RSI suggests waiting for optimal entry.
🚀 Follow me on TradingView if you respect our charts! 📈 Daily updates!

$SOL looking to break out on the daily!CRYPTOCAP:SOL looking to break out on the daily! Measured move 280.00. BTC.D looking to roll over good for Alt Coins. Want to see BTC hold about 96,200 to remain overall market strength. A lot of hype about SEC acknowledging SOL, XRP, DOGE and ADA ETF’s could be a great catalyst.

SOL/USD LONG SET UPTitle: BUY SOL/USD LONG
Order Type: MARKET BUY
Time Frame: 1D
entry 1- 200.50
entry 2- 180.50
stop loss 160.50
take profit 1 $220.50
take profit 2- $240.50
take profit 3- $260.50
take profit 4- $280.50

SolusdcSOL/USDC has successfully broken out of its downward trend and is now showing strong bullish momentum. With this breakout, we anticipate further upward movement, making it an ideal opportunity for buyers.
🔹 Entry: 195
🔹 Target 1: 205
🔹 Target 2: 217
🔹 Stop Loss: 187
A sustained move above the entry level could signal further gains, while the stop loss is strategically placed to manage risk. Trade with proper risk management and follow market movements closely

SOL buy setup 12H TFSolana has not yet formed a bearish structure on higher timeframes. There is a support zone on the chart from which the price may bounce upward.
The targets are marked on the chart.
A daily candle closing below the invalidation level will invalidate this analysis.
Do not enter the position without capital management and stop setting
Comment if you have any questions
thank you

Swing trade in 4H
Daily MACD is still deep in the bear zone and Solana hasn't even claimed the the previous week high. Therefore, the overall sentiment for Solana is still bearish to me, however, in the 4H chart, I can see some bullish momentum is building up and a potential swing opportunity might be coming up soon. The things I am seeing for a potential swing trade are as follows:
1) The price broke and closed above the descending treandline and now the price is consolidating (not dropping) in the range bound in the Fib 0.236 region.
2). When the price tries to move to the upside, the first barrier that it has to break is Fib 0.236. It doesn't guarantee it is the start of the bull, but it is the early sign of the bullish momentum. If the momentum is weak, the price starts to retrace to the downside when it hits 0.382 and 0.5. So, I need to wait and see the sideway consolidation ends and the price moves decisively (without a long top wick) above $203.
3) MACD needs to be properly crossed, point to the upside and enter the bull zone.
As I said, daily MACD is still in the bear zone. Therefore, 4H chart provides a good trade set up for a long, the upside momentum might be still limited to the Fib 0.5 -0.618 area. Therefore, if I open a long position based on 4H chart, I will be very cautious with position size and profit target.

ADA - JUST ANOTHER DASHI'm a firm believer in Cardano and I will keep stacking it up for my retirement... but this cycle is over folks.
I don't like fractals but the results of overlaying DASH onto ADA's chart speak for themselves. The similarities these two share are kind of mind blowing. Two ingenious, open, freedom preserving projects who have robust and loyal communities end up getting beat out by venture capitalists.
Fight the good fight guys, use your voice, your wallet, and your vote to make Cardano the best it can be. Work together to solve problems and avoid the drama. Cardano will absolutely conquer next cycle.

Solana With Another Clear Long Signal Given!Trading Fam,
Not too much to say here other than the fact that my indicator has recently given us another very clear buy signal inside our liquidity block after hitting support. This alone is all we needed for entry but if you're not familiar with how accurate my indicator has been for us on these larger cap/large volume tokens, then you can see below we also have plenty of confirmation from the Heiken-Ashi, RSI, and MACD. Here we go!
✌️ Stew

Breaking: Solana Reclaims $200 MarkIn a surprising turn of events, Solana (SOL) has surged past the $200 resistance level, defying the broader crypto market's cooling trend. While Bitcoin (BTC) dipped to the $95,000 support level and the Crypto Fear & Greed Index slumped to 35—indicating a fearful market—Solana has emerged as a standout performer.
Why Solana Stands Out
Solana, launched in March 2020 by the Solana Foundation, has quickly risen to prominence as a high-performance blockchain platform. Designed to facilitate decentralized application (DApp) development, Solana combines proof-of-history (PoH) with proof-of-stake (PoS) to achieve unparalleled scalability and speed. This hybrid consensus model allows Solana to process thousands of transactions per second (TPS) at a fraction of the cost of competitors like Ethereum.
Key Fundamentals Driving SOL's Growth:
1. Decentralized Finance (DeFi) Accessibility: Solana's focus on making DeFi accessible to a broader audience has attracted both retail and institutional investors.
2. Institutional Interest: Solana's ability to handle high-volume transactions without compromising decentralization positions it as a viable long-term player in the blockchain space.
3. Ecosystem Growth: The Solana ecosystem continues to expand, with projects ranging from decentralized exchanges (DEXs) like Serum to NFT marketplaces and gaming platforms.
Technical Analysis
As of the time of writing, Solana is trading at $205, up 2.29% in the last 24 hours.
Key Technical Indicators:
1. Relative Strength Index (RSI): SOL's RSI is currently at 45, indicating a neutral to slightly bearish sentiment. While this suggests the potential for a trend reversal, the recent candlestick patterns hint at a possible bullish surge.
2. Candlestick Patterns: The recent closing prices and candlestick formations suggest a bullish momentum. If this trend continues, CRYPTOCAP:SOL could target the $248 resistance level, which aligns with the 38.2% Fibonacci retracement level.
3. Support and Resistance Levels: The $200 level has now flipped from resistance to support, providing a strong foundation for further upward movement. However, a slight downtick could see CRYPTOCAP:SOL retesting its 1-month low, serving as a cooling-off zone before another potential rally.
4. Volume and Liquidity: With a 24-hour trading volume of nearly $4 billion, Solana is experiencing significant liquidity. This high volume indicates strong market participation, which is often a precursor to sustained price movements.
The Road Ahead: Bullish or Bearish?
While Solana's recent performance is impressive, the crypto market remains highly volatile. Here are the key factors to watch:
Bullish Case:
- If SOL maintains its momentum and breaks above the $210 resistance, it could target the $248 level, representing a 20% upside from current prices.
- Continued ecosystem growth and institutional adoption could drive long-term demand for SOL, pushing it to new all-time highs.
Bearish Risks:
- A failure to hold the $200 support level could lead to a retracement to the 1-month low, potentially cooling off recent gains.
- Broader market conditions, including Bitcoin's performance, could impact SOL's trajectory. If BTC experiences further downside, it could drag SOL along with it.
Conclusion
As the "Ethereum killer," Solana continues to prove its worth in the blockchain space. Keep an eye on this altcoin—it may just be getting started.

The key is whether the price can be maintained above 202.45
Hello, traders.
If you "Follow", you can always get new information quickly.
Please also click "Boost".
Have a nice day today.
-------------------------------------
(SOLUSDT 1M chart)
In order to turn into a downtrend, it is expected to start by falling below 147.74.
Since the BW(100) indicator was formed at 231.77, the point to watch is whether it can rise above this point.
-
(1W chart)
The key is whether it can receive support near 202.45.
-
(1D chart)
The key is whether it can receive support near 194.46, the HA-Low indicator point, and rise above 202.45.
-
The charts that do not display support and resistance points and the charts that do are displayed are displayed separately for each time frame chart.
The basic chart for trading is the 1D chart.
Therefore, if you want to trade by looking at charts below 1D charts, it is recommended to mark at least the support and resistance points of the 1D chart.
As traders, the reason we analyze charts is to trade.
Therefore, chart analysis is to select key support and resistance points.
Therefore, you must select key support and resistance points in any way.
-
Thank you for reading to the end.
I hope you have a successful trade.
--------------------------------------------------
- Big picture
I used TradingView's INDEX chart to check the entire range of BTC.
(BTCUSD 12M chart)
Looking at the big picture, it seems to have been maintaining an upward trend following a pattern since 2015.
In other words, it is a pattern that maintains a 3-year upward trend and faces a 1-year downward trend.
Accordingly, it is expected that the upward trend will continue until 2025.
-
(LOG chart)
Looking at the LOG chart, you can see that the upward trend is decreasing.
Accordingly, the 46K-48K range is expected to be a very important support and resistance range from a long-term perspective.
Therefore, we expect that we will not see prices below 44K-48K in the future.
-
The Fibonacci ratio on the left is the Fibonacci ratio of the uptrend that started in 2015.
In other words, it is the Fibonacci ratio of the first wave of the uptrend.
The Fibonacci ratio on the right is the Fibonacci ratio of the uptrend that started in 2019.
Therefore, it is expected that this Fibonacci ratio will be used until 2026.
-
No matter what anyone says, the chart has already been created and is already moving.
How to view and respond to this is up to you.
When the ATH is updated, there are no support and resistance points, so the Fibonacci ratio can be used appropriately.
However, although the Fibonacci ratio is useful for chart analysis, it is ambiguous when used as support and resistance.
This is because the user must directly select the important selection points required to create Fibonacci.
Therefore, since it is expressed differently depending on how the user specifies the selection points, it can be useful for chart analysis, but it can be seen as ambiguous when used for trading strategies.
1st : 44234.54
2nd : 61383.23
3rd : 89126.41
101875.70-106275.10 (Overshooting)
4th : 134018.28
151166.97-157451.83 (Overshooting)
5th : 178910.15
-----------------
