SOLUSD- Has a long-term sport between 155 and 158Technical Analysis by AI
💵 Current Price & Market Context
• SOL trading around $158–$160, down about 2–3% today, still down ~14% from last week’s top near $180+.
🧭 Trend & Momentum
• RSI near 41–47 → not oversold but on the lower side.
• MACD still leaning bearish. Momentum: neutral to slightly bullish across indicators.
🛠️ Support & Resistance
• Immediate support at $160, stronger support at $154.
• Resistance at $172–$176, bigger barrier around $180–$190.
📈 Pattern Behavior
• Still holding an ascending channel, currently sitting near the lower band.
• Failed breakout at $180–$190 means that’s a hard ceiling unless broader market turns bullish.
⸻
✅ Trade Thoughts Based on This
Aspect
Bias Neutral to bearish short-term
Entry Zone Valid? Yes, $156–158 is still solid
Key Level to Watch
$154 — if breaks, downside likely
Upside Potential Target $172–176 short term
Breakout Ceiling $180+ tough without volume/sentiment
⸻
🧭 What You Should Do Now
• You’re in near $156–158 → good spot as long as $154 holds
• If price dips to $154 and bounces: still valid
• If breaks $154: prepare to cut, next support is ~$145
• If price moves above $170: momentum could take it to $176+
• Don’t chase anything. Wait for volume or bounce from support
SOLUSD

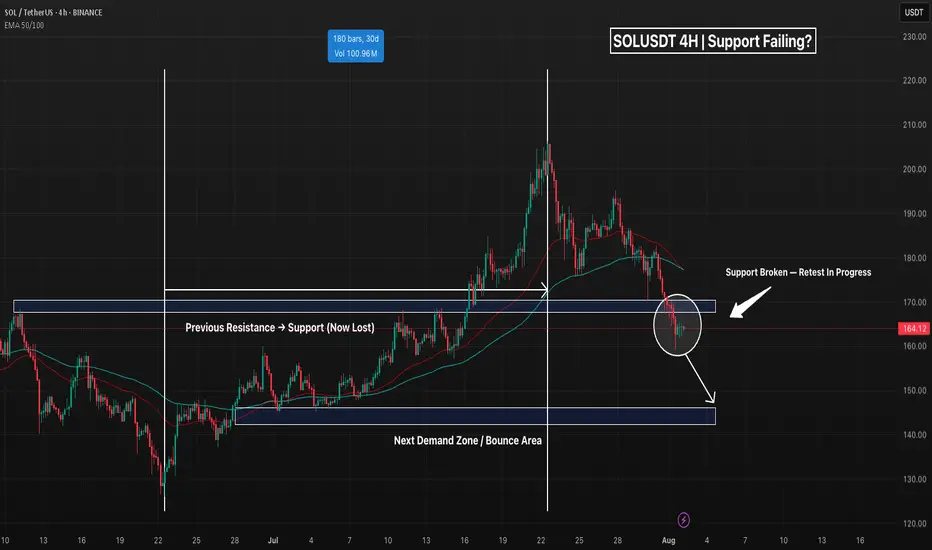
SOL - Support Broke, Is This Just a Retest Before The Pump?Solana just lost a key structural level on the 4H chart — the former range high (~163–166), which had acted as resistance throughout June and flipped to support in mid-July. Price is now sitting just below this zone, forming a weak retest without any real bullish momentum.
This setup often leads to trap scenarios: either a fast reclaim (bullish deviation) or a clean continuation to the next demand. So far, the price is holding below the EMAs and failing to reclaim lost ground — not a bullish look.
📌 Confluence for Further Downside:
Break and close below prior support
EMA 50/100 acting as dynamic resistance
No bullish divergence present (if RSI confirms)
Weak volume on current bounce attempt
If sellers stay in control, eyes are on the next demand zone around 144–146, which supported the last major breakout. Conversely, a clean reclaim above 166 and back inside the range would flip bias neutral-to-bullish.
Bias: Bearish unless 166 is reclaimed
Invalidation: Break above 177–180 (EMA cluster)
Next Key Support: 144–146
Potential Setup: Short on failed retest / Long on demand reaction
Do you see this as a breakdown or a trap? Let me know 👇
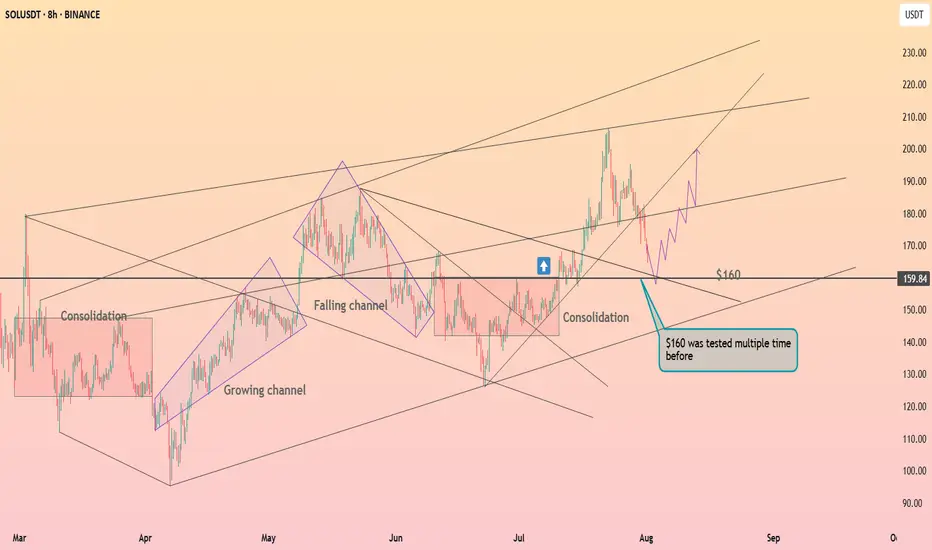
Solana above the $160 level ┆ HolderStatBINANCE:SOLUSDT is retracing toward the $160 support after failing to hold above $190. Price previously broke out from a falling channel and may find support at $160 again, where multiple reversals have occurred. A bounce here could fuel a move to $200.
SOLANA BULLISH MEGAPHONE PATTERN LOADING! solana continues to move step by step towards higher levels within the bullish megaphone pattern, which will make movements towards ATH and more inevitable in the coming period

DeGRAM | SOLUSD will test the support level📊 Technical Analysis
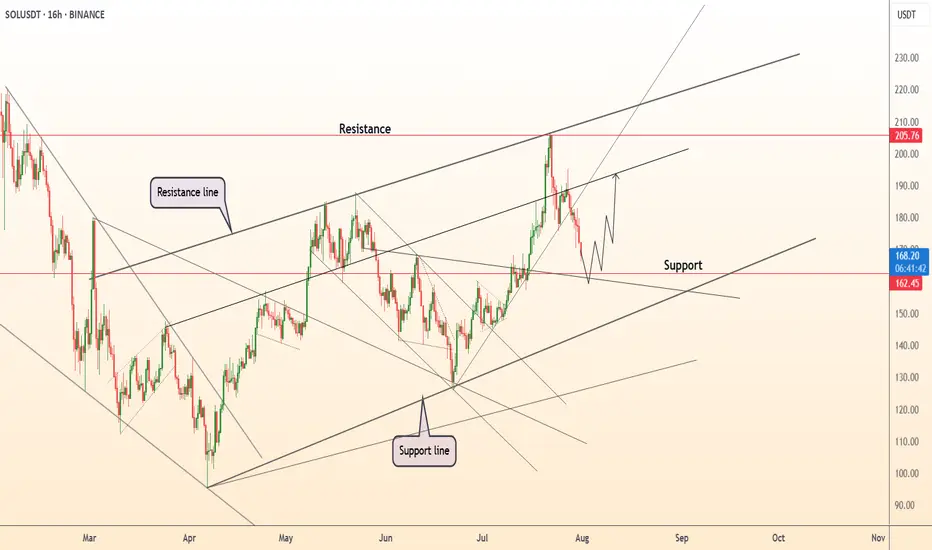
● SOLUSD is pulling back after testing the upper resistance channel near 205 and is now approaching key support at 162.5, aligning with the breakout zone.
● Structure remains bullish as price respects the midline of the ascending channel, and upside continuation toward 205 remains likely if 162 holds.
💡 Fundamental Analysis
● Solana remains a top performer in weekly ETP inflows, per CoinShares, and continues to dominate in NFT volume and developer activity.
● Funding remains positive across major derivatives platforms, signaling sustained bullish sentiment despite short-term volatility.
✨ Summary
Long bias above 162. Breakout target remains 205 ▶ 220. Setup remains valid while above key structure support.
-------------------
Share your opinion in the comments and support the idea with a like. Thanks for your support!
Very Bullish!!
Solana chart looks very bullish. The price is currently dropping but I think it is a very healthy correction.
Weekly chart:
1) all momentum indicators just entered the bull zone.
2) The chart is forming higher highs.
Daily:
1) EMA55 finally crossed EMA200. The last time they crossed was October 2023 (see red vertical line in the chart) and it was the beginning of the macro bull trend.
2) Momentum indicators have reached overbought territory and crossed to the downside, however, given weekly momentum indicators have just entered the bull zone, this move is likely to be corrective action.
3) When EMA55 and EMA200 cross, the price often retraces initially to EMAs (21, 55 or 200). Once it completes the pull back, I anticipate the price to move to the previous ATH and beyond.
This is the time when high leverage trading volume increases.
Be careful not get wicked out. Focus on monthly/weekly/daily charts and ignore the noise in the lower timeframes.

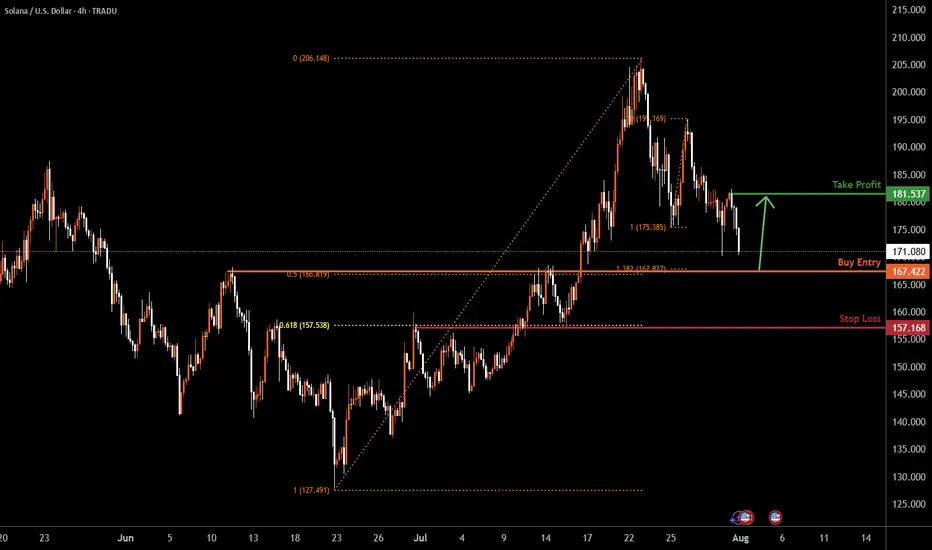
SOLUSD H4 | Bullish bounceBased on the H4 chart analysis, the price could fall to the buy entry, which acts as a pullback support that aligns with the 50% Fibonacci retracement and the 138.2% Fibonacci extension and could bounce to the upside.
Buy entry is at 167.42, which is a pullback support that aligns with the 50% Fibonacci retracement and the 138.2% Fibonacci extension.
Stop loss is at 157.16, which is an overlap support that aligns with the 61.8% Fibonacci retracement.
Take profit is at 181.53, which is a pullback resistance.
High Risk Investment Warning
Trading Forex/CFDs on margin carries a high level of risk and may not be suitable for all investors. Leverage can work against you.
Stratos Markets Limited (tradu.com ):
CFDs are complex instruments and come with a high risk of losing money rapidly due to leverage. 65% of retail investor accounts lose money when trading CFDs with this provider. You should consider whether you understand how CFDs work and whether you can afford to take the high risk of losing your money.
Stratos Europe Ltd (tradu.com ):
CFDs are complex instruments and come with a high risk of losing money rapidly due to leverage. 66% of retail investor accounts lose money when trading CFDs with this provider. You should consider whether you understand how CFDs work and whether you can afford to take the high risk of losing your money.
Stratos Global LLC (tradu.com ):
Losses can exceed deposits.
Please be advised that the information presented on TradingView is provided to Tradu (‘Company’, ‘we’) by a third-party provider (‘TFA Global Pte Ltd’). Please be reminded that you are solely responsible for the trading decisions on your account. There is a very high degree of risk involved in trading. Any information and/or content is intended entirely for research, educational and informational purposes only and does not constitute investment or consultation advice or investment strategy. The information is not tailored to the investment needs of any specific person and therefore does not involve a consideration of any of the investment objectives, financial situation or needs of any viewer that may receive it. Kindly also note that past performance is not a reliable indicator of future results. Actual results may differ materially from those anticipated in forward-looking or past performance statements. We assume no liability as to the accuracy or completeness of any of the information and/or content provided herein and the Company cannot be held responsible for any omission, mistake nor for any loss or damage including without limitation to any loss of profit which may arise from reliance on any information supplied by TFA Global Pte Ltd.
The speaker(s) is neither an employee, agent nor representative of Tradu and is therefore acting independently. The opinions given are their own, constitute general market commentary, and do not constitute the opinion or advice of Tradu or any form of personal or investment advice. Tradu neither endorses nor guarantees offerings of third-party speakers, nor is Tradu responsible for the content, veracity or opinions of third-party speakers, presenters or participants.
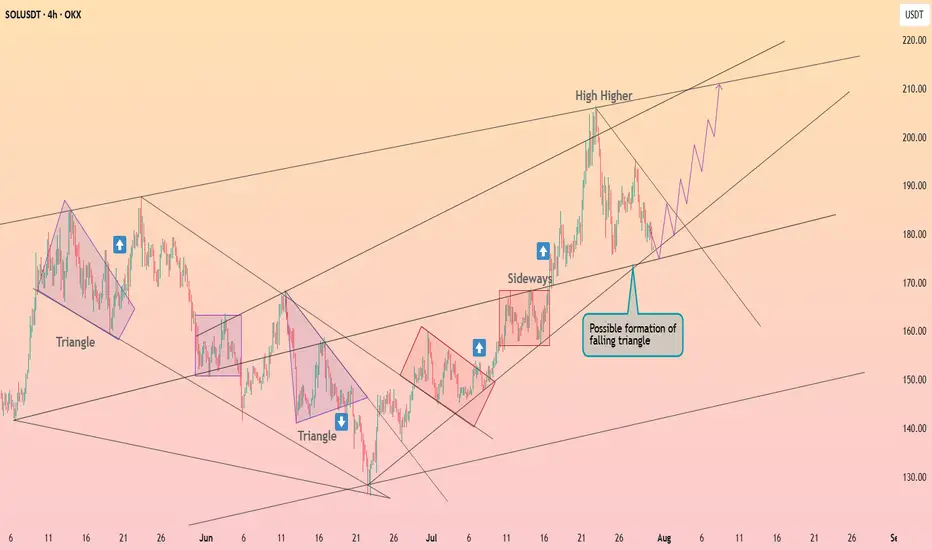
Solana is forming the falling triangle ┆ HolderStatOKX:SOLUSDT is compressing into a possible falling triangle, with support around 180–185 and upward projections pointing toward 210+. The chart has repeatedly shown triangle breakouts into strong rallies. As long as the lower trendline holds, the upside setup remains valid.
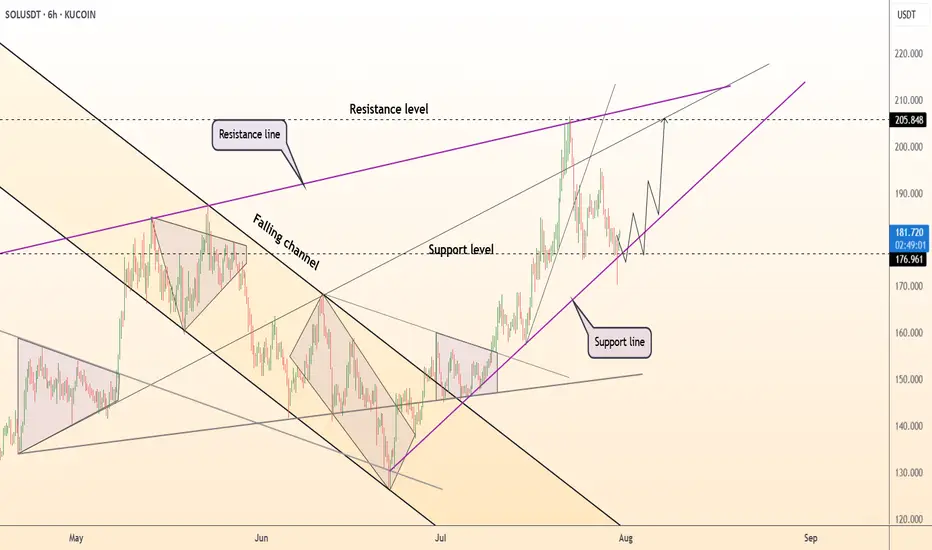
DeGRAM | SOLUSD is holding the $177 level📊 Technical Analysis
● SOLUSD is bouncing from the rising trendline support at 177 after a retracement, maintaining structure within a bullish ascending wedge.
● Price holds above the prior resistance-turned-support near 176.9, with a clear path to retest the 205.8 and 219–222 confluence zone.
💡 Fundamental Analysis
● Solana's 30-day DApp volume ranks top 3 among L1s, signaling increased utility. Institutional SOL inflows also continued for a fifth week, per CoinShares.
● Strong user metrics and positive funding rates suggest bullish momentum remains supported on-chain and through derivatives markets.
✨ Summary
Buy dips above 177. Targets at 205 ▶ 220. Long setup holds while price stays above 175.
-------------------
Share your opinion in the comments and support the idea with a like. Thanks for your support!
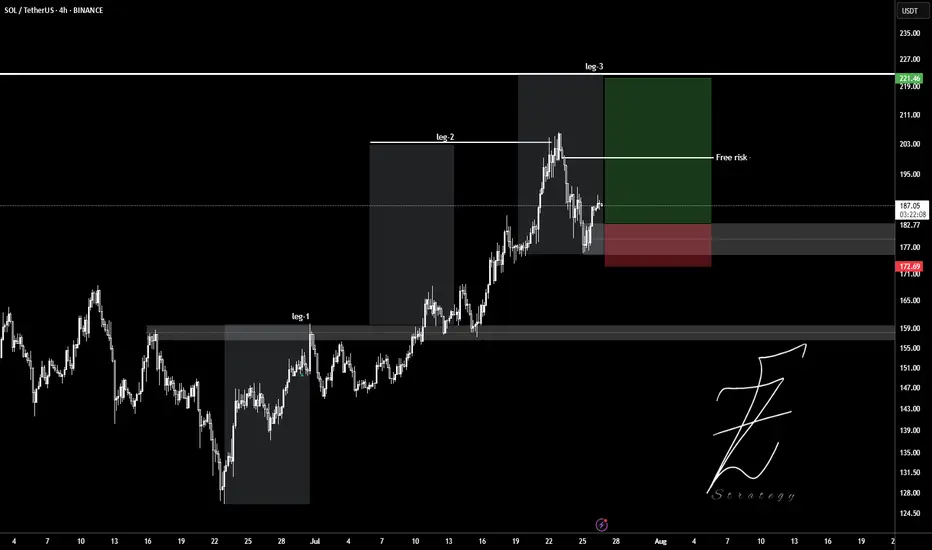
SOLUSDTWait for pollback to 180$ level and ready to get buy position.
Target set in leg2 and leg3.
Entry: 182
Stop: 177
Tp: 190 - 200 - 210 - 220
Please control Risk management.
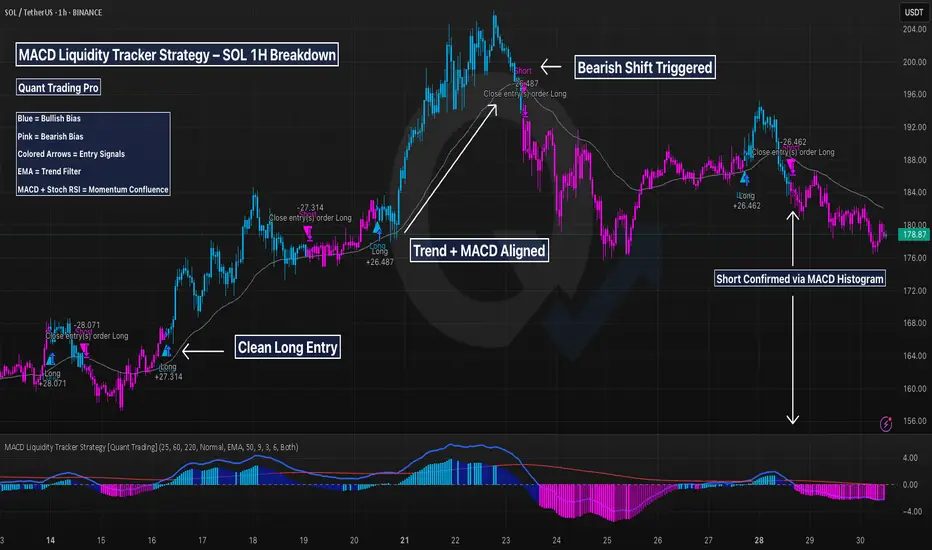
SOL 1H – How This MACD Strategy Filters Noise & Times SwingsThis chart showcases the MACD Liquidity Tracker Strategy applied to Solana’s 1H timeframe — designed to help traders capture clean trend moves while avoiding noisy whipsaws.
The system combines:
✅ MACD momentum filtering (25 / 60 / 220)
✅ 9 & 50-period moving average confirmation
✅ Stoch RSI confluence
✅ State memory logic to reduce false flips
🔍 Strategy Breakdown:
Entry Conditions:
Buys trigger when MACD histogram shifts bullish, the trend filter confirms, and momentum aligns with Stoch RSI. Shorts trigger on the inverse.
Visual Context:
Blue candles = Bullish state
Pink candles = Bearish state
Gray line = Confirmation filter (EMA)
Performance Example:
Caught two major long legs: +27.31 and +26.46
Avoided most chop through clear color-shifting logic
Recent short called the local top with MACD + trend confluence
📌 Why It Works:
The strategy focuses on structure first, signal second — letting trend context and MACD compression guide entries. Unlike traditional crossovers, this approach uses liquidity-aware thresholds to reduce noise and keep traders in the right trend longer.
🧠 Ideal For:
Swing traders on LTFs (15m–4H)
Crypto traders wanting cleaner confirmation
Anyone backtesting with QuantTradingPro or building a trend-following system
This chart shows how combining indicators into a rules-based system can help you trade with clarity — not emotion.
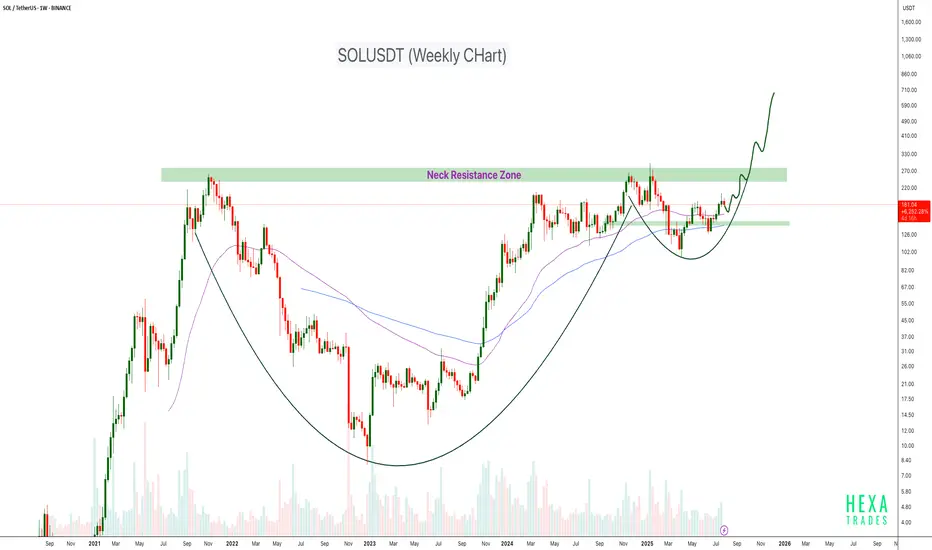
SOLUSDT Cup & Handle Formation CRYPTOCAP:SOL is forming a large Cup and Handle pattern on the weekly timeframe, a classic bullish continuation structure. Price is currently approaching the neckline resistance zone around the $250–$280 level. This area has acted as a major barrier in the past, rejecting the price multiple times, but the structure suggests it's now being retested with greater momentum.
If the neckline breaks cleanly with strong volume, the projected target could push SOL into the $600–$700+ range over the coming months.
Cheers
Hexa
BINANCE:SOLUSDT COINBASE:SOLUSD
Solana maintains its upward structure ┆ HolderStatBINANCE:SOLUSDT is bouncing from the $170–172 zone, building higher lows just below resistance at $180. The structure is shaping into a rounded bottom with signs of accumulation. If SOL clears $180 with volume, targets lie at $188 and beyond. Trend remains bullish as long as price stays above the local demand zone.

SOLUSD 4H — Holding the Line Before Altseason?Solana’s 4H chart presents a textbook continuation setup — a steady ascending trendline combined with well-defined resistance zones stacked overhead. This kind of compression within an uptrend often precedes explosive expansion, especially when aligned with broader altcoin market sentiment.
📊 Structural Breakdown:
Trendline Support:
Sol has maintained a rising trendline since early June, consistently bouncing off higher lows. This provides a dynamic support zone currently sitting around ~$175–180.
Horizontal Support:
The horizontal box at ~$175 represents prior structure highs turned into support — tested multiple times and aligning with the trendline. A breakdown here would be structurally significant.
Resistance Layers to Monitor:
$215 – Minor S/R flip and local liquidity cluster
$245 – Consolidation ceiling from Q1, where sellers previously took control
$270 – Clean weekly-level rejection from January
$300–310 – Final major resistance from the post-FTX crash range; breakout here signals full bullish expansion
Market Context:
The broader altcoin market is coiling, with majors like ETH and SOL holding structure while BTC ranges. If Bitcoin remains sideways or breaks slightly higher, capital rotation could drive a full “altseason” wave — with SOL as one of the first movers.
🔍 Key Conditions to Watch:
✅ Bullish Scenario:
Price holds ~$175 and breaks above $215 with strong volume
Clean retest of breakout zones confirms continuation
Targeting $245 → $270 → $300 in stages
❌ Bearish Invalidation:
Break and close below $175 trendline support
Would shift bias toward a wider range or even short-term downtrend
⚙️ Indicators to Watch:
4H RSI holding above midline (50) supports bullish continuation
MACD crossover + volume expansion = trigger confirmation
This chart is a reminder that you don’t need to chase green candles — spotting compression structures and planning for breakout zones is where the edge lies. Whether you’re positioning spot or looking for a leveraged entry, this structure rewards patience and timing.

SOL/USD 4H📉 Price
Current price: approximately $183–$184
We see a decline from the resistance zone around $194.56. The price has broken through support at $187.31 and is heading towards lower support at:
🔴 $183.18 – local support (being tested now),
🔴 $175.58 – key support (potential target if current support breaks).
📊 Market structure
Short-term trend: Downtrend (lower highs and lower lows after a rebound from $194.56).
Volume: Increased volume on bearish candles – confirming supply pressure.
Previous trend: Uptrend with strong momentum from July 18th to July 21st.
🔁 Technical Levels
Resistance:
🟢 USD 187.31 – last broken support, now acting as resistance.
🟢 USD 194.56 – strong resistance (tested twice).
🟢 USD 206.43 – local high, strong resistance level from higher timeframes.
Support:
🔴 USD 183.18 – currently being tested.
🔴 USD 175.58 – stronger support from lower swing highs.
📉 Stochastic RSI
Located in the oversold zone (<20) and pointing down.
No upside crossover yet → no buy signal yet.
If a reversal occurs, a technical rebound is possible.
📌 Conclusions and Scenarios
🔻 Downside scenario (more likely currently):
Breakthrough of support at $183.18 ➜ further decline to $175.58.
Potential entry into a correction of the entire upward movement from July 18-21.
🔺 Upside scenario (alternative):
Support at $183.18 held + Stoch RSI signal ➜ rebound to $187.31.
If buying volume increases, a retest of resistance at $194.56 is possible.

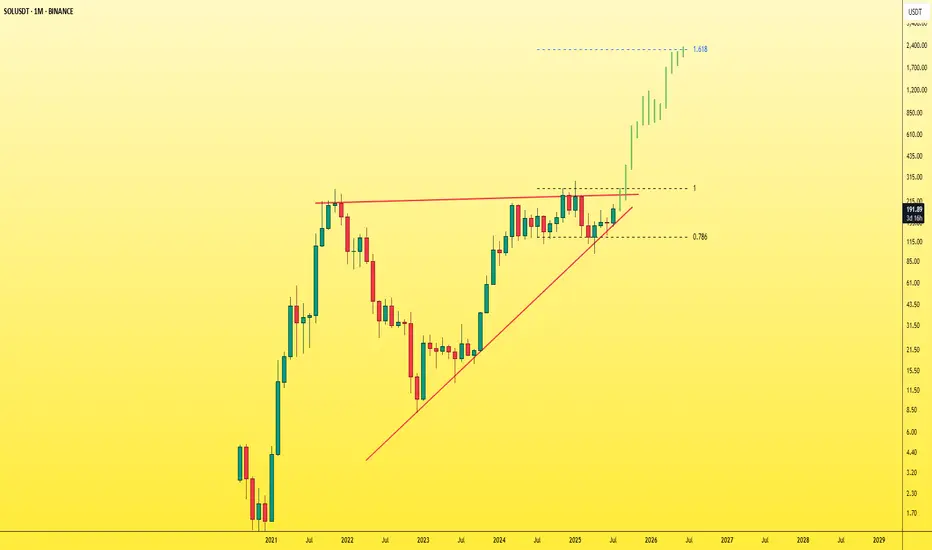
SOL - Don't miss the breakout before it's too late!The symmetrical triangle pattern on the monthly timeframe is showing signs of weakening after multiple failed breakout attempts — and now, a breakout seems highly likely.
Once SOL breaks out of this triangle, it will enter price discovery mode , opening the door to a massive bullish move. At that point, most traders will start saying “it’s too late”, while SOL keeps rallying aggressively — fueled by FOMO and liquidity traps.
You'll see:
- People outside the market waiting for a pullback that never comes.
- Traders inside the move getting shaken out by small dips and volatility.
Right now, SOL is still in a fair trading zone and available at a reasonable price .
Don’t wait for it to explode and then chase. Get in before the breakout .
Best Regards:
Ceciliones🎯
Opened longI opened a long position.
Ideally it is safe to wait for EMAs to line up for the bull trend (EMA21 > 55> 200) in the Daily chart. However, there are many indications that the price will start to move to the upside and the upside move might be quite aggressive. So I decided to open a long position with a small position size.
The reasons for opening a long position:
Daily:
Bull candle has closed above EMA21 for a few times.
RSI lines have crossed and entered the bull zone.
MACD lines are about to enter the bull zone.
Stochastic lines are above to cross and move up.
The price has been staying above Fib 0.236 level for about 10 days.
The price has broke and closed above the descending parallel channel.
4H:
All momentum indicators are in the bull zone.
EMA21 is above EMA 55.
The price has closed above EMA200.
The price is consolidating above the top descending parallel channel.
It is not the perfect bull trend set up, however, there are enough confluences for the price to start to move to the upside.
Entry price: $142.59 (blue horizontal line in 4H chart)
Stop Loss: $130.40 (red horizontal line in 4H chart)
Target: $195 (green horizontal line: Fib 0.5 level in Daily chart and fair value gap zone)
$178 is a strong support and resistance area, so if it starts to stall, I might take a partial profit.
Fingers crossed.

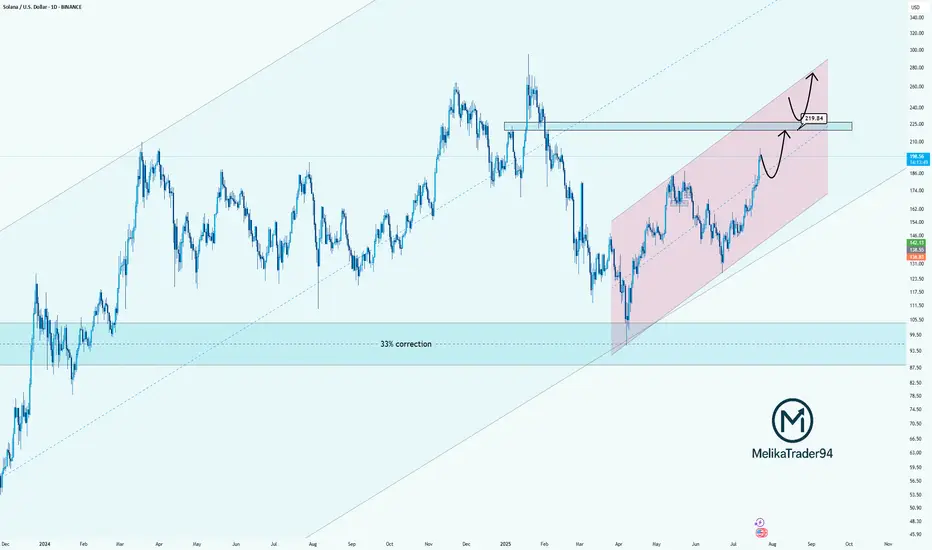
Solana Approaching Key Resistance: watch for $219Hello guys!
Solana has been trending strongly inside a rising parallel channel, recovering steadily after a significant 33% correction. The bullish momentum is clear, and the price is now approaching a key resistance zone near $219.84, which previously acted as a major turning point.
Here’s what I’m watching:
Strong uptrend within the pink channel shows controlled and healthy growth.
$219.84 is a critical decision zone. Price could:
React with a pullback before pushing higher,
Or break through it and flip the level into support for the next bullish leg.
The reaction in this zone will determine the next structure.
Whether we see a temporary correction or continuation to new highs.
Solana is bouncing back from $175 ┆ HolderStatOKX:SOLUSDT is testing the $180 barrier. Breakout could extend gains to $186. If rejected, $172–$173 may act as reentry zone. Market structure favors continuation.
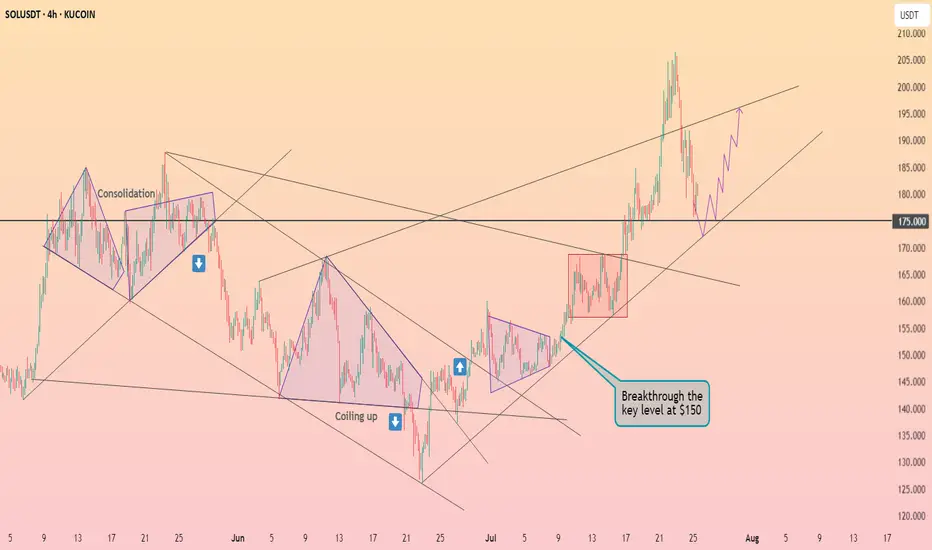
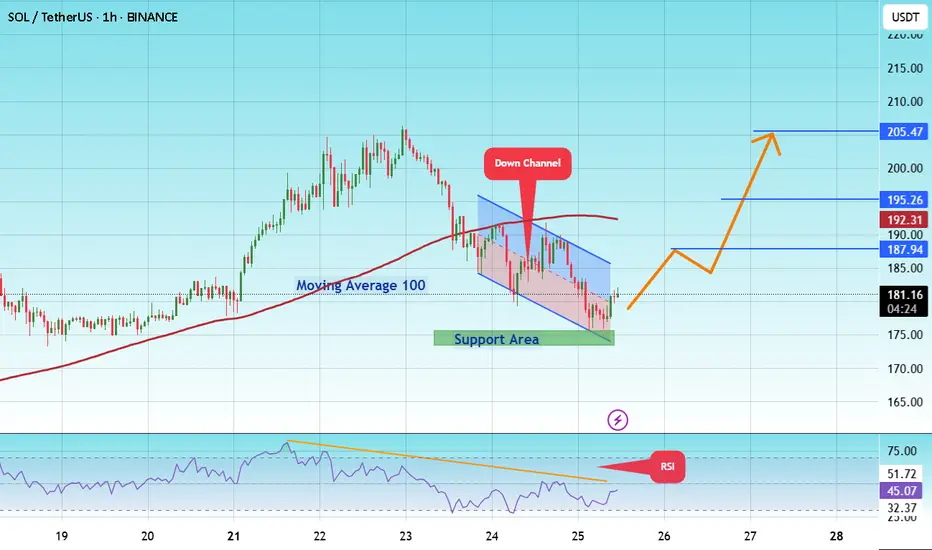
#SOL/USDT coin market structure analysis#SOL
The price is moving within a descending channel on the 1-hour frame and is expected to break and continue upward.
We have a trend to stabilize above the 100 moving average again.
We have a downtrend on the RSI indicator that supports the upward move with a breakout.
We have a support area at the lower boundary of the channel at 175, acting as strong support from which the price can rebound.
We have a major support area in green that pushed the price upward at 174.
Entry price: 181.
First target: 187.
Second target: 195.
Third target: 205.
To manage risk, don't forget stop loss and capital management.
When you reach the first target, save some profits and then change the stop order to an entry order.
For inquiries, please comment.
Thank you.
SOLANA UPDATEHello friends🙌
📉Given the decline we had, you can see that buyers came in and supported the price and were able to change the trend and create an ascending channel.
📈Now, considering that the price is hitting higher ceilings and floors, we can expect an ascending wave until the ceiling of the channel.
Don't forget risk and capital management.⚠
🔥Follow us for more signals🔥
*Trade safely with us*
Solana is preparing to breakthrough $200 ┆ HolderStatOKX:SOLUSDT is trapped between $172 and $180. Break above $180 may unlock $188+. Watch for volume breakout.
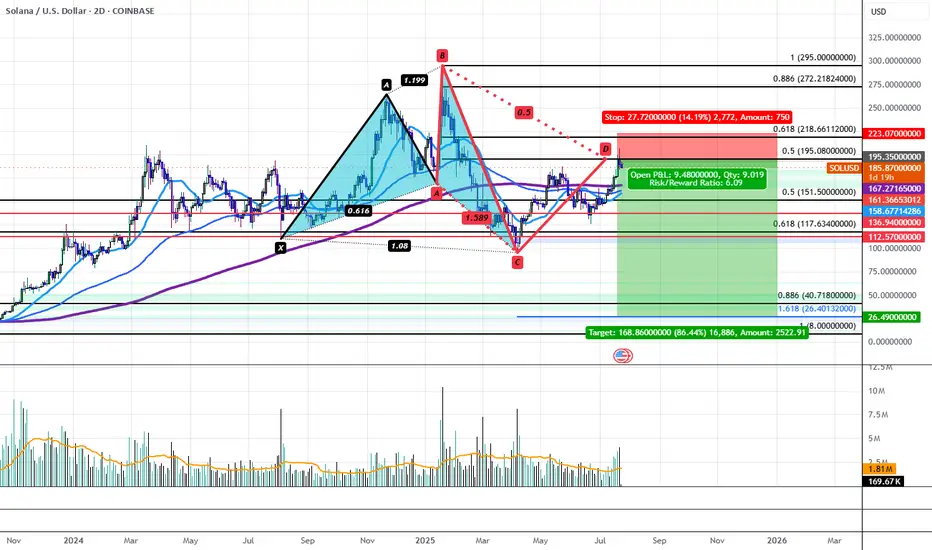
Solana's Bearish 5-0 is Locking in a Bearish Reversal to $26.40Solana has recently run up to Horizontal Resistance Zone of $195-$210 aligning with the PCZ of a Bearish 5-0 and has begun to impulse downwards with volume to back it. This could be the start of a greater move down that would take SOL back to the low of the distributive range at $95.16. If the level breaks, we would then target a drop down to the $40.72-$26.40 confluence area aligning with the all-time 0.886 retrace as well as the 1.618 extension from previous swing low to high. Only at these levels could we even possibly begin to consider Bullish Entries on Solana.