Solana: Cup & Handle PatternTextbook Cup & Handle pattern (yellow) has been shaped on the chart.
Price already broke above the Handle triggering the bullish signal
The target for this pattern is located at the depth of the "Cup" added to the breakout point.
So, the SOL/USDt price eyes $412.
SOLUSD

#SOL/USDT#SOL
The price is moving in a descending channel on the 1-hour frame upwards and is expected to continue.
We have a trend to stabilize above the moving average 100 again.
We have a downtrend on the RSI indicator that supports the rise by breaking it upwards.
We have a support area at the lower limit of the channel at a price of
205.
Entry price 218.00.
First target 224.81.
Second target 232.27.
Third target 240.50.

Solana (SOLUSDT): 320% Profit SecuredSOLANA LONG Trade Setup
The 4-hour chart of Solana showcases a near-flawless long trade setup with incredible execution using the Risological Swing Trading indicator .
Targets 1 through 3 have been hit successfully, and the price is hovering just below TP4.
A stunning 320% profit at 10x leverage has already been realized for traders who capitalized on this move.
Key Trade Details:
Entry Price: $175.69
Stop Loss: $165.36 (well-protected downside)
Profit Targets:
TP1: $188.47 ✅
TP2: $209.14 ✅
TP3: $229.81 ✅
TP4: $242.59 (likely to hit soon)
Insights:
Bullish Momentum: Solana has been riding a robust uptrend, with consistent higher highs and higher lows, aligning perfectly with technical indicators.
Precision Entry: The setup was signaled by the Risological Swing Trader, offering a high-probability trade with defined targets and minimal risk.
Leverage Amplification: With 10x leverage, traders achieved an astounding 320% ROI, exemplifying the power of leveraged trades in strong market conditions.
What's Next?
With TP4 just a heartbeat away, Solana's momentum suggests further potential upside. Keep trailing stops tight to lock in profits and let the market dynamics play out.
Bravo to all who rode this wave! 🌊🚀

The Banana Zone Series - Solana (SOL)Alt-season is here. BTC breakout has been confirmed. If you missed positioning for the next level of exponential moves, what are some of the buy the dip zones while still have time for the bigger moves into the banana zone.
We continue the series with Solana (SOL).
As you can see in my analysis, pull backs to $208 and below is my new accumulation zone. I will initiate some leveraged longs for new trades in preparation for the moves to the banana zone in the alt season.
For more aggressive traders, $210 and below can be the trigger longs with tight stops.
Note that this is a weekly chart so the price action will take place over the 6 to 9 months.
Not a financial advice so DYOR.

Solana, the best and the worse casesToward November 2023 #Solana exploded from ~$20 all the way to ~$210 in March 2024
Using simple Fib #retracement we should have come back to about $115 ... and we did, on August 2024
So we are now in a bullish descending triangle.
Best case :
Green line, we keep going up over the next 2 or 3 weeks and break out past $170 in the middle of next month.
There is a strong area of #resistance around $165 so breaking past that would be quite #bullish.
Likely case :
Blue line, we keep going up over the next 2 weeks and we bounce back at the area of resistance, ~$165 and we go back down to the support around $130 and we then go back up to eventually breakout sometimes next year.
Worse case :
Red line, again, we keep going up over the next 2 weeks and we bounce back at the area of resistance, ~$165 and we go back down ... but we break past $130 and we go back down to $120, (0.5 fib retracement).
Plan
Enter: Now
SL: $129
Target: anything past $500 (remember this is weekly chart, not 5 minutes)
Look out for trend reversal around $162 ... and close your trade if we break trend as it would be the likely case.
Note that FTX will be refunding some/all of the holders toward the beginning of October, but they will be refunded in US Dollar, so they are very likely to use their money to buy back Crypto, (they were traders afterall and they are well aware of the upcoming bull market).

SOLANA should continue rally It broke to new high as expected in idea published month ago. Now it favors pullback in ((iv)) and expect small pullback before it should continue rally in ((v)) to finish 3. It expect few more highs to finish the sequence started from August-2024 low.

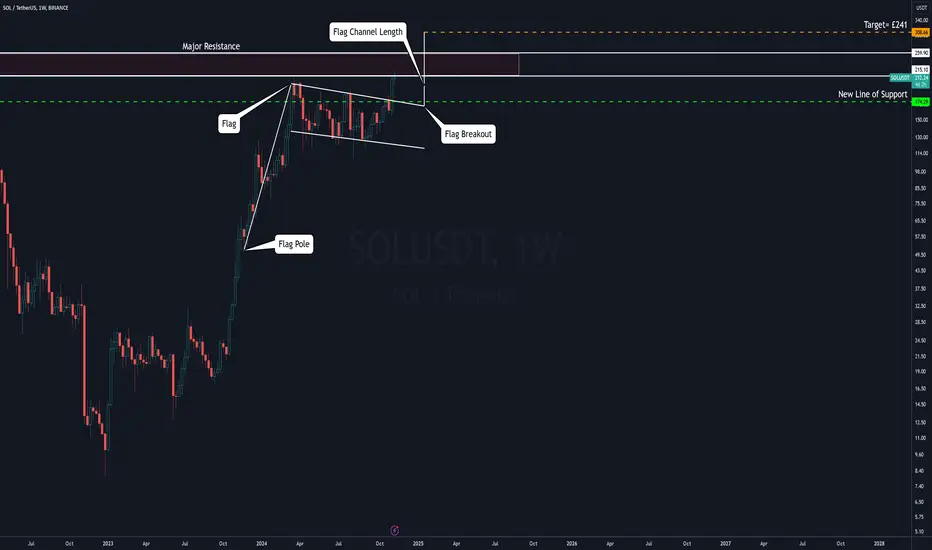
Solana (SOL) - Bullish Breakout!!!Solana has created a bullish flag pattern on the chart. This bullish flag pattern indicates that a breakout is imminent. My analysis identifies a key price target of the first at $308.
The chart shown indicates a bullish flag pattern, which is a technical signal suggesting that an uptrend will continue after a period of consolidation. The flagpole represents a prior rapid price increase, while in the meantime a slight pullback is expected leading us in the horizontal consolidation phase.
During this phase a brief pause with multiple attempts to break the ATH major resistance before the next upward movement creating a new All-Time High.
🟢Support= $174
🔴Major Key Resistance= $259
🌟Target= $308🎯
‼️DISCLAIMER PLEASE READ CAREFULLY‼️
*(THIS NOT FINANCIAL ADVICE, ALWAYS DO YOUR OWN RESEARCH! I AM NOT RESPONSIBLE FOR ANY LOSS OF EARNINGS FROM ANY INVESTMENTS THAT YOU MAY MAKE BASED OFF ANY OF MY IDEAS. ONLY INVEST WHAT YOU CAN RISK TO AFFORD TO LOSE IF YOU MAKE THE DECISION TO DO SO. DO NOT INVEST, UNLESS YOU'RE PREPARED TO LOSE MONEY, IF NOT ALL.)
(CRYPTOCURRENCY CAN BE HIGH-RISK INVESTMENTS DUE TO THE VOLATILLITY OF IT'S NATURE, AND YOU SHOULD NOT EXPECT TO BE PROTECTED IF SOMETHING GOES IN THE WRONG DIRECTION. SEEK PROFESSIONAL ADVICE FROM A CERTIFIED FINANCIAL ADVISOR.)
WIF daily 100% gains buy/hold V-shape recovery setup for bulls🔸Hello guys, today let's review daily price chart for WIF . Noteworthy V-shape recovery in progress, with a decent sequence of higher lows, so overall chart looks good for further gains. limited downside currently.
🔸Strong gains previously in September/Octber, right now re-accumulation
in progress so expecting more gains in this market in November 2024.
🔸Recommended strategy bulls: bullish structure and compression in progress. Accumulate near market price in the highlighted zone. Price target for the bulls is 4.50 USD, so it's a 100% BUY/HOLD trade setup. good luck traders.
🎁Please hit the like button and
🎁Leave a comment to support our team!
RISK DISCLAIMER:
Trading Futures , Forex, CFDs and Stocks involves a risk of loss.
Please consider carefully if such trading is appropriate for you.
Past performance is not indicative of future results.
Always limit your leverage and use tight stop loss.

Solana SOL - Game Is Almost OverHello, Skyrexians!
Today it's time for BINANCE:SOLUSDT - the best and the most hated asset in the crypto market in 2024. The reason of the huge rally, while other altcoins are dumping is the lack of holders. Anyway, every growth will be finished at any moment and now it looks like Solana is about to show us the final pump before the new bear market.
Let's take a look at the weekly time frame. Bull market has been started in 2023 with the wave 1. After that price formed flat correction in wave 2 and there impulsive wave 3 reached $200. You can see our new indicator Fractal Trend Detector showing when the massive wave 3 has been started. Green candles means the uptrend. When you see the green dynamic support zone under the price, it means that strong bull market is in progress. Wave 3 has been supported by this zone.
After that price showed corrective wave C which reached exactly 0.5 Fibonacci retracement, like Bitcoin did. Now the price is in wave 5. Candles are green and the green zone has been printed already under the last candle. It means that this uptrend is not local, this is the impulsive wave 5. This wave has the wide target zone between $243 and $330. Inside this zone we have to be careful and wait for the divergence with Awesome Oscillator and bearish reversal bar to not miss the reversal.
Best regards,
Skyrexio Team
___________________________________________________________
Please, boost this article and subscribe our page if you like analysis!

Is a SOL Solana Pullback and Buy Opportunity on the Horizon?👀👉 SOL has recently demonstrated strong bullish momentum, but could it be reaching an overextended zone? This chart highlights a potential pullback at a key support level, which may offer an ideal entry opportunity. I’m watching this area closely for a possible buy setup that meets the essential criteria covered in the video. In this analysis, we’ll explore key price action signals and discuss strategies for positioning in the next potential move. Disclaimer: This analysis is for informational purposes only and is not financial advice. 📊

SOLUSD up 1000% by July 2025?!Using Fib Retracement tool and a basic flag chart pattern measured move they both predict a possible move from current price of $210 to somewhere in the neighborhood of $2000. Long consolidation followed by a breakout with BTC smashing new highs could lead the Alts on a wild ride in 2025!

Is Solana the New Bitcoin? Exploring its Stellar Rise Is Solana the New Bitcoin? Exploring its Stellar Rise in the Post-Election Rally
Solana (SOL), a high-performance blockchain platform, has been making waves in the cryptocurrency market, surging past the $200 mark and outpacing even Bitcoin's recent gains. This significant price appreciation comes amidst a broader post-election market rally, fueled by optimism about the regulatory landscape and increasing institutional adoption.
The Solana Surge: A Closer Look
Solana's price has skyrocketed over the past week, gaining an impressive 36%. This rapid ascent has caught the attention of both retail and institutional investors, as the platform's unique features and growing ecosystem continue to attract interest.
Key Factors Driving Solana's Rally:
1. Post-Election Market Optimism: The recent U.S. elections have injected a sense of optimism into the cryptocurrency market. Investors are hopeful for a more favorable regulatory environment, which could lead to increased institutional adoption and mainstream acceptance of cryptocurrencies.
2. Anticipation of Spot Solana ETFs: The potential approval of spot Solana ETFs could significantly boost the demand for SOL tokens. As more institutional investors gain exposure to Solana through ETFs, the token's price could experience further upward pressure.
3. Strong Network Performance and Ecosystem Growth: Solana's high-performance blockchain and rapidly growing ecosystem of decentralized applications (dApps) have attracted developers and users alike. The platform's ability to handle a high volume of transactions at low cost has made it a popular choice for various use cases, from DeFi to NFTs.
4. Institutional Adoption: Several institutional investors have shown interest in Solana, recognizing its potential to disrupt traditional financial systems. As more institutions allocate capital to Solana-based projects, the demand for SOL tokens is likely to increase.
The Potential for Further Upside: A $600 Target
A recent survey conducted by MV Global suggests that Solana's price could reach $600 during the current bull cycle. This optimistic forecast is based on several factors, including:
• Strong Fundamentals: Solana's robust technology, scalability, and growing ecosystem provide a solid foundation for long-term growth.
• Institutional Interest: As more institutional investors discover the benefits of Solana, the demand for SOL tokens is expected to rise.
• Favorable Regulatory Environment: A supportive regulatory framework could unlock significant institutional capital and accelerate the adoption of cryptocurrencies, including Solana.
• Market Sentiment: Positive market sentiment, fueled by technological advancements and economic recovery, could further propel Solana's price upwards.
Conclusion
Solana's recent surge to over $200 is a testament to its growing popularity and strong fundamentals. The platform's high-performance blockchain, thriving ecosystem, and increasing institutional adoption have positioned it as a major player in the cryptocurrency market. As the industry continues to mature and regulatory clarity emerges, Solana has the potential to deliver significant returns to investors.
However, it's important to note that the cryptocurrency market is highly volatile, and prices can fluctuate rapidly. Investors should conduct thorough research and consider consulting with financial advisors before making investment decisions.

Start of trading: When the candle is a bearish candle
(Title) Start of trading: When the candle on the 1D chart is a bearish candle
--------------------------------------------
Hello, traders.
If you "Follow", you can always get new information quickly.
Please click "Boost" as well.
Have a nice day today.
-------------------------------------
(SOLUSDT 1M chart)
The point to watch is whether the ATH can be renewed.
-
(1W chart)
To do that, the key is whether the uptrend can be maintained above 202.45.
If it falls below 202.45, you need to check whether it can be supported around 147.74-168.41.
-
(1D chart)
It has not yet updated the ATH, but it is located in a section where there is no support or resistance point to respond to.
Therefore, it is not easy to trade in this section.
Therefore, when the candle of the 1D chart is a downward candle, you have no choice but to check the support on the 1h chart and trade.
-
(1h chart)
The names of indicators that should be considered important on the time frame chart below the 1D chart are displayed.
When the candle of the 1D chart is a downward candle, you can trade depending on whether there is support near BW(100) and BW(0) on the 1h chart (you can use the chart you usually see and trade).
When trading spot, it is recommended to buy when the BW(100) and BW(0) indicators break upward, if possible.
-----------------------------------------------
As the price rises, you start to feel anxious.
If you feel like you are the only one making little profit and you start to feel like you have to buy now, it means that the coin market is approaching its peak.
What do you think?
When the spot market is rising, the number of transactions decreases.
Otherwise, if the number of transactions is increasing, I think it is likely that you are in a state of FOMO.
Therefore, you need to make an effort to find peace again.
-
Have a good time.
Thank you.
--------------------------------------------------
- Big picture
It is expected that a full-scale uptrend will begin when it rises above 29K.
It is expected to touch 81K-95K in the next bull market.
#BTCUSD 12M
1st: 44234.54
2nd: 61383.23
3rd: 89126.41
101875.70-106275.10 (overshooting)
4th: 134018.28
151166.97-157451.83 (overshooting)
5th: 178910.15
These are points where resistance is likely to occur in the future.
We need to check if these points can be broken upward.
We need to check the movement when this section is touched because I think a new trend can be created in the overshooting section.
#BTCUSD 1M
If the major uptrend continues until 2025, it is expected to start forming a pull back pattern after rising to around 57014.33.
1st: 43833.05
2nd: 32992.55
-----------------

Orca DEX: The Next Big Opportunity in the Solana EcosystemCOINBASE:ORCAUSD BINANCE:BTCUSDT COINBASE:BTCUSD BINANCE:SOLUSDT COINBASE:ETHUSD
Orca is gaining impressive momentum, fueled by the rapid expansion of the Solana ecosystem! 🌐 As one of the most promising decentralized exchanges, Orca boasts incredible trading volume compared to its market cap, capturing the attention of investors worldwide. With a limited token supply and a growing community, Orca might be on the verge of breaking barriers and reaching new highs! 📈
📊 Technical Signals:
High entry volume, indicating strong market interest
Potential for growth on an upward trajectory, especially with the expansion of the Solana ecosystem
Limited token supply supporting rapid value appreciation 🚀
⚠️ Why Orca? Orca isn’t just another DEX; it’s a platform that combines speed and usability in DeFi, aiming to become a cornerstone of the Solana network. Now’s the time to watch closely and consider positioning yourself while the token remains accessible!
💥 $100 Target in Sight? With growing volume and adoption, we could see Orca hitting the $100 milestone soon. Don’t miss the chance to follow one of the market’s most promising tokens. #Orca #SolanaEcosystem #DeFi #ToTheMoon #Orca100

Solana - We Will See A New All Time High!Solana ( CRYPTO:SOLUSD ) is preparing for an all time high breakout:
Click chart above to see the detailed analysis👆🏻
After dropping -95% in 2022, Solana then rallied an incredible +2.000% and retested the previous all time high. Then we saw a quite long term but tight consolidation and just two months ago, Solana retested the lower support again. It is just a matter of time until we will see a breakout.
Levels to watch: $120, $210
Keep your long term vision,
Philip (BasicTrading)

SOLUSDT (M) - CUP & HANDLE BREAKOUT, PREDICTION 400+SOLUSDT: Cup & Handle Pattern Testing Crucial Breakout Zone (193 - 208)
SOLUSDT is currently testing a crucial breakout zone between 193 and 208. A confirmed breakout above this range could signal the resumption of a strong bullish trend, with an initial target of 315 - 350, followed by 400 - 437 in the medium to long term (2025 - 2026).
Immediate Support:
The immediate support level is at 169 on the monthly timeframe.

Is Solana the Next Big Contender in the Cryptocurrency Market?
Solana (SOL), the high-performance blockchain platform, has surged to a 7-month high, surpassing the $200 mark. This significant price surge has ignited excitement within the cryptocurrency community, with analysts predicting a potential massive upsurge in the coming months.
Key Factors Driving Solana's Rally
Several factors have contributed to Solana's recent price surge:
1. Network Upgrades and Scalability: Solana has consistently focused on enhancing its network's scalability and performance. Recent upgrades have significantly improved transaction speeds and reduced fees, making it a more attractive platform for developers and users.
2. Growing DeFi Ecosystem: The Solana ecosystem has witnessed substantial growth in decentralized finance (DeFi) applications. With a growing number of DeFi protocols and projects building on Solana, the demand for SOL tokens has increased.
3. NFT Market Boom: Solana has emerged as a popular platform for non-fungible tokens (NFTs). The increasing popularity of NFT marketplaces and collections on Solana has driven demand for SOL tokens.
4. Institutional Adoption: Institutional investors are increasingly recognizing the potential of Solana as a scalable and efficient blockchain platform. Increased institutional interest has led to significant capital inflows into the Solana ecosystem.
Analysts' Predictions and Future Outlook
Cryptocurrency analysts are bullish on Solana's future, citing several factors that could drive further price appreciation:
• Continued Network Development: Solana's ongoing commitment to network upgrades and scalability improvements will attract more developers and users.
• Expanding DeFi Ecosystem: As the DeFi ecosystem on Solana continues to grow, the demand for SOL tokens will increase.
• NFT Market Growth: The NFT market on Solana is still in its early stages, and further growth in this sector could significantly boost SOL's price.
• Institutional Investment: Increased institutional adoption of Solana will provide a strong foundation for long-term price growth.
Technical Analysis
From a technical perspective, Solana's recent price surge has broken through key resistance levels. If the current bullish momentum continues, the price could potentially reach new all-time highs. However, it's essential to consider potential risks, such as market volatility and regulatory uncertainty.
Cautious Optimism
While Solana's recent price surge is undoubtedly exciting, it's crucial to approach the market with a cautious optimism. Cryptocurrencies are highly volatile assets, and prices can fluctuate rapidly. Investors should conduct thorough research and consider their risk tolerance before investing in Solana or any other cryptocurrency.
Conclusion
Solana's recent price surge and positive market sentiment indicate a strong bullish outlook for the platform. However, it's essential to remain vigilant and monitor market developments closely. As Solana continues to evolve and innovate, it has the potential to become a major player in the blockchain industry.
Disclaimer: This article is for informational purposes only and should not be construed as financial advice. Please consult with a qualified financial advisor before making any investment decisions.

SOLUSDT Ascending Triangle PatternSOLUSDT Technical analysis update
SOLUSD has formed an ascending triangle pattern, and the price is now moving towards the triangle's resistance. A strong bullish move can be expected in the coming days
Buy Level: $160.00
Stop Loss: $147.00
Regards
Hexa

SOLANA (SOL) Soars: Targets in Sight on 1-Hour Timeframe!SOLANA (SOL) Technical Analysis Summary:
Solana has gained solid upward momentum on the 1-hour chart, with TP1 (178.59) already achieved and remaining targets within reach. The entry at 169.59 appears well-positioned as Solana rides high on increased user interest, now exceeding 123 million users, bolstered by the recent memecoin trend.
The Risological Dotted Trendline shows strong support, indicating this upward trajectory has the potential to push further toward the following target levels:
TP2: 193.16
TP3: 207.73
TP4: 216.73
Market Insight: With Solana's ecosystem expanding rapidly and user numbers skyrocketing, this rally demonstrates sustained interest and momentum, especially in the face of memecoin-driven volume increases.
As excitement builds, watch for Solana to potentially achieve higher highs, breaking past each target level. Keep an eye on trendline support and overall market sentiment for cues on sustaining this rally.

#SOL/USDT / Ready to go up#SOL
The price is moving in a descending channel on the 30-minute frame and sticking to it well
We have a bounce from the lower limit of the descending channel, this support is at 185
We have a downtrend, the RSI indicator is about to break, which supports the rise
We have a trend to stabilize above the moving average 100
Entry price 187
First target 189
Second target 193
Third target 197

Debunking Myths: Understanding the True Potential of the Solana Solana (SOL), the high-performance blockchain platform, has recently made significant strides, breaking through the $200 barrier and surging nearly 9%. This remarkable surge has not only captivated the crypto community but has also ignited renewed interest in the Solana ecosystem and its native tokens. As Bitcoin approaches a new all-time high, the future of SOL-based tokens appears promising.
The Solana Surge: A Closer Look
Solana's recent price surge can be attributed to several factors:
• Enhanced Network Performance: Solana has consistently improved its network performance, addressing scalability issues that have plagued other blockchains. This has led to increased adoption and usage, particularly in the decentralized finance (DeFi) and non-fungible token (NFT) sectors.
• Growing DeFi Ecosystem: Solana's DeFi ecosystem has experienced exponential growth, with a diverse range of protocols and applications emerging. This expanding ecosystem has attracted a significant number of users and developers, contributing to the increased demand for SOL tokens.
• Positive Market Sentiment: The overall positive sentiment in the cryptocurrency market, fueled by Bitcoin's potential to reach a new all-time high, has also benefited Solana. As investors seek alternative investment opportunities, Solana's strong fundamentals and growth potential have made it an attractive choice.
The Future of SOL-Based Tokens
The surge in Solana's price has had a positive impact on the performance of various SOL-based tokens. These tokens, which represent a diverse range of projects and applications built on the Solana blockchain, have seen increased adoption and value appreciation.
Key SOL-Based Tokens to Watch:
• Serum (SRM): A decentralized exchange (DEX) built on Solana, Serum has gained significant traction due to its fast transaction speeds and low fees. As the DeFi ecosystem on Solana continues to expand, Serum is well-positioned to benefit from increased trading volume and user adoption.
• Raydium (RAY): Another popular DEX on Solana, Raydium offers liquidity pools, automated market makers, and yield farming opportunities. As the demand for decentralized trading platforms grows, Raydium's innovative features and strong community support could drive its token price higher.
• STEPN (GMT): A move-to-earn fitness app built on Solana, STEPN has gained immense popularity, particularly in Asia. As users earn rewards for physical activity, the demand for GMT tokens, which are essential for in-app purchases and upgrades, is likely to increase.
• Orca (ORCA): A decentralized exchange and liquidity aggregator on Solana, Orca provides users with access to a wide range of trading pairs and liquidity pools. As the Solana ecosystem matures, Orca's role as a key player in the DeFi space could drive the demand for ORCA tokens.
•
Potential Challenges and Risks
While the future of Solana and its ecosystem appears promising, it is essential to acknowledge potential challenges and risks:
• Network Congestion: As the number of users and transactions on the Solana network increases, there is a risk of network congestion, which could lead to slower transaction times and higher fees.
• Regulatory Uncertainty: The regulatory landscape for cryptocurrencies remains uncertain, and any unfavorable regulatory developments could negatively impact the price of SOL and SOL-based tokens.
• Market Volatility: The cryptocurrency market is highly volatile, and sudden price swings can occur without warning. Investors should be prepared for potential price fluctuations.
Conclusion
Solana's recent price surge and the growing popularity of SOL-based tokens are indicative of the increasing adoption and potential of the Solana ecosystem. As the blockchain industry continues to evolve, Solana's strong fundamentals, innovative projects, and supportive community position it as a leading player in the space. However, investors should exercise caution and conduct thorough research before investing in Solana or any other cryptocurrency.

Solana’s Cup&handle, Bullpennant, & symmetrical triangle targetsSolana already with a strong green candle on the Daly right now as price action is currently above the brown rimline of the cup and handle. Will be interesting to see how quickly it is able to confirm the breakout, still not completely validated yet but looking promising on the daily chart(not shown here). Since these patterns seem most valid on the monthly time frame it is going to take more than just one bullish daily candle close to confirm the breakout most likely. *not financial advice*

SOLUSDT: Bullish Breakout Signals Further GainsSOLUSDT has broken out from an inverse head-and-shoulders pattern, trading around 187.59 USDT. This breakout above the 180 USDT support hints at a potential climb toward 210 USDT.
With strong momentum and supportive moving averages below, SOLUSDT is set for a bullish run. Watch for a steady hold above 180 USDT to confirm further upside.
