SOL Mid Term IdeaSolana has reached a critical crossroads.
The price is currently above a crucial SR Flip zone. Staying above this level could lead to targets of $140, $162, $175, and $202, and potentially a new all-time high (ATH).
However, if it closes below this zone, we might see a pullback to the $70-$80 range.
SOLUSD

solIf the red box is broken, the next targets are the specified lines, otherwise, I am waiting for a buy step in the green lines.
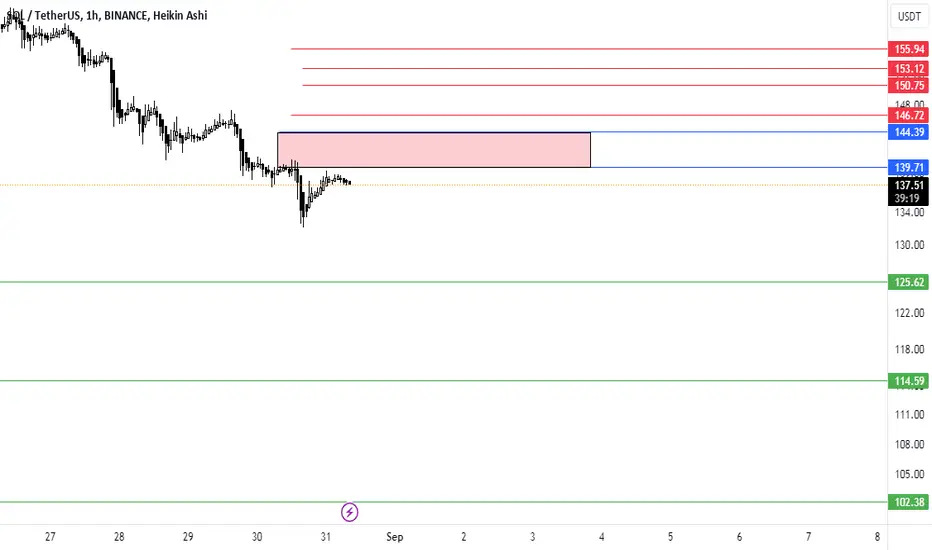
SOL Near Term Retest Move !Sol dropping recent days. But probably price reached to support with $132 for a while.
Price has lost mid term white uptrend channel for the first time past days. Price didn't close any days under this white uptrend channel for almost 7-8 months. But now it failed there as daily close.
That's why currently i believe that retest move will come with upward momentum and then price will continue to downward direction because of it lost its important uptrend channel.
Retest zone points to $148.5 - $150 area. We can see this region in few days.

SOL Monthly ChartSince we're at the end of the month, it's time to look at the monthly charts.
When we look at the price on the monthly chart, we can see that it has settled nicely into these two uptrend channels. Now, let's examine these channels.
Uptrend Channels
The upward momentum that started with the lower channel touch from $8 has brought the price to the middle region of the upper channel. After being rejected there, the price has been holding the lower support of the upper channel for the past 6 months.
Looking at the current situation, the price is standing below the lower support of the upper channel. If it can't close above $160 this month, it will have closed within the lower channel.
If the price can reclaim $160 within the next 2 days before the month ends, the next target would be the middle line of the channel. In this case, we can target the $320 region as the middle line. This is because after holding the lower line of the upper channel for 6 months, the price would start to gain momentum and head towards the middle line of the channel.
However, a close within the lower channel would make the situation more bearish and in this case, we could even target the lower support of the lower channel in the near to mid-term.
GAP
With last year's rise, the price left a GAP, as you can see in the red box. To fill this GAP, we might witness the price moving roughly between $60-$120 for a few months after a crash movement.
This GAP-filling area would also mean that the price accumulates between the lower line and the middle line of the lower channel. Later, when the price tightens there for a few months, the upward movement could restart in 2025.

SOL to 153SOL 4 hr chart has a good set up. We have the HLTS buy signal and modified MACD is about to cross the zero line, and Market Cipher momentum wave is turning and has nice curveture. A retracement move back to 153 is possible.
I will take a scalp long below 145. Not a financial advise. DYOR.

#SOL/USDT#SOL
The price is moving in a descending channel on the 4-hour frame and is sticking to it very well and is expected to break it upwards
We have a bounce from a major support area at the lower line of the channel at a price of 140
We have a downtrend on the RSI indicator which supports the rise
We have a trend to stabilize above the moving average 100
Entry price 142.20
First target 149.31
Second target 152.89
Third target 156.31

SOLUSDT SHORT IDEASOL has reached to 4h supply zone and shown engulfing and weaknees.
entry:158.29
tp1:153.25
tp2:144.94
sl:163.75
r/r:2.45
leverage:5X

SOLANA Update - About to get BEARISH?SOLANA (SOLUSDT) looking weak here.
SOLANA has hit the Trailing stop loss at $154.8 and I have closed my LONG position as per the Risological swing trading indicator.
If the current 4H candle closes in red, I will look for fresh SHORT opportunity.
In any case, Iam ready to catch the right trend and trade.
Market is looking weak right now, though that might change in just one reversal candle.
Cheers and all the best.

The key is whether M-Signal can maintain its alignmentHello, traders.
If you "Follow", you can always get new information quickly.
Please also click "Boost".
Have a nice day today.
-------------------------------------
(Renko 1D chart)
Among altcoins, the number of coins showing upward movement as above is increasing.
In order for a block to be completed, it must rise by more than a block unit.
In the chart above, the rising block is completed only if it rises by more than 5.2.
Otherwise, if it falls below 4.8, the rising block disappears.
In this way, the Renko chart can be said to be a suitable chart for checking trends.
-
(SOLUSDT Renko 1D chart)
-------------------------------------------
(SOLUSDT 1M chart)
(1W chart)
(1D chart)
If you look at the 1M, 1W, and 1D charts above, you can see that the 147.74, 168.41, and 179.89 points are important.
Therefore, if it fails to rise above 168.41, it is important to find support near 147.74.
-
Due to this rise, it seems that the M-Signal of the 1D chart > M-Signal of the 1W chart > M-Signal of the 1M chart has changed.
Therefore, this time, it is important to see whether it can be supported near 147.74 and rise above 179.89.
-
Accordingly, it is a buying period depending on whether it is supported near 147.74, 168.41, and 179.89.
The stop loss point is the HA-Low indicator.
The current HA-Low indicator points are
1M: Not yet created
1W: 13.81
1D: 148.28
as above.
Since the HA-High and HA-Low indicators are created according to price fluctuations, it is recommended to check the 1M, 1W, and 1D charts together.
-
Have a good time.
Thank you.
--------------------------------------------------
- Big picture
It is expected that the real uptrend will start after rising above 29K.
The section expected to be touched in the next bull market is 81K-95K.
#BTCUSD 12M
1st: 44234.54
2nd: 61383.23
3rd: 89126.41
101875.70-106275.10 (when overshooting)
4th: 13401.28
151166.97-157451.83 (when overshooting)
5th: 178910.15
These are points where resistance is likely to occur in the future.
We need to check if these points can be broken upward.
Since I think it can create a new trend in the overshooting section, I need to check the movement when this section is touched.
#BTCUSD 1M
If the major uptrend continues until 2025, it is expected to create a pull back pattern and start after rising to around 57014.33.
1st: 43833.05
2nd: 32992.55
-----------------

#SOL/USDT#SOL
The price is moving in a descending channel on the 1-hour frame and is about to break upwards
We have a trend to stabilize above the moving average 100
We have a downtrend on the RSI indicator that supports the rise by breaking it upwards
We have a major support area in green at a price of 136.50 from which the price rebounded
Entry price 139
First target 144
Second target 150
Third target 156

SOLUSDT Rectangle Pattern FormationSOLUSDT Technical analysis update
SOL has been forming a rectangle pattern for the last 170 days. The price is now approaching the rectangle's resistance, indicating a potential breakout. If the breakout occurs, we can expect a strong bullish move in SOL, with the price possibly reaching $500 in this bull run.
In day chart 200 EMA act as a good support for SOL
A similar pattern formed at the bottom, where the price stayed within a rectangle for 280 days before breaking the resistance and surging 600%. We could see a similar move once the current rectangle is broken.
Regards
Hexa

Solana : WHICH WAY Could it go??Solana was one of my TOP PICKS for alts in 2024.
Second to Ethereum, the SOL space keeps growing as more and more dApss are being built on SOL. The market cap for Solana is looking healthy, after recently peaking at $93B:
This is an incredible achievement, and I expect the market cap to continue to grow in the longer time. Naturally, we can expect SOL to continue growing when the price of BTC starts another impulse wave up. My thoughts on that HERE👇:
Until then, don't lose hope just yet! December is usually a great time for the crypto markets.
_________________________________
CRYPTOCAP:SOL COINBASE:SOLUSD

SOLUSDT - Patience During technical analysis of SOLUSDT, it has shown that this is time to exercise one of the most crucial lessons to learn in trading, PATIENCE.
There is absolutely ZERO need to be entering trades every time you believe you know the correct direction.
Right now the chart is showing the perfect example of why you need to ALWAYS WAIT FOR THE CORRECT SETUP before entering your trade.
I know it's exciting and easy to get trigger happy when entering trades but, PATIENCE, the time will come, and if it doesn't it wasn't meant to be.
FOLLOW YOUR STRATEGY!

SOL - Flirting with support and resistance. SOL trades around $143.2, just above 4HR 50MA, however failing to provide a decisive break and retest of $143.5-$144… Being short since last week, I’m still expecting lower prices as my bearish bias is yet to be invalidated. Closing above $147-$149 could signal strength and would be my first bullish signal.

SOLANA Possible to form Cup And Handle patternSOLANA being sideways for several months, but overall trend still strong bullish momentum for longterm right now. Nowadays they have chance to form " Cup and Handle " pattern to bring price to higher target price at 1.272 and 1.618 fibonacci extension.

SOLUSDT 1WSOL ~ 1W
#SOL There's still a long way to go for NASDAQ:COIN CRYPTOCAP:ETH Killer,. Our target for $Solana is $400-$500.
Hold and buy again if the price dips.

SOL - LongI'm long SOL from 142 to 158 over the next few weeks. MACD volume is still slightly bearish and fear and greed is heading back to Neutral. I expect this trade to take a week or two, and it might go higher.

SOLUSDT Bullish Flag!SOLUSDT Technical analysis update
SOL price has formed a bullish flag pattern on the 4-hour chart, and a breakout has been confirmed. We can expect a strong bullish move from the current level.
Buy zone : Below $1.07
Stop loss : $0.88
Regards
Hexa

SOL Ascending Wedge / Weekly Chart As you can see, the Solana price has been forming an ascending wedge formation since May 2022. This is a really long-term ascending wedge that has been going on for over two years. So it seems likely that it will continue to work.
What Awaits Us?
When we look carefully at the weekly candle contacts, we can say that the candle contacts in the lower and upper regions of the formation are successful. In the last 5 months, the upper region of the formation continues to work as resistance and there are 2 clear retest contacts after the $210 region. After the second retest contact, the price gave a voluminous red candle and then gave a doji candle.
With these, the probability of advancing to the lower region of the formation in the coming period seems higher for now. The lower region shows the range of $67 - $72.

Solana (SOL) Long-Term Investment AnalysisAs of the latest data, Solana (SOL) is trading at $179.07, having experienced a 3.49% increase over the last day. This places SOL in a dynamic position within the top five cryptocurrencies by market cap, currently valued at approximately $83 billion.
Technical Analysis
1. Price Trends and Resistance Levels:
• All-Time High (ATH): SOL’s ATH stands at $260. This level represents a significant resistance point as it’s the highest price SOL has ever reached.
• Dynamic Resistance: The downward sloping red trendline indicates a dynamic resistance level, currently positioned just below the ATH, at around $240. This line has historically acted as a barrier to upward price movements.
• Local Resistance: There is another resistance level marked around the $180 range, where SOL is currently hovering. Breaking through this level decisively could signal further upward momentum.
2. Support Levels:
• Dynamic Support: A green upward sloping trendline suggests a dynamic support level that has been tested multiple times, currently around $120. This line indicates a rising support base for SOL, suggesting a bullish trend over the longer term.
3. Technical Indicators:
• The trading volume is 2.209 million SOL, which shows active trading interest and liquidity.
• With %K at 88.10 and %D at 84.06, the stochastic oscillator is in the overbought territory, indicating potential short-term pullback or consolidation before any further upward movement.
• The RSI stands at 64.01, suggesting that SOL is approaching overbought conditions but still has room for growth.
• The MACD line (9.18) is above the signal line (5.90), with a positive histogram value (3.29), indicating bullish momentum.
Fundamental Analysis
1. Market Position and Adoption:
Solana has gained significant traction due to its high throughput, low transaction costs, and strong ecosystem growth. It is now recognized as a major player in the DeFi, NFT, and Web3 spaces. Recent developments and partnerships continue to bolster its fundamental strength.
2. Technological Advancements:
Solana’s unique consensus mechanism, Proof of History (PoH), combined with Proof of Stake (PoS), offers scalability solutions that rival those of other major blockchains like Ethereum. This technological edge contributes to its long-term growth potential.
3. Ecosystem Growth:
The Solana ecosystem has seen exponential growth in terms of dApps, DeFi projects, and NFT marketplaces. The continued influx of developers and projects onto the Solana platform supports its sustainable growth trajectory.
Market Sentiment
Overall market sentiment for SOL remains bullish. Analysts and investors are optimistic about its long-term potential due to its technological advantages and growing ecosystem. However, caution is advised due to the overbought conditions indicated by the stochastic oscillator and RSI.
Potential Market Scenarios
Bullish Scenario:
• If SOL breaks above the local resistance at $180 decisively, it could target the dynamic resistance around $240 next.
• A sustained move above $240 could open the path toward retesting the ATH of $260 and potentially beyond.
Bearish Scenario:
• Failure to maintain the $180 level could lead to a pullback towards the dynamic support around $120.
• Breaking below $120 would be a bearish signal, potentially leading to further declines towards lower support levels.
When to Buy Solana (SOL) for Long-Term Investment
Current Situation:
Given SOL’s current price at $179.07 and the technical indicators suggesting overbought conditions, a cautious approach is warranted.
Optimal Buying Strategy:
1. Wait for a Pullback: Considering the overbought stochastic oscillator and RSI, waiting for a pullback towards the $150-$160 range could offer a better entry point. This range has shown to be a recent consolidation area and might present a more favorable risk-reward ratio.
2. Dynamic Support Level: If the price drops further, the dynamic support around $120 is a strong level to consider for long-term investment. Historically, SOL has found significant buying interest at this level, making it a safer entry point.
3. Gradual Accumulation: Alternatively, adopting a dollar-cost averaging (DCA) strategy by buying small amounts at regular intervals can mitigate the risk of market timing and take advantage of potential dips.
Conclusion and Market Outlook
Solana (SOL) is currently positioned in a strong uptrend with significant support and resistance levels to watch. While technical indicators suggest potential overbought conditions in the short term, the long-term outlook remains positive due to strong fundamentals and ecosystem growth.
Impact of Bitcoin’s Movement:
It’s crucial to note that Bitcoin (BTC) is currently at a critical juncture. If Bitcoin fails to surpass its all-time high (ATH) and experiences a significant drop, it could have a ripple effect on the broader cryptocurrency market, including Solana. In such a scenario, SOL could also face downward pressure, making it vital to monitor Bitcoin’s price action closely.

SOL Current Downtrend Channel Placed Itself Just Above Last HighThe red downtrend channel has formed above the process continuing from the $194 high area. The price has been using this channel since it rose from the $110 area.
However, in the last 2 days, the price has reached the upper area of the channel again and if it is rejected as before, it will accelerate the downward momentum by following the blue channel below and move to the $115 area.
But if it breaks the area it is currently stuck in, it will follow the green arc and move to the $180 area. In both cases, the breakout seems very close.

SOL (Solana): Sideways ChannelTrade setup : Price remains in an Uptrend, trading in a Sideways Channel. Swing Traders: can trade the Channel, enter near channel support of $120 and exit near channel resistance of $190. Stop Loss (SL) at $115. Learn how to trade Sideways Channel in Lesson 6 of our Trading Course.
Pattern : Price is trading in a Sideways Channel , which is a neutral pattern (indication of market indecision). Trend Traders ought to wait for a breakout in either direction, although typically it breaks in the direction of the existing trend. Swing Traders can trade the range - Buy near Support and Sell near Resistance. Learn to trade Sideways Channel in Lesson 6.
Trend : Short-term trend is Down, Medium-term trend is Down and Long-term trend is Strong Up.
Momentum is Bearish ( MACD Line crossed below MACD Signal Line) BELOW days ago. Price is neither overbought nor oversold currently, based on RSI-14 levels (RSI > 30 and RSI < 70).
Support and Resistance : Nearest Support Zone is $120.00, then $100.00. Nearest Resistance Zone is $160.00, then $190.00.
