The SOLTrain Pushes to $400Solana prepares to mash to the upside once again. An all-time, macro trend in conjunction with manual wave counting suggests that $407 will induce the next 'crypto winter' for the beloved and most promising Solana ecosystem.
SOLUSD

Solana Hits Big Resistance and Drops to SupportGood Morning Traders,
It's important to review price action on Solana because it is our fourth largest altcoin (excluding stables) and does lead much of our altcoin market now in this position.
The inverse head and shoulders pattern is playing out thus far.
Solana touched my $122 support precisely before bouncing and rounding the bottom of our right shoulder.
The 200 day SMA helped to hold price for support.
Price then exceeded our .618 Fib fan level which intersected with a level I had drawn at $145. This now becomes support.
Price had attempted to move higher but there is great resistance ahead on both our price chart and the RSI chart below. Both charts show big areas of confluence that are acting as major resistance. If the bulls can get above these, we are then safe to tackle that neckline. Once broken, we should have a price target of $235-245 before more rest.
Don't forget, holiday weekends often give crypto a big boost. With the 4th of July being a big holiday here in the U.S., I would not be surprised to see price movement float up over the long weekend.
Stew

SOL BULLISH SETUPSimple setup with easy invalidation here on Solana. Price is moving following the short term trendline I drawed, and I expect an upside moves in the coming hours. Invalidation is a clean break below $140.0, that could lead the price to retrace till $130.0. First target for the long is $165.00

Solana: Keeping It SimpleA clean and simple overlay of accumulation and expansion regions in Solana's prior trading history. In the prior bull run we had 2 correction regions followed by large expansions, I believe Solana is ready for a large expansion to new ATH's
Target - $1300

SOL : wait for buy
Detailed Analysis of SOL/USDT Chart By AhmadArz📊
Key Levels and Zones
Support and Resistance Zones:
Support Zones:
118.69 - 120.00 USDT: This is the lower major support zone marked in red. 🔴
130.93 - 132.00 USDT: Another support zone where price action might find support. 🟢
Resistance Zones:
150.77 - 158.89 USDT: This is the first major resistance zone marked in red, with the grey shaded area indicating a potential supply zone. 🔴
170.02 - 175.60 USDT: This is a higher resistance zone indicating potential targets if the price breaks above the lower resistance. 🔴
Signal : 💲
Entry :136.65⬅️
Stop Loss : 130.93🔴
TP 1: 141.94 USDT 🎯
TP 2: 146.40 USDT 🎯
TP 3: 150.77 USDT 🎯
TP 4: 158.89 USDT 🎯
TP 5: 163.98 USDT 🎯
TP 6: 170.02 USDT 🎯
Trend Analysis
Downtrend: The chart shows a general downtrend, with lower highs and lower lows being formed. 📉
Current Pullback: The price recently pulled back from the resistance zone around 150.77 USDT and is now testing lower levels. 🔄
Price Action
Current Price: The current price is around 137.92 USDT, and it appears to be testing the minor support level at approximately 136.65 USDT. 🔍
Possible Rebound: If the price holds above the minor support level, it could attempt to bounce back and test the resistance levels again. 🔄
Potential Scenarios
Bullish Scenario:
Hold Above Support: If the price holds above the 136.65 USDT support, it might attempt a rebound towards the first resistance level at 150.77 USDT. 📈
Break Above Resistance: If the price breaks above 150.77 USDT, it can target higher levels, potentially reaching the subsequent take profit levels (TP 2 to TP 6). 🚀
Bearish Scenario:
Failing Support: If the price fails to hold above the 136.65 USDT support, it could move down to the next support zone around 130.93 - 132.00 USDT. 📉
Further Downside: A break below the 130.93 USDT support could lead to a further decline towards the major support zone around 118.69 - 120.00 USDT. 🛑
Indicators and Patterns
Candlestick Patterns: Observe for any bullish reversal patterns at support levels or bearish continuation patterns near resistance levels to gauge potential price movements. 🔍
Volume: Higher trading volumes near support or resistance levels can provide additional confirmation of potential breakouts or breakdowns. 📊
Conclusion
The chart indicates critical support and resistance zones that can guide trading decisions. The next move will depend on the price action around the current support level at 136.65 USDT. Traders should look for confirmation signals to determine whether the price will rebound or continue its downward trend. ⚖️

The time for the growth of cryptocurrencies is nearGreetings,
Dear friends, I hope you are well and have had a week filled with successful and profitable transactions.
My analysis text:
"Cryptocurrencies and the Solana market are in the third wave, and of course, we witnessed very good growth.
But currently, the fourth wave can be a zigzag pattern and it is not yet completed. It is expected to go below wave A once again, and then we will see the price action by the impulse pattern.
Although the index of cryptocurrencies, in my opinion, if Bitcoin grows in its current market, then we are likely to see Solana grow, of course, this is in the second interest."
Note: I am a new analyst in the world of wave principles with three years of experience, and I am developing an analytical idea. There is no 100% certainty in financial markets due to the complexity of various patterns that can change. However, I do my best to back up any analysis I share with you guys with everything I've learned so far.
A brief explanation of the three fundamental laws of the wave principle:
1. The second wave should never go beyond the beginning of the first wave.
2. The third wave should never be the shortest wave between waves 1, 3, and 5.
3. The fourth wave must never enter the territory of the first wave.
Ralph Nelson Elliott was the founder of this theory, and when asked about his view of the market, he always referred to five waves in the direction of a larger trend and three waves against the direction it was taking. After completing an eight-wave cycle, a larger cycle is formed in the future. It's as simple as that.
May his memory be cherished, and may his soul rest in the shelter of God Almighty and the eternal world.
I am attaching the analysis of this market that I shared with you earlier to this current analysis.
The last word of my analysis text is repetitive, except for the explanation of the current analysis, because I also trade in the financial markets and am active in my social networks, working hard to improve my skills in analysis and trading to reach my goal.
I apologize for repeating the text.
I welcome suggestions and criticisms, and I will certainly respond, but a logical reason is important to me.
Thank you for taking the time to review my analysis, and thank you all.
To all my dear friends and colleagues, first of all, I wish you health and success in your goals.
Mehdi Abbasi with the nickname (Mr. Nobody)

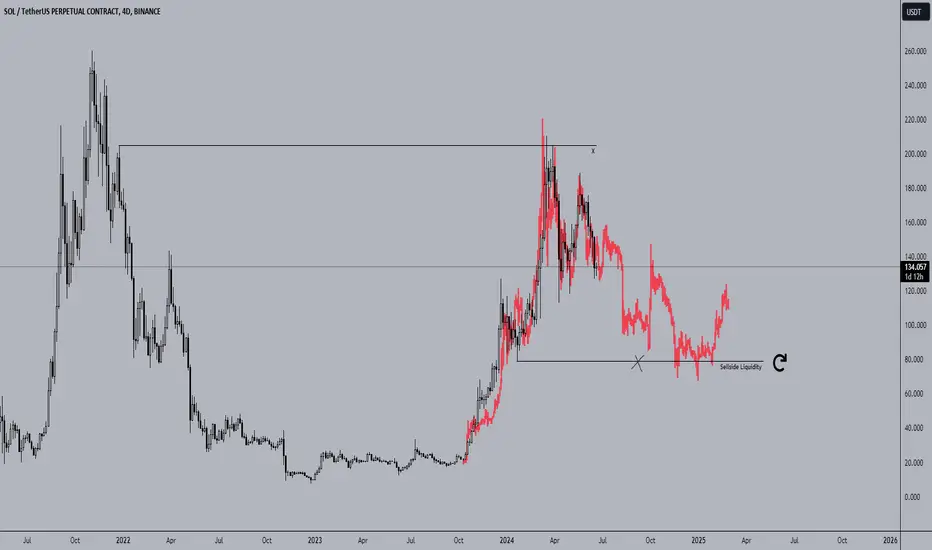
SOL TRDAE IDEASol trade setup is very simple and clean. Take sell side liquidity, fill our Demand Zone and lets go towards moon.

SOL DID 23% PUMP FROM DEMAND ZONESOL did 23% pump from my marked zone and exactly following my plan. And soon will hit our swing main target 200$+. Let's goooooooooo

Key resistance and support levelsCurrently, the price of Solana is around $147 and is moving towards the resistance levels of $150 and $152. If the price can break through these levels, there is a higher likelihood of further price increase. Otherwise, if the price falls below the support level of $140, a further decrease in price is likely.

a complete roadmap for SOL coinWhat happened in 2021 is very similar to what is happening now
A positive pattern forms after an accumulation period Then, after breaking and retesting, a bullish rally occurs
Solana is one of the largest projects ever and you deserve to own a part of it in your portfolio
Entering now is a good decision, even if you are corrected a little with u
Breaking the $200 resistance on the weekly frame will create a huge bullish rally for Solana
best regards ceciliones🎯

Long position on SOLUSDT 2H / Trading setupBINANCE:SOLUSDT
COINBASE:SOLUSD
Mid-risk status: 2x-5x Leverage
TP:
144
146.75
150.2
153.2
160.9
➡️ SL:
134
130
The Alternate scenario:
If the price stabilize below the trigger zone, the setup will be cancelled.

VanEck Seeks First-Mover Advantage with Solana ETF FilingVanEck, a leading innovator in the exchange-traded fund (ETF) space, has made a strategic move to capitalize on the growing popularity of Solana by filing an application with the Securities and Exchange Commission (SEC) to launch the first-ever Solana ETF in the United States. This filing, announced on June 27 via the X platform, signifies VanEck's commitment to expanding its cryptocurrency investment offerings and reflects the company's belief in the potential of the Solana blockchain.
The proposed ETF, named the VanEck Solana Trust, aims to directly track the price performance of Solana (SOL), a prominent cryptocurrency known for its high transaction speed and scalability. According to the preliminary prospectus filed with the SEC, the Trust will achieve this by directly holding SOL tokens in its reserves. These tokens will then back the shares issued by the VanEck Solana Trust, essentially offering investors indirect exposure to Solana's price movements.
The listing venue for the VanEck Solana Trust is planned to be the Cboe BZX Exchange, a prominent platform for trading exchange-traded products. This selection indicates VanEck's intention to provide investors with a familiar and well-established marketplace for accessing Solana exposure through a traditional ETF structure.
This filing by VanEck holds significant implications for both the company and the broader cryptocurrency market. Here's a closer look at the potential impact:
For VanEck:
• First-Mover Advantage: By positioning itself as the first applicant for a Solana ETF in the US, VanEck has the potential to capture a significant share of the market if the SEC approves the filing. This could attract investors seeking convenient and regulated exposure to Solana without the complexities of directly acquiring and managing cryptocurrency tokens.
• Diversification of Crypto Offerings: The VanEck Solana Trust filing represents the company's continued expansion into the cryptocurrency asset class. With existing offerings like the VanEck Bitcoin Strategy ETF (VBIO) already in the market, VanEck demonstrates its commitment to providing investors with a range of options for participating in the digital asset space.
For the Crypto Market:
• Increased Investor Adoption: A SEC-approved Solana ETF could significantly increase mainstream investor adoption of Solana. ETFs offer a familiar, regulated investment vehicle, potentially attracting those hesitant to directly engage with cryptocurrency exchanges. This broader investor base could bring increased liquidity and stability to the Solana market.
• Validation of Solana: The SEC's potential approval of the VanEck Solana Trust would serve as a significant validation of the Solana blockchain's technology and its potential for real-world applications. This recognition from a traditional financial institution could further bolster confidence in the Solana ecosystem.
However, it's important to acknowledge some key considerations:
• Regulatory Hurdles: The SEC has historically taken a cautious approach towards approving cryptocurrency ETFs. The VanEck Solana Trust will need to meet the SEC's stringent regulatory requirements before it can be launched. The approval process could be lengthy and uncertain.
• Market Volatility: The cryptocurrency market remains highly volatile. Investors considering the VanEck Solana Trust should be prepared for significant price fluctuations in the underlying SOL token, which will directly impact the value of their ETF shares.
In conclusion, VanEck's application for the first US-based Solana ETF marks a significant development for both the company and the cryptocurrency market. If approved, the VanEck Solana Trust could pave the way for wider investor adoption of Solana and further validate the potential of this innovative blockchain technology. However, investors should be aware of the regulatory hurdles and inherent price volatility associated with cryptocurrency investments.

SOL IS GOING TO CRASH THE MARKET PART 2MartyBoots here. I have been trading for 17 years and I am here to share my ideas with you to help the Crypto space.
I posted about SOL crashing the market before it crashed when FTX collapsed , check back on my previous trading view videos
This is potentially forming the same pattern that crashed BTC back into COVID crash . So be on alert

SOL...I am loving the way they are trying their best to save Solana's HTF support, but also the ETF filing news.

SOLANA - Top In Place! Down We Go...In our last analysis, we shared an unpopular opinion where we forecasted Solana to move down towards the $10 region.
We appear as if we've made the top and looking for further downside. The overall pattern we're seeing is a 535 Zigzag correction.
We had our confirmation to sell as the break of the red trendline, which we used to signalise the end of wave B and the start of wave C.
We're keeping invalidation levels for the bearish scenario above 210.
We'll be looking for further shorting opportunities. We'll be sure to update when we see another entry point!
Goodluck and as always, trade safe!

Solana - TWO Bearish IndicationsSolana has lost a longstanding trendline that acted as support since October 2023. The price has been unable to bounce back, and we're seeing a steep decline as bears are outweighing buyers:
A Technical Indicator (which I use mainly to determine trend swings from a macro perspective) has just flashed SELL in the weekly timeframe. Now based on previous instances, this took us MUCH lower. These alerts happen in real time when a certain conglomeration of parameters are met (based on Strength, Trend, Averages, Real Time) and so naturally, the higher the timeframe the better the result:
The only way we will be safeguarded against a steep incoming drop, is if the price can reclaim the green trendline in the Weekly Timeframe. From a candlestick analysis perspective, seeing Three White Soldiers in the daily could be a step in the right direction ( which is UP ).
____________________________
COINBASE:SOLUSD

Solana (SOL): Preparing for Further CorrectionsInitially, we entered Solana at $80 and have been pleased with our position. However, upon reevaluating our scenario, we believe that the larger Wave II may not be complete, and we could see further downside. Therefore, we have decided to adjust our stop loss to avoid being prematurely stopped out, especially if Wave II is not yet finished. This adjustment is based on our long-term belief in Solana's potential.
We anticipate that Solana might fall to the range between $92 and $51, with $51 being the absolute maximum downside level. In anticipation of further corrections, we plan to place a second entry at the 127.2% Wave C level, expecting a significant rise post-correction.
Quarterly VWAP Analysis
In the current situation, the 2024 Q1 VAH (Volume Area High) is acting as resistance, while the current range is defined by the 2024 Q1 VWAP at $126, which has been touched twice, each time forming lower lows. If Solana loses the $126 support level, the next significant range is between $91 and $82. This aligns well with our second entry target at the 2024 Q1 VAH and the 2023 Q4 VAH. In the worst case, a further drop could take Solana down to around $60.
To achieve a bullish reversal, Solana needs to reclaim the $126 level and push upwards. Breaking above $161.9 would signal strength, and surpassing the $210 mark would confirm a bullish trend continuation.
In conclusion, we remain open to further downside to the $91-$82 range for a potential second entry. Holding this range is crucial to avoid deeper declines towards $60. Conversely, reclaiming $126 and breaking above $161.9, and eventually $210, would indicate a strong bullish reversal.

SOL: Bottom could be in Solana's price action could become very interesting if we have a daily close at or around $140. This could catapult price in the high 170s, provided that the market remains supportive. Be constructive here.

SOL MARKED STRUCTURE SHIFTED INTO BULLISH | READY FOR 200$.Whole market was struggling in recent days. If we look at SOLUSDT chart then it has taken higher time frame poi with liquidation hunting wick. Now has broke through recent high and did clear market structure shift into bullish side. So as MSS has been done so we are looking for FVG and Sell side liquidity to build long position, which I have marked onto the chart as well. You can keep eye on that marked FVG and SSL.

The medium-term uptrend for Solana has been brokenThe medium-term uptrend for Solana has been broken, and it is now facing resistance in the $135-$140 range. This area acts as a key level for potential price reversal. If Solana fails to reclaim this level, the price is likely to move towards lower targets around $110 and $100.

Solana - TREND Indicators BEARISHUsing a Technical Indicator here which I use mainly to determine trend swings from a macro perspective. At least for the short term, SOL is bearish.
We've lost a long standing trendline that has held since October 2023, which is around the time that the bullseason started.
This will all largely depend on what BITCOIN does in the short term - more info on that HERE:
___________________________
COINBASE:SOLUSD

Bearish Roadmap on SOL based on Bitcoin 2019 Fractal.Solana is folowing Bitcoins 2019 Echo Bubble structure.
High Time Frame is suggesting much lower prices.
Bullish bounce?SOL/USD is falling towards a support level which is a pullback support and could potentially bounce from this level to our take profit.
Entry: 120.74
Why we like it:
There is a pullback support level.
Stop loss: 113.29
Why we like it:
There is a pullback support level which lines up with the 100% Fibonacci projection.
Take profit: 134.42
Why we like it:
There is an overlap resistance level which lines up with the 38.2% Fibonacci retracement.
Please be advised that the information presented on TradingView is provided to Vantage (‘Vantage Global Limited’, ‘we’) by a third-party provider (‘Everest Fortune Group’). Please be reminded that you are solely responsible for the trading decisions on your account. There is a very high degree of risk involved in trading. Any information and/or content is intended entirely for research, educational and informational purposes only and does not constitute investment or consultation advice or investment strategy. The information is not tailored to the investment needs of any specific person and therefore does not involve a consideration of any of the investment objectives, financial situation or needs of any viewer that may receive it. Kindly also note that past performance is not a reliable indicator of future results. Actual results may differ materially from those anticipated in forward-looking or past performance statements. We assume no liability as to the accuracy or completeness of any of the information and/or content provided herein and the Company cannot be held responsible for any omission, mistake nor for any loss or damage including without limitation to any loss of profit which may arise from reliance on any information supplied by Everest Fortune Group.
