SOL Solana Bearish PennantIf you haven`t sold SOL close to the top:
Solana, hailed for its scalability and performance within the cryptocurrency ecosystem, finds itself ensnared within the confines of a bearish pennant formation, signaling potential headwinds for the altcoin in the near term. With a looming price target of $125, Solana faces mounting selling pressure as it grapples with the implications of this ominous technical pattern.
A bearish pennant, characterized by a brief consolidation phase following a sharp downward move, often precedes further declines, reflecting a temporary pause in selling pressure before a potential continuation of the prevailing downtrend. Solana's recent price action mirrors this pattern closely, with each attempt at recovery stymied by strong resistance, reinforcing the prevailing bearish sentiment.
SOLUSD

SOLANA USD Bearish Robbery Plan to steal moneyMy Dear Robbers / Traders,
This is our master plan to Heist SOLANA / USD Market based on Thief Trading style Technical Analysis.. kindly please follow the plan I have mentioned in the chart. Our target is Green Zone that is High risk Dangerous level MA act as a Dynamic Support & Order Block, So the Market is oversold / Consolidation / Trend Reversal at the level Bullish Robbers / Traders gain the strength. Be safe and be careful and Be rich.
Note: Day traders & Scalpers If you've got a lot of money you can get out right away otherwise you can join with a swing trade robbers and continue the heist plan.
Loot and escape on the target 🎯 Swing Traders Plz Book the partial sum of money Use Trailing Stop To Protect Looted Money and wait for next breakout of dynamic level / Order Block, Once it is cleared we can continue our heist plan to next new target it will update after the Breakouts.
support our robbery plan we can easily make money & take money 💰💵 Join your hands with US. Loot Everything in this market everyday.

SOL - down before upIn the LTF, SOL is holding important support at 130 so not keen on a market short, but if we can see a bounce to 150 range while BTC rejects 66-67 again, I would look for a medium term short play down to 80-100 range.
Market structure looks ugly rn. Money is being dried out from SOL shitcoins (most down 50-90%). It would have to take BTC to break 67 and push towards 70 for SOL to look somewhat saveable. but even then, You should short SOL/BTC and/or SOL/ETH. Both look infinitely than SOL.

Solana (SOLUSDT): Buzzing towards Honey Voyage $189Join CryptoHoney Traders Kingdom on a swift expedition targeting $189.
Our analysis blends technical patterns with market dynamics, suggesting a potential climb.
We've spotted strong support that's been a reliable launchpad for upward trends, and with our indicators aligning, our thesis strengthens. However, we're not without caution—our stop loss at $134 is our safety net, carefully placed beneath crucial support to protect our capital.
Remember, the crypto landscape is as dynamic as a hive, with movements influenced by a myriad of factors beyond the charts.
Take this insight, and if it resonates with your trading philosophy, consider it a single comb in your diversified strategy hive. Trade with the wisdom of the hive mind, and let's aim for sweet returns.

$SOL chart weaknessThis bearish shoulder head pattern is very dangerous unless it invalidates by price action on #solana #sol chart. Not financial advice.

SOLUSDT$SOLANA Chart Update: Looking at the CRYPTOCAP:SOL chart, we see a very attractive and well-formed bull flag pattern. Currently, the price has reached the support level of the formation, which coincides with the Fibonacci 0.618 level. If it takes support here and rises, it would confirm the upward momentum.
Targets:
1. First Target: Fibonacci 1 level at $210
2. Second Target: Fibonacci 1.272 level at $265
Let's watch closely for a bounce from this support to validate the bullish scenario! 🚀

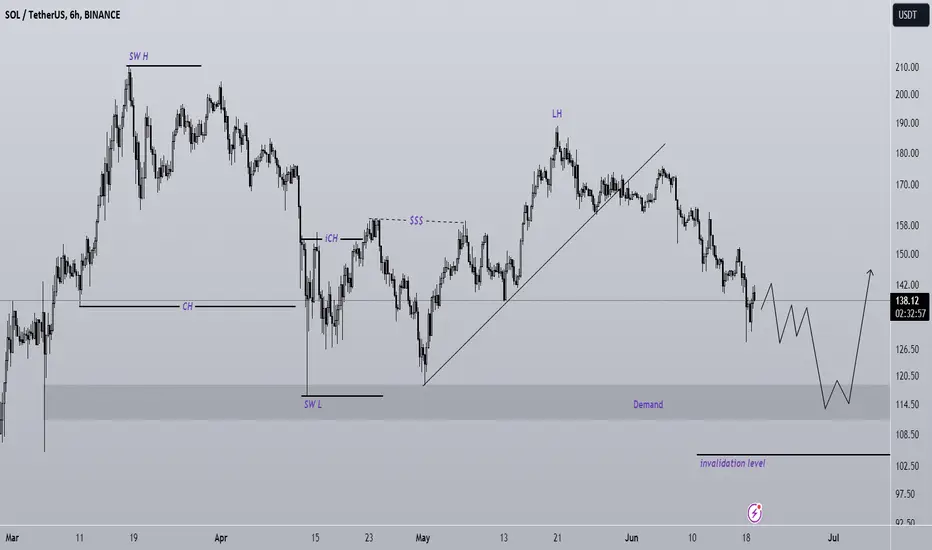
SOL buy setupThe sol symbol is now inside a correction.
It has a good support range ahead that it can react well to.
We will look for buy/long positions on the green range.
Closing a daily candle below the invalidation level will violate the analysis.
Note that the financial market is risky, so:
Do not enter any position without confirmation and trigger.
Do not enter a position without setting a stop.
Do not enter a position without capital management.
When we reach the first TP, save some profit and try to move the stop continuously in the direction of your profit.
If you have any comments please post them, comments will help us improve our performance
Thanks
Bearish drop?SOL/USD is rising towards a resistance level which is a pullback resistance that lines up with the 23.6% Fibonacci retracement and could reverse4 from this level to our take profit.
Entry: 140.47
Why we like it:
There is a pullback resistance level which lines up with the 23.6% Fibonacci retracement.
Stop loss: 151.74
Why we like it:
There is a pullback resistance level which aligns with the 50% Fibonacci retracement.
Take profit: 120.66
Why we like it:
There is a pullback support level.
Please be advised that the information presented on TradingView is provided to Vantage (‘Vantage Global Limited’, ‘we’) by a third-party provider (‘Everest Fortune Group’). Please be reminded that you are solely responsible for the trading decisions on your account. There is a very high degree of risk involved in trading. Any information and/or content is intended entirely for research, educational and informational purposes only and does not constitute investment or consultation advice or investment strategy. The information is not tailored to the investment needs of any specific person and therefore does not involve a consideration of any of the investment objectives, financial situation or needs of any viewer that may receive it. Kindly also note that past performance is not a reliable indicator of future results. Actual results may differ materially from those anticipated in forward-looking or past performance statements. We assume no liability as to the accuracy or completeness of any of the information and/or content provided herein and the Company cannot be held responsible for any omission, mistake nor for any loss or damage including without limitation to any loss of profit which may arise from reliance on any information supplied by Everest Fortune Group.

Solana SOL to $500 soon! very basic but large cup and handle for Solana. chart shows a nice symmetrical trialgle or bull flag, either way, up is most likely, if Sol closes here or higher by weeks end. thn clone measured moves show the range to expect, first the triangle breakout, could go up an bach down one moe time, then blast off to cup and handle to measured move of $512 lets come back in a month and see what plays out, if trading dont buy first breakout, wait for conf, retest, not financial advice

The key is whether it can rise above 168.41-173.20Hello, traders.
If you "Follow", you can always get new information quickly.
Please also click "Boost".
Have a nice day today.
-------------------------------------
When trading spot, if possible, it is recommended to start trading when the M-Signal on the 1D chart > M-Signal on the 1W chart > M-Signal on the 1M chart.
That is because the uptrend is in progress.
Currently, the M-Signal on the 1D chart > M-Signal on the 1W chart > M-Signal on the 1M chart, but since the price < M-Signal on the 1D chart, it can be interpreted that it is showing signs of turning into a short-term downtrend.
Since the HA-Low indicator of the 1D chart is created and forming a low point range, you can trade around 141.07 depending on whether there is support.
In other words, if it falls below 141.07 and shows resistance, it means that there is a possibility of a stepwise downtrend.
Therefore, it is important to know in which direction it deviates from the HA-Low (141.07) of the 1D chart ~ HA-High (173.20) of the 1D chart.
Since the HA-High (136.92) indicator of the 1M chart is created near the HA-Low indicator of the 1D chart, the area around 136.92-141.07 corresponds to the support area.
And, since the HA-High (168.41) indicator of the 1W chart is created near the HA-High indicator of the 1D chart, the area around 168.41-173.20 corresponds to the resistance area.
Anyway, since it is located near the HA-High indicator of the 1W chart and the HA-High indicator of the 1M chart, that is, near the HA-High indicator, the current price can be seen as being in the high point area.
Therefore, if the price is maintained above 168.41-173.20, it can be interpreted that there is a high possibility of maintaining an upward trend.
Therefore, if you are currently trading, I think it is better to trade from a short-term perspective.
TS - Since the BW indicator of the BW indicator has touched the lowest point, the BW indicator is expected to be created in the price candle.
Therefore, if the BW indicator is created in the price candle, you can trade depending on whether there is support near that point.
Another indicator that can be verified is the StochRSI indicator.
You can reduce psychological anxiety about buying in advance by checking if StochRSI > StochRSI EMA.
The fact that the HA-Low indicator was created means that a low point has been formed.
Therefore, if it shows support near the box range (128.50-153.39) selected based on the HA-Low indicator, it is a time to buy.
If it falls below 141.07 and a step-down trend occurs,
1st: Fibonacci ratio point 0.618 (119.71)
2nd: 99.49
You should check for support near the 1st and 2nd above.
If it starts to rise above 173.20,
1st: 234.12
2nd: 297.74
You should check for support near the 1st and 2nd above.
Have a good time.
Thank you.
--------------------------------------------------
- Big picture
It is expected that a full-scale rise will start when it rises above 29K.
The section expected to be touched in the next bull market is 81K-95K.
#BTCUSD 12M
1st: 44234.54
2nd: 61383.23
3rd: 89126.41
101875.70-106275.10 (overshooting)
4th: 13401.28
151166.97-157451.83 (overshooting)
5th: 178910.15
These are points where resistance is likely to occur in the future.
We need to check if these points can be broken upward.
We need to check the movement when this section is touched because I think a new trend can be created in the overshooting section.
#BTCUSD 1M
If the major uptrend continues until 2025, it is expected to start forming a pull back pattern after rising to around 57014.33.
1st: 43833.05
2nd: 32992.55
-----------------

SOL ( Solana ) - Time to Invest NowBINANCE:SOLUSDT (1W CHART) Technical Analysis Update
SOL is currently trading at $133 and recently had around 35% crash and currently trading around the support zone, if the price correction continues then we can expect the price to reach 110$ and in the worst case it can fall to 78$ range. We will keep our StopLoss below 78$
Entry level: $ 132
Stop Loss Level: $70
TakeProfit 1: $ 154.85
TakeProfit 2: $ 200.26
TakeProfit 3: $ 268.70
TakeProfit 4: $ 393.75
TakeProfit 5: $ 603.01
TakeProfit 6: $ 800.77
TakeProfit 7: $1000 <-- Peak of the bull run
Max Leverage: 2x
Position Size: 1% of capital
Remember to set your stop loss.
Follow our TradingView account for more technical analysis updates. | Like, share, and comment your thoughts.
Cheers
GreenCrypto

SOLUSDTSolana analysis
Weekly and daily time frame
Solana experienced a deep correction after hitting the weekly supply area.
Now it has its weekly midline trading range and daily trading floor range. If the area is maintained, the price can once again touch the ceiling of the weekly supply area. And in case of losing the daily peak zone, we can move towards the weekly support zone

$SOL Long - 200 DMA Confluencein bull markets, we bid the 200 DMA (daily moving average) support
not making this more complicated than it needs to be
200 DMA
HTF support
prior res/support ~$110-$130
CRYPTOCAP:SOL fractal consolidation from 2021 summer
gl hf, NFA <3
- @CryptoCurb

Solana has a stron bearish momentum, could it fall further?Price is rising towards a resistance level which is a pullback resistance that lines up with the 23.6% Fibonacci retracement and could reverse from this level to our take profit.
Entry: 140.47
Why we like it:
There is a pullback resistance level that aligns with the 23.6% Fibonacci retracement.
Stop loss: 151.74
There is a pullback resistance level which aligns with the 50% Fibonacci retracement.
Take profit: 119.62
Why we like it:
There is a pullback support level which lines up with the 100% Fibonacci projection.
Please be advised that the information presented on TradingView is provided to Vantage (‘Vantage Global Limited’, ‘we’) by a third-party provider (‘Everest Fortune Group’). Please be reminded that you are solely responsible for the trading decisions on your account. There is a very high degree of risk involved in trading. Any information and/or content is intended entirely for research, educational and informational purposes only and does not constitute investment or consultation advice or investment strategy. The information is not tailored to the investment needs of any specific person and therefore does not involve a consideration of any of the investment objectives, financial situation or needs of any viewer that may receive it. Kindly also note that past performance is not a reliable indicator of future results. Actual results may differ materially from those anticipated in forward-looking or past performance statements. We assume no liability as to the accuracy or completeness of any of the information and/or content provided herein and the Company cannot be held responsible for any omission, mistake nor for any loss or damage including without limitation to any loss of profit which may arise from reliance on any information supplied by Everest Fortune Group.

$SOL Long - Projecting Market Cap TopLOOKING AT MARKET CAPS, BETWEEN CRYPTOCAP:ETH AND $SOL. IVE BEEN SAYING CRYPTOCAP:SOL IS REPEATING CRYPTOCAP:ETH CYCLE SINCE $8 PER $SOLANA. FADE AT YOUR OWN PERIL, NFA.
(SEE MY LINKED CHART CALLING FOR THE CRYPTOCAP:SOL MARKET CAP BOTTOM IN NOV 2022 AT THE BOTTOM OF THIS ANALYSIS)
CRYPTOCAP:ETH 2020-2021
vs
CRYPTOCAP:SOL 2024-2025
analyzing market cap of CRYPTOCAP:ETH from 2017 to 2021
with market cap of CRYPTOCAP:SOL from 2021-2025
CRYPTOCAP:ETH Market Cap topped at $145B in 2017
CRYPTOCAP:SOL Market Cap topped at $80B in 2021
CRYPTOCAP:ETH MC bottom'd at SEED_TVCODER77_ETHBTCDATA:8B in 2018 (94% drop)
CRYPTOCAP:SOL MC bottom'd at SEED_TVCODER77_ETHBTCDATA:3B in 2021 (96% drop)
CRYPTOCAP:ETH MC ran to $575B in 2021 (4x from 2017 Top), taking 1400 days in between highs
CRYPTOCAP:SOL MC will run to ~$320B in Sep 2025 (4x from 2021 Top), taking 1400 days in between highs?
will be interesting to follow, publish to accurately track
~$320B MC is ~$696.9 per CRYPTOCAP:SOL
(SEE MY LINKED CHART CALLING FOR THE CRYPTOCAP:SOL MARKET CAP BOTTOM IN NOV 2022 AT THE BOTTOM OF THIS ANALYSIS)
-@CryptoCurb

Falling towards 50% Fibonacci support?SOL/USD is falling towards a support level which is an overlap support that lines up with the 50% Fibonacci retracement and could bounce from this level to our take profit.
Entry: 146.10
Why we like it:
There is an overlap support that lines up with the 50% Fibonacci retracement.
Stop loss: 142.83
Why we like it:
There is a pullback support level.
Take profit: 152.83
Why we like it:
There is an overlap resistance level which aligns with the 61.8% Fibonacci retracement.
Please be advised that the information presented on TradingView is provided to Vantage (‘Vantage Global Limited’, ‘we’) by a third-party provider (‘Everest Fortune Group’). Please be reminded that you are solely responsible for the trading decisions on your account. There is a very high degree of risk involved in trading. Any information and/or content is intended entirely for research, educational and informational purposes only and does not constitute investment or consultation advice or investment strategy. The information is not tailored to the investment needs of any specific person and therefore does not involve a consideration of any of the investment objectives, financial situation or needs of any viewer that may receive it. Kindly also note that past performance is not a reliable indicator of future results. Actual results may differ materially from those anticipated in forward-looking or past performance statements. We assume no liability as to the accuracy or completeness of any of the information and/or content provided herein and the Company cannot be held responsible for any omission, mistake nor for any loss or damage including without limitation to any loss of profit which may arise from reliance on any information supplied by Everest Fortune Group.

Buy the dip on Solana - bouncing off support soonTouching the strong resistance line, likely to bounce up in the coming months on technical basis. Fundamentally it is strong in adoption and once the fed cuts interest rate by year end, money market funds and idle cash will start to flood into risk assets such as solana.

SOLUSD Not the time to buy yet.Watch the 1WRSI. Is 4k realistic?Solana (SOLUSD) has been on a correction mode since the March 2024 High, in an attempt to technically harmonize the massive rally of 2023. The 1W RSI Double Topped in the same month and this is where all the essence of the current price action is.
The 1W RSI peaked on the exact same level (86.00) back on the week of August 24 2020. It didn't find a bottom before entering into bearish territory again around 41.50. That correctional Channel was more aggressive than the current, so this time we may only seek confirmation from the 1W MA50 (blue trend-line), which has been supporting ever since the late September 2023 bullish break-out.
In any case, we believe that the RSI's Bull Cycle Buy Zone, will again give the most optimal buy entry, so we haven't bottomed yet. In any case, we are well within the Mayer Multiple Bands, in fact March's rejection came on its 2 SD above, at the bottom of the Red Wave.
During the previous Cycle, Solana rose by 51250% from the time is started to form the current long-term Fibonacci Channel Up. If we measure the same % growth from the recent Bear Cycle bottom, then we are looking at a peak a little above $4000.
Odd as it may look, keep in mind that Solana has already rose by +2500% up to March's High and if it indeed reaches 4k this Cycle, the rise will be less (+1900%) from March's High than it was from December 2022 to March 2024.
Unrealistic or not, it is up to your mind and capital to judge that but it is a fact that the market is only now entering the most aggressive phase of it Bull Cycle.
-------------------------------------------------------------------------------
** Please LIKE 👍, FOLLOW ✅, SHARE 🙌 and COMMENT ✍ if you enjoy this idea! Also share your ideas and charts in the comments section below! This is best way to keep it relevant, support us, keep the content here free and allow the idea to reach as many people as possible. **
-------------------------------------------------------------------------------
💸💸💸💸💸💸
👇 👇 👇 👇 👇 👇

SOLANA getting ready for big moveSOLANA getting ready for big move
Buy near 147-148
Stop loss at 139
Target 180-190 short term

Bullish rise?SOL/USD is currently reacting off the support level which is a pullback support and could potentially rise to our take profit.
Entry: 145.30
Why we like it:
There is a pullback support level
Stop loss: 138.32
Why we like it:
There is a pullback support level which aligns with the 138.2% Fibonacci extension.
Take profit: 161.68
Why we like it:
There is an overlap resistance level which is slightly below the 61.8% Fibonacci retracement.
Please be advised that the information presented on TradingView is provided to Vantage (‘Vantage Global Limited’, ‘we’) by a third-party provider (‘Everest Fortune Group’). Please be reminded that you are solely responsible for the trading decisions on your account. There is a very high degree of risk involved in trading. Any information and/or content is intended entirely for research, educational and informational purposes only and does not constitute investment or consultation advice or investment strategy. The information is not tailored to the investment needs of any specific person and therefore does not involve a consideration of any of the investment objectives, financial situation or needs of any viewer that may receive it. Kindly also note that past performance is not a reliable indicator of future results. Actual results may differ materially from those anticipated in forward-looking or past performance statements. We assume no liability as to the accuracy or completeness of any of the information and/or content provided herein and the Company cannot be held responsible for any omission, mistake nor for any loss or damage including without limitation to any loss of profit which may arise from reliance on any information supplied by Everest Fortune Group.

SOL analysisHello guys,
Here's my next trade for Solana
I'm entering long as the price bounced from the trendline and I'm expecting to hit at least the upper trendline from the channel.
DYOR and stay safe :P

SOLUSDT LONG Hello dear all i hope you are all doing well
Dear mate we are on bullish market as soon as possible we will hit 200$ again
the chart is clear just open and watch it
than you for your time

Bearish drop?SOL/USD is reacting off the resistance level which is a pullback resistance and could potentially fall to our take profit.
Entry: 149.31
Why we like it:
There is a pullback resistance level.
Stop loss: 157.34
Why we like it:
There is a pullback resistance level which aligns with the 38.2% Fibonacci retracement.
Take profit: 138.24
Why we like it:
There is a pullback support level.
Please be advised that the information presented on TradingView is provided to Vantage (‘Vantage Global Limited’, ‘we’) by a third-party provider (‘Everest Fortune Group’). Please be reminded that you are solely responsible for the trading decisions on your account. There is a very high degree of risk involved in trading. Any information and/or content is intended entirely for research, educational and informational purposes only and does not constitute investment or consultation advice or investment strategy. The information is not tailored to the investment needs of any specific person and therefore does not involve a consideration of any of the investment objectives, financial situation or needs of any viewer that may receive it. Kindly also note that past performance is not a reliable indicator of future results. Actual results may differ materially from those anticipated in forward-looking or past performance statements. We assume no liability as to the accuracy or completeness of any of the information and/or content provided herein and the Company cannot be held responsible for any omission, mistake nor for any loss or damage including without limitation to any loss of profit which may arise from reliance on any information supplied by Everest Fortune Group.
