SOL: sell in cycle📊Analysis by AhmadArz:
🔍Entry: 180.85
🛑Stop Loss: 187.18
🎯Take Profit: 175.44-169.76-163.92-156.88-150.02
🔗"Uncover new opportunities in the world of cryptocurrencies with AhmadArz.
💡Join us on TradingView and expand your investment knowledge with our five years of experience in financial markets."
🚀Please boost and💬 comment to share your thoughts with us!
SOLUSD

SOLANA (SOL) is forming a massive, multi-year Cup & Handle!Solana is forming a MASSIVE Cup & Handle formation that could lead to major gains over the next few years. As many know, Solana has a potentially infinite supply of coins that can be created, which is one of its major downsides, in my opinion. As far as trading, and not investment perspective, I think Solana will make some mind-boggling gains over the next 3 to 5 years.
Good luck, and always use a stop-loss

Sol, survivor? ElliottwaveIf you find this information inspiring/helpful, please consider a boost and follow! Any questions or comments, please leave a comment!
#SOL been awhile.
Can see a possible additional wave 5 to come.
Needs to prove it.
Flipped
$120 from resistance to support, good for bulls.
Break below, not so good.
Looking for a clean impulse up.
$162 is my level to see if it can blast or
if it corrects to it.

SOL - Similar Re-Accumulation Last CycleLast cycle we had a re-accumulation that looked just like this, and it was from the exact same levels. Scroll left and go take a look. I pulled the fractal and overlaid it for comparison. This is how I'm expecting it to happen. It's also worth noting that BTC and ETH also have a re-accumulation that matches up with last cycle's fractal. This big dump was the spring and now we have hidden bullish divergences on the daily across all of the altcoins

The key is whether it can receive support and rise around 136.92Hello traders!
If you "Follow" us, you can always get new information quickly.
Please also click “Boost”.
Have a good day.
-------------------------------------
(SOLUSDT 1M chart)
The 136.92 point is the HA-High indicator point.
Therefore, the key is whether it can be supported and rise around 136.92.
(1W chart)
Since the MS-Signal indicator is formed over the range of 0.618 (119.71) to 0.707 (135.56), the key is whether it can be supported and rise in this range.
If this fails and it falls, it is expected to fall to around 0.5 (98.71).
In other words, you need to check if it can be supported and rise near the M-Signal indicator on the 1M chart.
Since the HA-High indicator was formed at the 168.41 point, it is likely that an uptrend will begin if it rises above this point.
(1D chart)
The StochRSI indicator is showing an upward trend in the oversold range, but considering the current setting value of the StochRSI indicator, it must rise above 30 during trading to be considered to be out of the oversold range.
Therefore, it cannot be said that it is out of the oversold zone yet.
However, if StochRSI > StochRSI EMA remains, the possibility of an upward rise increases, so the key is whether it can receive support and rise around 136.92.
Currently, the horizontal point of the BW indicator is formed at 153.16.
Therefore, it is time to buy only when the price rises above 153.16 until a new horizontal point of the BW indicator is created.
Therefore, if support is confirmed around 136.92, proceed with aggressive buying.
If you encounter the horizontal point of the newly created BW indicator or the MS-Signal indicator around 153.16, you should sell it in installments.
This is the basic trading strategy of aggressive buying.
However, depending on the situation, you can either sell 100% or sell the purchase principal amount.
As mentioned earlier, full-scale purchase is
- horizontal point of the BW indicator,
- MS-Signal indicator,
- HA-High, HA-Low indicators,
- Support and resistance points drawn on 1M, 1W, 1D charts
This is possible when it is confirmed that you are supported in the above areas.
Have a good time.
thank you
--------------------------------------------------
- The big picture
The full-fledged upward trend is expected to begin when the price rises above 29K.
This is the section expected to be touched in the next bull market, 81K-95K.
#BTCUSD 12M
1st: 44234.54
2nd: 61383.23
3rd: 89126.41
101875.70-106275.10 (when overshooting)
4th: 13401.28
151166.97-157451.83 (when overshooting)
5th: 178910.15
These are points that are likely to encounter resistance in the future.
We need to see if we can break through these points upward.
Since it is thought that a new trend can be created in the overshooting zone, you should check the movement when this zone is touched.
#BTCUSD 1M
If the general upward trend continues until 2025, it is expected to rise to around 57014.33 and then create a pull back pattern.
1st: 43833.05
2nd: 32992.55
-----------------

Long SOLANA COINLong Solana coin here. 50% of position. Will scale in rest over next 1-3 hours. Solana double top was obvious but got distracted fishing. Think we test 200$ sol in next 2-8 days. Let's see what happens.

Solana, Perfect Weekly Cup and Handle, yes or no?I see a perfect cup and handle on the weekly on SOL. Will we break ATH soon in upcoming weeks? What you think?

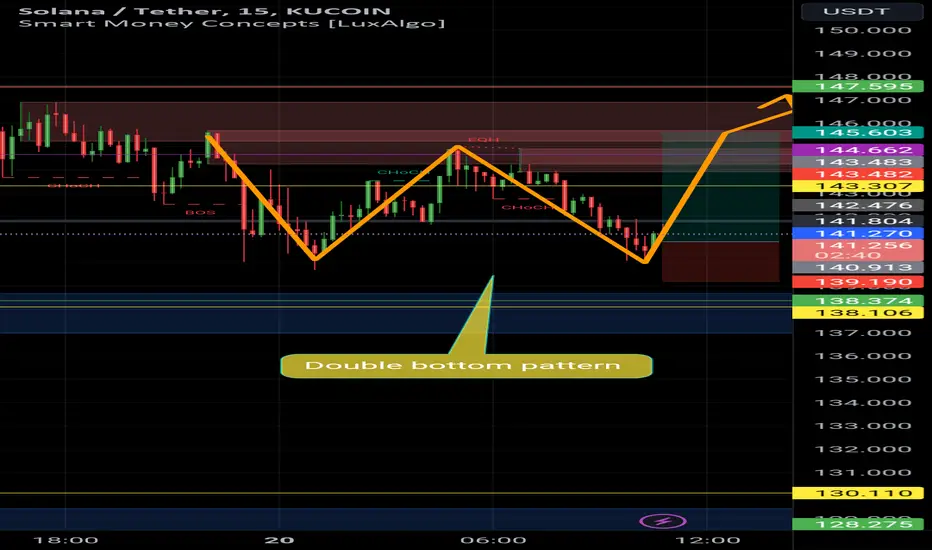
We need to decide whether to go long or short on SOL based on thWe've seen a bounce off the support level!**
Currently showing bullish divergence, so it looks like a good opportunity to buy based on the support level.

Solana Fib Fan Shows Support at $107-122Where can we find support for Solana? A quick draw of the Fib Fan shows that if our 100 day sma does not hold, we could drop to anywhere from $107 to $122. This would coincide with both the rising 200 day sma and .618 on the Fib Fan, a great area of confluence which would make great support.

SOL: 150 next Solana's price could test 125 and find support, in that case a strong rebound into halving could bring the price up to 150.

Solana Still Above An Upside LineEASYMARKETS:SOLUSD
Disclaimer:
easyMarkets Account on TradingView allows you to combine easyMarkets industry leading conditions, regulated trading and tight fixed spreads with TradingView's powerful social network for traders, advanced charting and analytics. Access no slippage on limit orders, tight fixed spreads, negative balance protection, no hidden fees or commission, and seamless integration.
Any opinions, news, research, analyses, prices, other information, or links to third-party sites contained on this website are provided on an "as-is" basis, are intended only to be informative, is not an advice nor a recommendation, nor research, or a record of our trading prices, or an offer of, or solicitation for a transaction in any financial instrument and thus should not be treated as such. The information provided does not involve any specific investment objectives, financial situation and needs of any specific person who may receive it. Please be aware, that past performance is not a reliable indicator of future performance and/or results. Past Performance or Forward-looking scenarios based upon the reasonable beliefs of the third-party provider are not a guarantee of future performance. Actual results may differ materially from those anticipated in forward-looking or past performance statements. easyMarkets makes no representation or warranty and assumes no liability as to the accuracy or completeness of the information provided, nor any loss arising from any investment based on a recommendation, forecast or any information supplied by any third-party.

SOL (SOLANA) Technical Analysis and Trade IdeaThis video presents an in-depth examination of a technical analysis and trading strategy for SOL. Our evaluation indicates the possibility of a trading prospect. We conduct a detailed review of the prevailing price movements, examine the market's framework with precision, and take into account the market's forces. Given the positive circumstances, we pinpoint a prospective point of entry. Nevertheless, it is essential to emphasize the importance of applying strong risk management measures. It is important to remember that the content of this video is intended solely for educational purposes and should not be interpreted as investment advice.

SOLANA LONG SCENARIOS. BULLISH The last bottom zone of solana is $ 80 for me and I think I will buy from there if it falls. I think these two scenarios will develop, stay tuned. fibonacci levels are very important.

Solana 🔻Attention, dear traders! 📈 Today, let's take a closer look at Solana's hourly chart to assess its short-term outlook! 💪
Recent price movements suggest that Solana is forming a descending channel. I made some adjustments to it after my last analysis👇
This indicates that the price recently rebounded from the upper resistance level and is now heading towards the support zone, located at approximately $169 $ 165 - $162. 🔻
One more my SOL/USD chart, take a look 👇
For those eager to expand their knowledge in trading, I've included a links below for further exploration.
Stay tuned for more updates! 📊 Thanks for tuning in! 💼
Best regards,
Kateryna 💙💛

SOLUSD Will it rebound on the 1day MA50 or lower?Solana / SOLUSD touched the 1day MA50 yesterday for the first time since February 24th.
That happens to be exactly on the long term dashed Channel Up.
If its holds the 1day MA50, buy and target 400.00.
If the 1day MA50 breaks, we expect a slightly lower bottom like on January 23rd.
On that occasion, buy when the 1day RSI hits its Support A Zone and target 330.00.
Previous chart:
Follow us, like the idea and leave a comment below!!

SOLONA first correction then gain 💡Hello 🐋
Considering the chart
if we lose our ascending channel we will see more correction close to our support and our support area is based on the fib 👌💪
then
if we wont lose our support I see more gain for the price 📈🤞
it is logical to see
some range movement too 📚💡
both
targets are clear on the chart ✌🎇
📖💡 Feel free to express your perspective by commenting below. Thanks! 🐋

Bearish retest of #sol #solanaCRYPTOCAP:SOL price hasnt' t reclaimed the bullish triangle, yet. In addition there are 2 minor declinations from the resistance. Invalidation: SOL reclaims the triangle. Not financial advice.

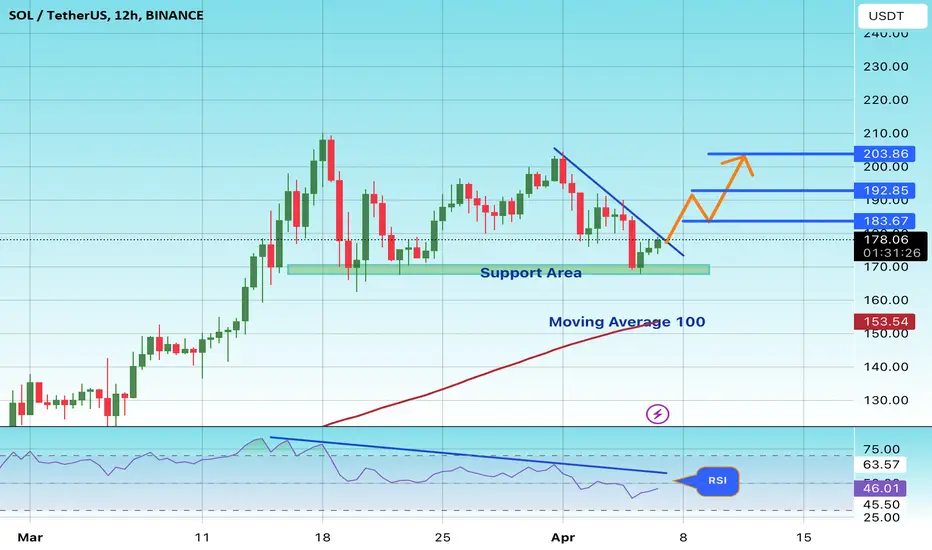
#SOL/USDT#SOL
We have a downtrend on a 12-hour frame, the price is moving within it and adhering to its limits well
We have a major support area at $170
We have a higher stability moving average of 100
We have a downtrend on the RSI that is about to break higher
Entry price is 177
First goal 183
Second goal 192
Third goal 203
Sol not on the horizon.Solana is going to suffer one of the heaviest of corrections as the crypto market suffers a steep decline due to different reasons that i won't expand in here.
This is a short term trade, as i still think the crypto overall could continue going higher after such correction is completed.

SOL's $185 StandoffSOL is currently trading at $185, showing some volatility within the established range. The 4-hour chart illustrates a pattern where SOL is sandwiched between dynamic resistance and support levels, indicating an ongoing tussle for direction. Despite the recent 3.32% drop, the price remains within the trading channel defined by these bounds.
The upper Bollinger Band, sitting at $206.19, has proven to be a tough area for bulls to break, aligning with the dynamic resistance that has capped upward movements. Conversely, the lower Bollinger Band at $177.78 coincides with the static support level, suggesting a potential cushion against a further decline.
The trading volume of 92.758K SOL doesn't point to a dramatic shift in market sentiment yet, but it's a figure to watch for any emerging trends. The Simple Moving Average (SMA) at 185.47 is currently in sync with the price, offering a neutral signal.
The MACD indicator shows that bearish momentum might be building, with the MACD line below the signal line and a negative histogram. However, the Stochastic Oscillator (%K at 34.79) isn't in the oversold territory, implying there isn't an immediate turnaround signal from this indicator.
The Relative Strength Index (RSI) sits at a middling 45.44, leaning neither towards overbought nor oversold conditions. This, along with the RSI-based Moving Average, suggests that while there may be short-term bearish pressure, the mid-term trend hasn't turned decisively negative.
Taken together, these indicators paint a picture of Solana experiencing a period of consolidation with potential to swing in either direction. Traders will likely be watching for a breakout beyond the dynamic resistance or a breakdown below support for a clearer sense of direction. The interplay between these technical indicators and evolving market narratives will shape Solana's path in the coming days.

Sol on the horizonThis is a short term trade, set up is very simple.
Please understand the new dynamics of this market.
Those of you in the old school who believe this is a bubble simply have not understood the new mathematics of the Blockchain, or you did not cared enough to try. Bubbles are mathematically impossible in this new paradigm. So are corrections and all else.

Solana 🔽Hi, friends! 🫶Solana, with its recent price action, presents a compelling opportunity for short-term trading strategies. With its strong fundamentals and growing ecosystem, Solana has garnered attention as a promising blockchain platform. However, in the short term, market dynamics indicate potential downward movements, offering traders a chance to capitalize on price fluctuations. 😊
▶️Opening the position at levels 188-190 📈
✔️Taking profit at level 177 💰
✖️Stop loss above 198 ⛔️
These are just my thoughts, and the decision to enter the trade is up to You. 🤔
Sincerely yours, Kateryna💙💙
