Solana >>> all trendlines are brokenHello guys!
As you can see, all of the trendline is broken, and after forming a double top in Solana, we can see a bearish trend is running!
I believe this downward movement will continue until the price touches the mentioned area!
The pointed area is the target level!
And the blue area has its own potential for getting long!
SOLUSD

HolderStat┆SOLUSD rebound from supportCRYPTOCAP:SOL revisits the 150 pivot inside a corrective wedge, yet April’s growing channel stays intact. Confluence of horizontal demand, wedge resistance and prior consolidation tips a comeback toward 175, then the 185 ceiling, as long as trendline cradle support endures.

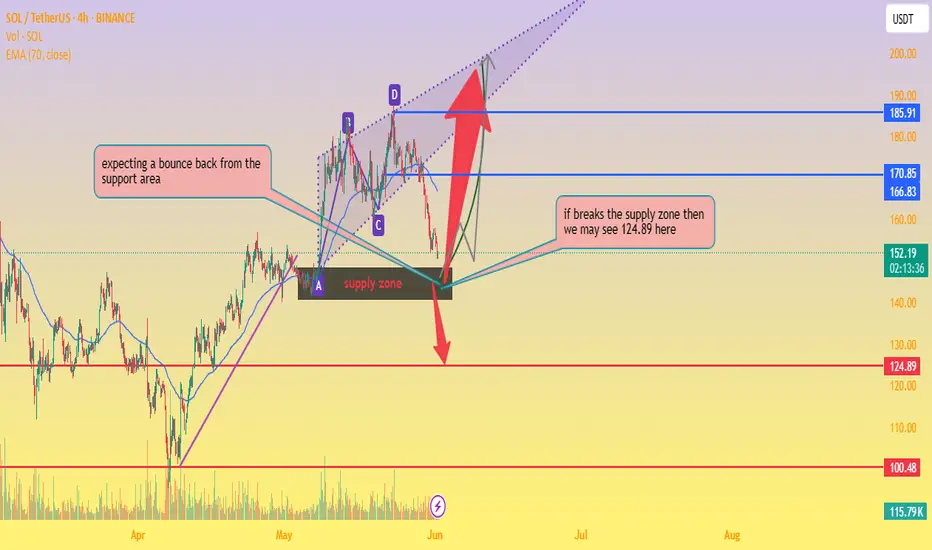
SOL/USDT Key Reversal Zone – Bounce or Breakdown?📊 Chart Analysis:
Current Price: $151.91
EMA 70 (Dynamic Resistance): $166.82
Support Area: Around $150, overlapping with a key supply zone.
Chart Pattern: Harmonic/ABCD structure completing near support.
🧠 Observations:
Price is testing a strong support/supply zone.
📦 If bounce occurs, potential targets:
🎯 First Target: $170.85
🎯 Second Target: $185.91
📉 If support breaks, then:
⚠️ Target: $124.89
📉 Next Major Support: $100.48
🧭 Trade Plan:
🔹 Long Entry (on bullish confirmation):
Entry: $152–$155
SL: Below $149
TP1: $170.85 🎯
TP2: $200 🚀
🔹 Short Entry (on breakdown confirmation):
Entry: Below $148
SL: Above $153
TP: $124.89 🧨
support and drop down your thoughts about it thanks
Solana H4 | Potential bounce off 50% Fibonacci supportSolana (SOL/USD) is falling towards an overlap support and could potentially bounce off this level to climb higher.
Buy entry is at 140.92 which is an overlap support that aligns with the 50.0% Fibonacci retracement.
Stop loss is at 122.00 which is a level that lies underneath an overlap support.
Take profit is at 160.65 which is an overlap resistance.
High Risk Investment Warning
Trading Forex/CFDs on margin carries a high level of risk and may not be suitable for all investors. Leverage can work against you.
Stratos Markets Limited (tradu.com ):
CFDs are complex instruments and come with a high risk of losing money rapidly due to leverage. 63% of retail investor accounts lose money when trading CFDs with this provider. You should consider whether you understand how CFDs work and whether you can afford to take the high risk of losing your money.
Stratos Europe Ltd (tradu.com ):
CFDs are complex instruments and come with a high risk of losing money rapidly due to leverage. 63% of retail investor accounts lose money when trading CFDs with this provider. You should consider whether you understand how CFDs work and whether you can afford to take the high risk of losing your money.
Stratos Global LLC (tradu.com ):
Losses can exceed deposits.
Please be advised that the information presented on TradingView is provided to Tradu (‘Company’, ‘we’) by a third-party provider (‘TFA Global Pte Ltd’). Please be reminded that you are solely responsible for the trading decisions on your account. There is a very high degree of risk involved in trading. Any information and/or content is intended entirely for research, educational and informational purposes only and does not constitute investment or consultation advice or investment strategy. The information is not tailored to the investment needs of any specific person and therefore does not involve a consideration of any of the investment objectives, financial situation or needs of any viewer that may receive it. Kindly also note that past performance is not a reliable indicator of future results. Actual results may differ materially from those anticipated in forward-looking or past performance statements. We assume no liability as to the accuracy or completeness of any of the information and/or content provided herein and the Company cannot be held responsible for any omission, mistake nor for any loss or damage including without limitation to any loss of profit which may arise from reliance on any information supplied by TFA Global Pte Ltd.
The speaker(s) is neither an employee, agent nor representative of Tradu and is therefore acting independently. The opinions given are their own, constitute general market commentary, and do not constitute the opinion or advice of Tradu or any form of personal or investment advice. Tradu neither endorses nor guarantees offerings of third-party speakers, nor is Tradu responsible for the content, veracity or opinions of third-party speakers, presenters or participants.

Price respected the level. The rest is execution.BINANCE:SOLUSDT just tapped the 1H OB near 155.75 — a zone defined by structure, not emotion. If you’ve been following the narrative, this isn’t a dip. It’s reaccumulation before displacement.
Here’s the setup:
Price tagged the OB at 155.75, perfectly aligning with the 0.618 fib — the algorithm’s comfort zone
Below this lies 153.95 — the invalidation level for the long idea
First upside target sits at 158.27 → then 159.83 → then a full rotation into 164.46, where we meet a 1H OB stacked with prior inefficiencies
The volume profile shows clear acceptance in this range. If we hold and rotate back above 157.01 with strength, expect continuation. If we sweep below 153.95 and fail to reclaim, the idea flips.
Execution clarity:
Longs from 155.75–155.00, invalidation below 153.95
First reaction target: 158.27
Full structure target: 164.46
Below 151.67 = deeper reprice scenario into weekly inefficiencies
No noise. No hype. Just structure. The chart is clean — the plan is already in motion.
Want more setups like this before they move? Profile description has them.

Sol, setting!? or will it rise!
In our last Solana ( CRYPTOCAP:SOL ) update, we discussed the potential for a bounce and posed the critical question: would it be a retest or a reclaim? That distinction is now front and center as price action unfolds.
The 141 area remains the level bulls must defend. A clean reaction here, ideally with a supportive pattern, would create favorable conditions for upside continuation. However, if price returns above 169 , the current impulsive structure downward would be invalidated and a recount would be warranted, that could also be the end of the correction.
Zooming out, the bigger question is whether we are in the C wave of a flat correction. If that’s the case, then this impulse Should be the final move before a change in trend. Conversely, an impulse shouldn't be taken for granted nor lightly, I could set the stage for further down side. If a C wave, this pattern could set the stage for a powerful move after it completes.
In simpler terms:
If bulls hold 141 and reclaim momentum, the structure could shift bullish quickly.
If this is a flat, the C wave down is still unfolding, and we may need to endure one more leg lower before a true trend reversal.
Either way, patience is key. Let the chart print clarity.

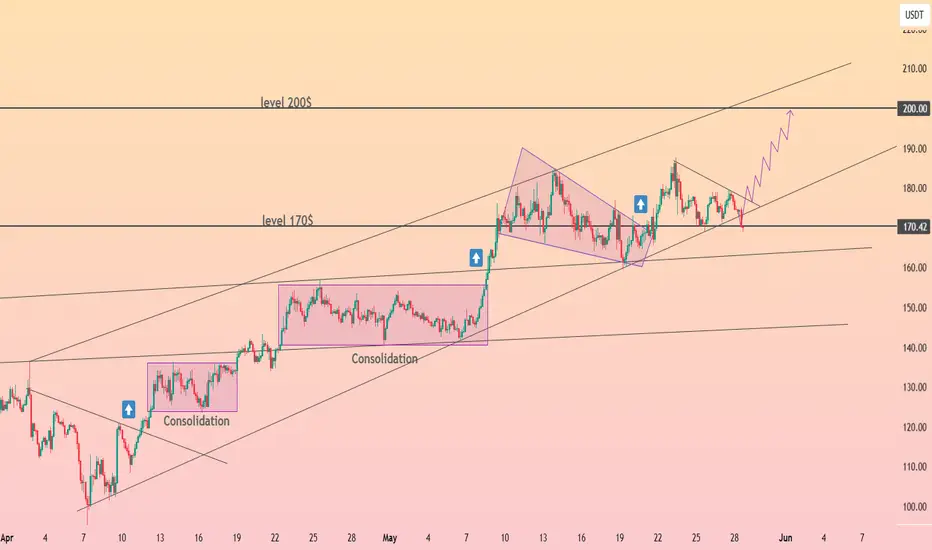
HolderStat┆SOLUSD channel surferCRYPTOCAP:SOL exited a falling channel, built a clean growing channel and parked on 165 USDT support. Repetitive consolidation mid-way and a projected path to the 190 USDT level underscore continuing strength, with trendline confluence favoring upside continuation.

SolanaSol usdt Daily analysis
Time frame daily
Risk rewards ratio >3.5 👈👌
Target 248$
Green line is a historical up trend for solana

They see a rejection. I see a setupSOL swept the low, ran back to premium, and is now hovering in a reactive FVG.
Most traders see uncertainty here — but this is exactly where structure sharpens.
Here’s what just happened:
Price reversed off a well-defined STB and reclaimed the inefficiency above
It pierced into 162.35 before rejecting — not a failure, but a setup
That move left behind two stacked 1H FVGs
We’re now in the upper one — a re-entry pocket if you understand what this is
This zone between 158.21 and 156.93 is where I expect a reaction. If it holds, structure is preserved and the push toward 161.41 → 168+ resumes.
If it fails, we likely probe 153.83 or deeper into 151.51 — one last shake before the run.
Bias: Long
Trigger: Clean reaction off 1H FVG, higher low formed
Invalidation: Below 151.51
Target: 162.35 first, then 168.93+ on continuation
More setups like this — structured, timed, no fluff — are in the profile description.
No group chat noise. Just levels that matter.

Watch out for Solana today.Hello friends
You can see that in the image we have done a complete and comprehensive analysis of Solana for you and identified points that are good supports and can be bought in the areas.
Given the deep correction we had, the market has fallen into fear and a good opportunity has been provided for buying.
The targets have also been identified.
Please observe capital management and avoid irrational risks.
*Trade safely with us*

SOL is next to set new ATH and here's whyHey guys! Like I said in my last review - SOL went to close GAP from the bottom, gathering liquidity.
❓ GAP is almost closed and time to reflect, what's next?
The liquidity imbalance has gotten bigger. If, as recently as last week, there was 1.5 times more liquidity in shorts. Today liquidity in shorts is almost 4 times more than liquidity in longs.
Which means that most of the speculative positions have already been closed. Of course, the volume of liquidations is not even close to the peak, which indicates that there is still no fresh liquidity on the market and therefore it is difficult for the token to maintain the current momentum.
Besides, summer is coming soon and liquidity will only become less. But for SOL this is a plus rather than a minus and here's why:
⚙️ Metrics and Indictors:
VRVP - we are approaching one of the most active levels, in the 148-136 zone. This zone is where the largest area of trader interest is concentrated. And it is in this zone that I think a lot of people will start looking at SOL from a spot buying perspective.
RSI - is 40. It is not in the oversold zone yet, but the GAP is not closed to the end. That means that the probable continuation of the decline to the psychologically important level of 150-147, may provoke a decline to the oversold level and the beginning of short-term purchases by traders.
DLD - as already mentioned. Liquidity of shorts is now 4 times more than liquidity in longs. And as we know, the price moves from one liquidity to another, which acts as fuel for it.
📌 Conclusion:
Unlike ETH and even BTC - there is no more GAP below in SOL! This means that all further declines will be based on effectively traded zones where there is already organic supply and demand. So we are unlikely to see 20% drops overnight (unless if Trump don't do something weird).
Besides, there is a lot of liquidity in shorts at levels 185 - 201 (local double top of the current momentum).
Short squeezes in historically bearish patterns are not uncommon now. As traditional technical analysis has not been working as it should for a long time due to its proliferation.
So I see the first test of the 146 -141 level as the first possible point for a price reversal, at least to renew the local high.
🔥 Congratulations to everyone on the start of summer and have a good week!

How low can Solana go?SOL is potentially creating a local low around $150. If buyers step in and price holds these levels, we could see a reversal, reclaiming previous support around $160.
A rejection from $160 and breaking this week's lows ($150) could signal a retest of previous levels from $130 - $140.
My personal instinct is still weary of the fact that price has been rejected twice from the 1D 200MA, potentially signaling even further weakness for SOL.

SOLANA It has good growth potential in midtermThe SOL will increase $150 and reach to the top of the wedge in the coming weeks .
Give me some energy !!
✨We spend hours finding potential opportunities and writing useful ideas, we would be happy if you support us.
Best regards CobraVanguard.💚

They saw consolidation. I saw controlled accumulation at OB.SOL just printed what looks like sideways noise — but structure tells a different story.
Price swept the 0.786 fib at 151.44, tapped into a refined 4H OB, and held. That isn’t indecision. That’s deliberate compression — Smart Money accumulating just beneath the surface while the herd waits.
Volume profile confirms it. We’re sitting on a high-volume node, and price hasn’t broken it with conviction. Every wick down is a test — and every recovery is another sign of intent.
If price holds above the 4H OB zone, I expect delivery first into 161.49 — an unmitigated OB that lines up with prior liquidity. From there, 171.62 becomes the macro draw. That’s where imbalance meets memory.
Execution alignment:
🟩 Entry: 151.44–153.00 (OB retest zone)
🎯 TP1: 161.49
🎯 TP2: 171.62
❌ Invalidation: Break below 150.53 with displacement
This isn’t consolidation. This is foundation.
I don’t wait for permission. I wait for price to tip its hand.

#SOL/USDT#SOL
The price is moving within a descending channel on the 1-hour frame, adhering well to it, and is on its way to breaking it strongly upwards and retesting it.
We are seeing a bounce from the lower boundary of the descending channel, this support is at 150
We have a downtrend on the RSI indicator that is about to break and retest, which supports the upward trend.
We are looking for stability above the moving average of 100.
Entry price: 156
First target: 160
Second target: 167
Third target: 173

SOL Local Elliot Wave ii UnderwaySolana appears to have completed a motif wave 1 after finding a bottom at the major support high volume node (HVN) macro wave 4.
Wave 2 has not retraced as deep as other alt coins showing strength in the move up. The downside target is the HVN at $140 at the 0.5 Fibonacci Retracement.
Wave 3 should be a powerful move up taking price into all time high.
Failure to hold this support could see price heading back to fresh lows and testing the $90 HVN once more.
Safe trading

Double Top Alert: SOLUSDT Setup Screams ReversalYello Paradisers, will you act like a pro and prepare for the next clean short opportunity on #SOLUSDT, or will you fall for the same breakout trap again just before the market punishes greed?
💎#SOLUSDT is displaying a textbook double top formation just under a well-respected resistance zone. This kind of structure is no joke—it’s a consistent precursor to sharp downside when liquidity gets taken from retail longs who are too eager to buy high. The market rarely gives second chances. What you’re looking at now is one of them.
💎Price has printed a double top around the $185 to $188 region. That zone has repeatedly acted as a ceiling, and buyers have failed to maintain any strength above it. The lack of follow-through is a major sign of exhaustion, especially after the second tap failed to even test the previous high with conviction.
💎Instead of breaking out, SOLUSDT has rolled over and is now struggling under the $176.23 minor resistance. That weakness is already being confirmed on lower timeframes. As long as this area holds as resistance, there is no justification for any probable aggressive long setups. This is a market preparing to punish overleveraged traders.
💎There’s a clear invalidation for this setup, and it’s extremely important to stick to it. Any 4H candle closing above $190.18 would break this structure and force us to step back and reassess the setup. Until that happens, the current bearish thesis remains firmly in play.
💎The nearest support sits at $168.86 which has highest probability that price may visit there. This level may act as a brief pause, but if the selling intensifies, it will likely break. A confirmed move below that level opens the door toward the true target of this breakdown, which is the $153.95 major support zone. That’s where we’ll be watching for a real reaction.
💎The current structure is heavily skewed toward the downside. Bears are clearly in control below $176.23, and the market has shown no signs of reclaiming key levels that would shift that control back to the bulls. Any bounce should be treated as corrective unless proven otherwise by a structural shift.
Strive for consistency, not quick profits, Paradisers. Treat the market as a businessman, not as a gambler. If you master that mindset, you’ll already be far ahead of the crowd.
MyCryptoParadise
iFeel the success🌴

Price tapped the origin. Now we wait for the rest to catch up.Most of the market is reacting. I’m just tracking delivery.
SOLUSDC just printed a clean raid into the 1D OB — perfectly aligned with a HVN on the volume profile. It’s not a coincidence. It’s Smart Money reloading before the next distribution cycle.
The sell-side sweep into 150.7 tagged the 0.786 retracement and the top edge of a stacked STB/OB zone. That’s where I’m already building long exposure.
Price isn’t reversing because of “support.”
It’s reversing because the inefficiency from the rally has now been filled — the FVG is complete, and the reaction confirms it.
From here, my first draw is 171.198 — the EQ of a 1D OB and a known liquidity pool. If we displace through that with conviction, I expect full expansion toward the 184.8 high.
Execution logic:
🔑 Entry: 150.7–154 zone (1D OB + STB zone + 0.786 retrace)
🎯 First TP: 171.198
🛑 Invalidation: 141.4 break and close below (full POI invalidation)
🧠 Patience if we revisit 141 — that level may serve as the final sweep before a macro move higher
I don’t trade headlines. I trade imbalance and narrative.
Precision or nothing. This is why my trades don’t miss.

HolderStat┆SOLUSDCRYPTOCAP:SOL price radar: Solana escaped dual consolidations and now oscillates between 170 and 200 inside an ascending channel. Bulls defend trend-line support as a tightening wedge eyes 200. Chart structure and price analysis favor further upside momentum.
HolderStat┆SOLUSD channeling the sun toward $200CRYPTOCAP:SOL — After escaping a falling channel, price is tracking a neat growing channel between 170$ pivot and 200$ overhead resistance. Repeated consolidation diamonds reinforce upward trajectory and signal strength. Watch 160-165$ baseline—above it, 195-200$ target remains on radar.

SOL Crypto Futures Trade Plan 2025-05-26SOL Crypto Analysis Summary (2025-05-26)
Model Summaries
Grok/xAI Report
Technical: Price $176.77 above 20/50-day MAs but below 200-day SMA. RSI 60.6 (neutral-bullish). MACD shows slight bearish divergence. Bollinger bands suggest price near upper band. Sentiment: Limited positive news impact from luxury watch integration. Neutral funding rate. View: Moderately Bullish (75% confidence). Trade: Long at $177.50, SL $171.00, TP $183.00, 50× leverage, 1% equity position.
Claude/Anthropic Report
Technical: Similar MA and RSI readings; below 200-day SMA. Bollinger bands point to moderate volatility. Sentiment: Balanced funding rate; positive branding news but limited price impact. View: Moderately Bullish. Confidence 72%, below threshold—no trade recommended.
Llama/Meta Report
Technical & Sentiment: Aligns with Grok on MAs, RSI, Bollinger. Neutral overall market backdrop. View: Moderately Bullish (80% confidence). Trade: Long at $176.77, SL $171.74, TP $186.48, 75× leverage, 0.5% equity.
Gemini/Google Report
Technical: Bullish on short-term MAs and RSI but MACD bearish crossover and resistance at 200-day SMA. Sentiment: Neutral funding, niche positive news. View: Moderately Bearish short term (75% confidence). Trade: Short at $176.77, SL $179.50, TP $169.00, high leverage, size 1.
DeepSeek Report
Technical & Sentiment: Highlights 200-day SMA resistance and MACD divergence after 18.5% monthly rally. View: Bearish (75% confidence). Trade: Short at $176.77, SL $181.00, TP $171.74, size 1. Areas of Agreement and Disagreement
Agreement
Price is above the 20/50-day moving averages. RSI (~60) indicates healthy, not overbought conditions. Key resistance near the 200-day SMA (~$181) and upper Bollinger Band (~$186.5). Funding rates are neutral; no extreme positioning. Luxury watch news is a mild positive but not a strong market mover.
Disagreement
Directional bias: Three models lean moderately bullish (Grok, Claude, Llama), two bearish (Gemini, DeepSeek). Trade triggers: Bullish models target breakouts above current price; bearish models emphasize MACD crossover and 200-day SMA rejection. Position sizing and risk thresholds vary widely (1% equity vs. 0.5% vs. full contract). Conclusion
Overall Market Direction Consensus: Moderately Bullish Recommended Trade: Long SOL futures
Entry Range: 177.50 (to confirm continued upside momentum) Stop Loss: 171.00 (just below 20-day SMA) Take Profit: 183.00 (near upper Bollinger Band resistance) Position Size: 1 contract (≈1% of equity at 50× leverage) Confidence Level: 73% Key Risks and Considerations: MACD bearish divergence could trigger a short-term pullback. Strong resistance at the 200-day SMA (~$181) and upper Bollinger band. Correlation with BTC/ETH and broader crypto market swings. Volatility spikes can induce slippage—strict risk management required. TRADE_DETAILS (JSON Format)
{ "instrument": "SOL", "direction": "long", "entry_price": 177.50, "stop_loss": 171.00, "take_profit": 183.00, "size": 1, "confidence": 0.73, "entry_timing": "market_open" }
📊 TRADE DETAILS 📊 🎯 Instrument: SOL 📈 Direction: LONG 💰 Entry Price: 177.5 🛑 Stop Loss: 171.0 🎯 Take Profit: 183.0 📊 Size: 1 💪 Confidence: 73% ⏰ Entry Timing: market_open
Disclaimer: This newsletter is not trading or investment advice but for general informational purposes only. This newsletter represents my personal opinions based on proprietary research which I am sharing publicly as my personal blog. Futures, stocks, and options trading of any kind involves a lot of risk. No guarantee of any profit whatsoever is made. In fact, you may lose everything you have. So be very careful. I guarantee no profit whatsoever, You assume the entire cost and risk of any trading or investing activities you choose to undertake. You are solely responsible for making your own investment decisions. Owners/authors of this newsletter, its representatives, its principals, its moderators, and its members, are NOT registered as securities broker-dealers or investment advisors either with the U.S. Securities and Exchange Commission, CFTC, or with any other securities/regulatory authority. Consult with a registered investment advisor, broker-dealer, and/or financial advisor. By reading and using this newsletter or any of my publications, you are agreeing to these terms. Any screenshots used here are courtesy of TradingView. I am just an end user with no affiliations with them. Information and quotes shared in this blog can be 100% wrong. Markets are risky and can go to 0 at any time. Furthermore, you will not share or copy any content in this blog as it is the authors' IP. By reading this blog, you accept these terms of conditions and acknowledge I am sharing this blog as my personal trading journal, nothing more.

Solana(based on NEowave)I consider this as a triangle but under the price zone which is 139 it tells us its going to make a diamond diametrical.

SOLUSD Trend Analysis DAY TF BUY The provided chart and analysis outline a bullish outlook for SOL/USD (Solana against the US Dollar) as of May 26, 2025. The current price is noted at **177.71**,
with a strong recommendation to look for long/buy entries, particularly on dips. The analysis emphasizes long-term holding for optimal results, with three key profit targets: **TP1: 194.00, TP2: 227.00, and TP3: 252.00**.
**Key Observations from the Chart**
1. **Long-Term Bullish Trend**: The analysis highlights that Solana’s long-run trajectory has significant upside potential. The suggested strategy involves accumulating positions gradually, especially during price retracements, to maximize gains over time.
2. **Green Zone as Critical Support**: The chart indicates a "green zone," which acts as a crucial support area. If the price crosses below this zone and closes a candle beneath it, the bullish setup becomes invalid, signaling a potential trend reversal or deeper correction.
3. **Risk Management**: Traders are advised to exercise caution by using smaller quantities on each dip and conducting due diligence before entering trades. This approach minimizes risk while capitalizing on upward momentum.
