Is a great time for holding Solana?!Hello guys!
What I see:
Ascending Channel: Price has been moving inside a clearly defined upward-sloping channel since the start of 2023, showing a strong long-term uptrend.
33% Correction: Recently, SOL experienced a 33% correction from its local high, testing the previous breakout zone (highlighted in light blue). This area has now acted as a strong support.
Bullish Signal: Price is attempting to reclaim and close above a key horizontal resistance level (~$132), noted by the text: “If the price closes above this level, then buy it.” A close above this level would confirm a bullish reversal and suggest strength returning to the trend.
RSI Outlook: The RSI indicator at the bottom shows a potential reversal from the lower range, indicating possible bullish momentum building.
Projection: If the price successfully closes above the mentioned resistance zone, the structure supports a potential move toward a new high, as marked by the arrow pointing toward the upper channel boundary (above $250 and potentially up to $300+).
SOLUSD

Solana: More RoomSolana’s countermovement of the green wave 4 has some more room on the upside. Once the wave-4-top is established (below the resistance at $192.33), we primarily anticipate a wave 5 sell-off down into the blue Target Zone on the downside (coordinates: $56.56 – $29.87). In this range, the wave (ii) corrective movement should conclude, and the altcoin should start the next sustainable upward impulse. However, if the price rises above the mentioned $192.33 mark during the current upward movement (36% likely), this will suggest that the low has already formed via wave alt.(ii) in blue.

#SOL/USDT#SOL
The price is moving in a descending channel on the 1-hour frame and is expected to continue upwards
We have a trend to stabilize above the moving average 100 again
We have a descending trend on the RSI indicator that supports the rise by breaking it upwards
We have a support area at the lower limit of the channel at a price of 134
Entry price 137
First target 140
Second target 144
Third target 149

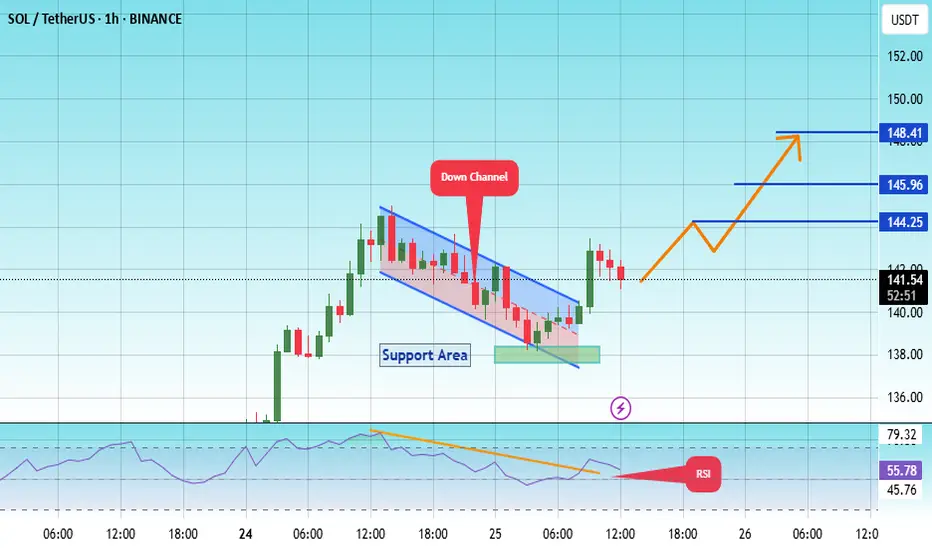
#SOL/USDT#SOL
The price is moving within a descending channel on the 1-hour frame, adhering well to it, and is heading for a strong breakout and retest.
We are seeing a bounce from the lower boundary of the descending channel, this support at 138.
We have a downtrend on the RSI indicator that is about to be broken and retested, supporting the upward trend.
We are looking for stability above the 100 moving average.
Entry price: 142
First target: 144
Second target: 146
Third target: 148
#SOL/USDT#SOL
The price is moving within a descending channel on the 1-hour frame and is expected to continue lower.
We have a trend to stabilize below the 100 moving average once again.
We have a downtrend on the RSI indicator that supports the upward move with a break above it.
We have a resistance area at the upper limit of the channel at 127.
Entry price: 126
First target: 124
Second target: 122
Third target: 119

Solana H4 | Potential bearish breakoutSolana (SOL/USD) is falling towards a potential breakout level where the price could fall lower from here.
Sell entry is at 144.76 which is a potential breakout level.
Stop loss is at 155.00 which is a level that sits above a multi-swing-high resistance.
Take profit is at 122.72 which is an overlap support that aligns close to the 50.0% Fibonacci retracement.
High Risk Investment Warning
Trading Forex/CFDs on margin carries a high level of risk and may not be suitable for all investors. Leverage can work against you.
Stratos Markets Limited (tradu.com):
CFDs are complex instruments and come with a high risk of losing money rapidly due to leverage. 63% of retail investor accounts lose money when trading CFDs with this provider. You should consider whether you understand how CFDs work and whether you can afford to take the high risk of losing your money.
Stratos Europe Ltd (tradu.com):
CFDs are complex instruments and come with a high risk of losing money rapidly due to leverage. 63% of retail investor accounts lose money when trading CFDs with this provider. You should consider whether you understand how CFDs work and whether you can afford to take the high risk of losing your money.
Stratos Global LLC (tradu.com):
Losses can exceed deposits.
Please be advised that the information presented on TradingView is provided to Tradu (‘Company’, ‘we’) by a third-party provider (‘TFA Global Pte Ltd’). Please be reminded that you are solely responsible for the trading decisions on your account. There is a very high degree of risk involved in trading. Any information and/or content is intended entirely for research, educational and informational purposes only and does not constitute investment or consultation advice or investment strategy. The information is not tailored to the investment needs of any specific person and therefore does not involve a consideration of any of the investment objectives, financial situation or needs of any viewer that may receive it. Kindly also note that past performance is not a reliable indicator of future results. Actual results may differ materially from those anticipated in forward-looking or past performance statements. We assume no liability as to the accuracy or completeness of any of the information and/or content provided herein and the Company cannot be held responsible for any omission, mistake nor for any loss or damage including without limitation to any loss of profit which may arise from reliance on any information supplied by TFA Global Pte Ltd.
The speaker(s) is neither an employee, agent nor representative of Tradu and is therefore acting independently. The opinions given are their own, constitute general market commentary, and do not constitute the opinion or advice of Tradu or any form of personal or investment advice. Tradu neither endorses nor guarantees offerings of third-party speakers, nor is Tradu responsible for the content, veracity or opinions of third-party speakers, presenters or participants.

SOL/USDT:BUYHello friends
Due to the price correction, we can buy in two specified areas in a stepwise manner, with capital and risk management.
*Trade safely with us*

SOLUSDT SOLUSDT Analysis 📊
🔹 Support Levels: 118, 112, and 107 USD
🔹 Resistance Levels: 130 and 150 USD
✅ The price has reacted positively after testing the 118-112 USD support zone, showing a short-term bullish move with increasing volume.
📉 If the price fails to break 130 USD, a pullback to 118 USD is possible.
📈 A breakout above 130 USD could pave the way for a move toward 150 USD.
🔍 Conclusion: The bullish trend remains unconfirmed until 130 USD is broken.

Sol Extremely Bullish FractalHi
Please click like
So this is as fractal from previous bull run in 2021, and used the same fibonacci targets for this bull run.
The chart here is SOLBTC, so if peak on this chart is 0.01BTC and BTC today is 100K =
SOL 1k.
If BTC peak is 200K -> Sol is 2K... etc.
----
This is a dreamy target, but it is in my opinion important to have some extreme targets.
I have been in crypto for 7 years, and havent we all seen extreme things happen ?
Perhaps this could be possible with SOL "eth killing" and taking the coin nr 2 place ?
Watch below some other SOL vs ETH ideas. It looks.. possible..
Or ? What do you think ?

SOLANA WILL RETURNCurrently, SOL is moving in bottom sides of a trendline which is not broken yet.
Despite being full of liquidity, this trendline for SOL might be the best opportuinty to buy for long term.
As long as the level 60$ is not broken, SOL will rise for a new all time high.
Remember, The Ecosystem of Solana build on casino. Gambler always return.
If SOL closes below the level of 60$ in weekly timeframe, the analysis is invalid and you can assume that SOL is diving through a bearish season.

SOLUSDT heading towards resistance 180SOLUSDT has bounce from monthly support MS1. A weekly support marked as WS1 on the chart is also sitting just above it. Therefore, this zone 95-110 was a confluece of these support levels and a bounce was justified. Now the price is heading towards weekly resistance which is sitting around 165-180 zone. However, it is facing daily resistance DR1 and currently pushing there. With a bit of struggle, it shall pierce through this DR1 resisatnce to head towards weekly resistance. And exactly above that weekly resistance, monthly resistance MR1 is also sitting with zone 180-200. Therefore, this is a confluence of the resistances and will cause the upward movement of the price to stall there and cause some push back. Lets see how it reacts there but if in long some profit taking on that resistance confluence zone is definitely a rational behavior.

SOL/USD "Solana vs U.S Dollar" Crypto Heist Plan (Swing / Day)🌟Hi! Hola! Ola! Bonjour! Hallo! Marhaba!🌟
Dear Money Makers & Robbers, 🤑 💰💸✈️
Based on 🔥Thief Trading style technical and fundamental analysis🔥, here is our master plan to heist the SOL/USD "Solana vs U.S Dollar" Crypto Market. Please adhere to the strategy I've outlined in the chart, which emphasizes long entry. Our aim is to escape near the high-risk Blue ATR Line. Risky level, overbought market, consolidation, trend reversal, trap at the level where traders and bearish robbers are stronger. 🏆💸"Take profit and treat yourself, traders. You deserve it!💪🏆🎉
Entry 📈 : "The vault is wide open! Swipe the Bullish loot at any price - the heist is on!
however I advise to Place buy limit orders within a 15 or 30 minute timeframe nearest or swing low or high level for pullback entries.
Stop Loss 🛑:
📍 Thief SL placed at the recent/swing low level Using the 4H timeframe (120.00) Day/Swing trade basis.
📍 SL is based on your risk of the trade, lot size and how many multiple orders you have to take.
🏴☠️Target 🎯: 168.00 (or) Escape Before the Target
🧲Scalpers, take note 👀 : Only scalp on the Long side. If you have a lot of money, you can go straight away; if not, you can join swing traders and carry out the robbery plan. Use trailing SL to safeguard your money 💰.
💰💵💸SOL/USD "Solana vs U.S Dollar" Crypto Market Heist Plan (Day / Swing Trade) is currently experiencing a bullishness,., driven by several key factors.☝☝☝
📰🗞️Get & Read the Fundamental, Macro, COT Report, On Chain Analysis, Sentimental Outlook, Intermarket Analysis, Future trend targets.. go ahead to check 👉👉👉🔗
⚠️Trading Alert : News Releases and Position Management 📰 🗞️ 🚫🚏
As a reminder, news releases can have a significant impact on market prices and volatility. To minimize potential losses and protect your running positions,
we recommend the following:
Avoid taking new trades during news releases
Use trailing stop-loss orders to protect your running positions and lock in profits
💖Supporting our robbery plan 💥Hit the Boost Button💥 will enable us to effortlessly make and steal money 💰💵. Boost the strength of our robbery team. Every day in this market make money with ease by using the Thief Trading Style.🏆💪🤝❤️🎉🚀
I'll see you soon with another heist plan, so stay tuned 🤑🐱👤🤗🤩

SOL/USDT:SIGNALHello friends
According to the price growth we had, you can see that the price is in a range and now, as it approaches the ceiling of the range, if it manages to break our channel, it can move to the specified targets.
*Trade safely with us*

SOLUSDT - Trade LogSOLUSDT – Long Setup in Daily FVG
Entry: Buy at 124 USDT (floor of the daily Fair Value Gap)
Stop Loss: 105 USDT (just below the daily FVG low)
Take Profit: 200 USDT (new all‑time highs)
Rationale:
• Price is retracing into the daily FVG, offering a high‑probability support zone
• Daily RSI double divergence & trendline support reinforce the FVG floor
• Spot accumulation targeting euphoria phase—leveraging the FVG for entry
Risk Management: Risk ~5% of account. If SOL closes below 105 USDT (invalidating the FVG), exit and reassess. Keep an eye on BTC direction as the primary driver.

Solana SOL Reveals The Manipulator's Plan!Hello, Skyrexians!
It's time to update BINANCE:SOLUSDT analysis. We have already told about Solana dump when price was next to $300 where told about $110 and as usual did not count last wave, but anyway bounce from this area was anticipated. What is next?
Recent top was the wave 5 of higher degree, we have shown it many times, today no need to do it again. Now asset is in ABC correction. Wave A was 5 waves shaped. Last wave has been finished with the green dot on the Bullish/Bearish Reversal Bar Indicator and now we are in the wave B. It has the target at 0.5-0.61 Fibonacci which is somewhere next to $200. From there we expect the huge crash below $90 in the wave C. Solana potential dump is not cancelling potential altseason on OTHERS.D because it's in top-10 crypto cap assets. May be it's time to transfer money from overvalued SOL to undervalued crypto?
Best regards,
Skyrexio Team
___________________________________________________________
Please, boost this article and subscribe our page if you like analysis!

Pengu Shortwe are only a few 100'drenths away from zero , so im pretty sure, we going to go all the way down to zero and then maybe bounce back.
but the zero will come before the falling wedge pattern plays out ;) !!
and tariffs- !!

Solana Climbs Amid Institutional Investments and ETF Backing Solana (SOL) has climbed to $134.35, marking a 0.89% gain over the last 24 hours and an impressive 20.39% increase over the past week. Its market capitalization now stands at $69.37 billion. Although 24-hour trading volume has declined by 14.73%, settling at $3.71 billion, bullish sentiment continues to build around the asset.
Institutional interest has intensified. Real estate fintech company Janover recently added over $10 million in SOL to its treasury. With more than 163,000 SOL now under management, Janover is following a similar strategy to MicroStrategy’s Bitcoin approach — buying, staking, and holding long-term. This move reinforces growing trust in Solana’s infrastructure and staking rewards.
Support for Solana also extends to regulated investment channels. Canadian institutions have backed Solana-based ETFs, adding another layer of credibility. These developments suggest that SOL is transitioning from a speculative asset to a longer-term investment holding.
Technical Analysis
On the chart, Solana recently broke structure (BOS) to the downside, indicating a growing bearish momentum. However, price found support and bounced off after recording a low of $95. Currently, the price is trading towards a high at $147. If it breaks above the the resistance, the price could extend toward $180, with potential continuation. Alternatively, if the breakout fails, a retest of the $110 zone may follow. The volume remains moderate, signaling cautious participation.
The recent bullish activity aligns with institutional accumulation and ETF exposure. Key levels to watch include $110 as support and $147 high as near-term resistance. A sustained move, break and close above $147 may confirm the next bullish leg for Solana.

Trading opportunity for SOLUSDTBased on technical factors there is a Sell position in :
📊 SOLUSDT
🔴 Sell Now
🪫Stop loss 151.00
🔋Target 97.00
📏 R/R 2
💸RISK : 1%
We hope it is profitable for you ❤️
Please support our activity with your likes👍 and comments📝

Solana H4 | Rising toward a swing-high resistanceSolana (SOL/USD) is rising towards a swing-high resistance and could potentially reverse off this level to drop lower.
Sell entry is at 144.76 which is a swing-high resistance.
Stop loss is at 154.00 which is a level that sits above a multi-swing-high resistance.
Take profit is at 122.98 which is an overlap support.
High Risk Investment Warning
Trading Forex/CFDs on margin carries a high level of risk and may not be suitable for all investors. Leverage can work against you.
Stratos Markets Limited (tradu.com):
CFDs are complex instruments and come with a high risk of losing money rapidly due to leverage. 63% of retail investor accounts lose money when trading CFDs with this provider. You should consider whether you understand how CFDs work and whether you can afford to take the high risk of losing your money.
Stratos Europe Ltd (tradu.com):
CFDs are complex instruments and come with a high risk of losing money rapidly due to leverage. 63% of retail investor accounts lose money when trading CFDs with this provider. You should consider whether you understand how CFDs work and whether you can afford to take the high risk of losing your money.
Stratos Global LLC (tradu.com):
Losses can exceed deposits.
Please be advised that the information presented on TradingView is provided to Tradu (‘Company’, ‘we’) by a third-party provider (‘TFA Global Pte Ltd’). Please be reminded that you are solely responsible for the trading decisions on your account. There is a very high degree of risk involved in trading. Any information and/or content is intended entirely for research, educational and informational purposes only and does not constitute investment or consultation advice or investment strategy. The information is not tailored to the investment needs of any specific person and therefore does not involve a consideration of any of the investment objectives, financial situation or needs of any viewer that may receive it. Kindly also note that past performance is not a reliable indicator of future results. Actual results may differ materially from those anticipated in forward-looking or past performance statements. We assume no liability as to the accuracy or completeness of any of the information and/or content provided herein and the Company cannot be held responsible for any omission, mistake nor for any loss or damage including without limitation to any loss of profit which may arise from reliance on any information supplied by TFA Global Pte Ltd.
The speaker(s) is neither an employee, agent nor representative of Tradu and is therefore acting independently. The opinions given are their own, constitute general market commentary, and do not constitute the opinion or advice of Tradu or any form of personal or investment advice. Tradu neither endorses nor guarantees offerings of third-party speakers, nor is Tradu responsible for the content, veracity or opinions of third-party speakers, presenters or participants.

DeGRAM | SOLUSD Testing the Demand Zone📊 Technical Analysis
Support and Uptrend
SOL/USDT has formed higher lows along the uptrend line and is now testing the $120-125 support area.
Resistance area
Key resistance is at $135; a breakout could trigger an acceleration of the upside.
Outlook Scenario
Price may retest the $135 level in the near term, with bullish momentum strengthening.
💡 Fundamental Analysis
Solana is gaining momentum thanks to growing DeFi volume and high developer activity, which boosts investor confidence.
✨ Summary
Technical and fundamental signals coincide - watch $135 for breakout confirmation.
-------------------
Share your opinion in the comments and support the idea with a like. Thanks for your support!

Give me some energy !!!The price has broken the wedge, and in my opinion, it could form a head and shoulders pattern before experiencing significant growth.
Give me some energy !!
✨We spend hours finding potential opportunities and writing useful ideas, we would be happy if you support us.
Best regards CobraVanguard.💚
_ _ _ _ __ _ _ _ _ _ _ _ _ _ _ _ _ _ _ _ _ _ _ _ _ _ _ _ _ _ _ _
✅Thank you, and for more ideas, hit ❤️Like❤️ and 🌟Follow🌟!
⚠️Things can change...
The markets are always changing and even with all these signals, the market changes tend to be strong and fast!!

SOL throwback short setup formingShort Entry : 133
TP : 122
SL : 136.5
My trading is based on momentum, and the chart said that SOL is going to retest the previous 4H breakout resistance.

#SOL/USDT#SOL
The price is moving within a descending channel on the 1-hour frame, adhering well to it, and is heading for a strong breakout and retest.
We are experiencing a rebound from the lower boundary of the descending channel, which is support at 95.
We are experiencing a downtrend on the RSI indicator, which is about to break and retest, supporting the upward trend.
We are looking for stability above the 100 moving average.
Entry price: 108.50
First target: 114.06
Second target: 119
Third target: 127
