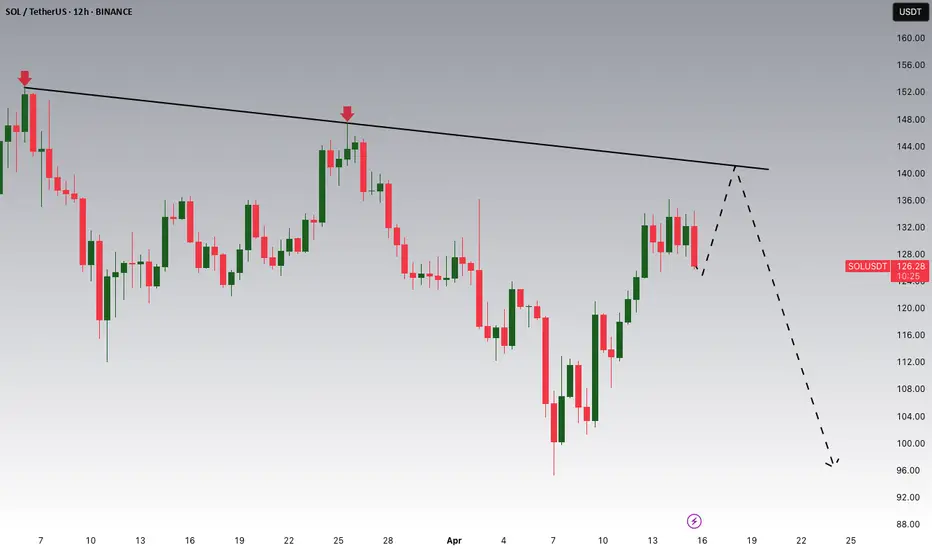
Trading opportunity for SOLUSDTBased on technical factors there is a Sell position in :
📊 SOLUSDT
🔴 Sell Now
🪫Stop loss 151.00
🔋Target 97.00
📏 R/R 2
💸RISK : 1%
We hope it is profitable for you ❤️
Please support our activity with your likes👍 and comments📝
Solusdt

Give me some energy !!!The price has broken the wedge, and in my opinion, it could form a head and shoulders pattern before experiencing significant growth.
Give me some energy !!
✨We spend hours finding potential opportunities and writing useful ideas, we would be happy if you support us.
Best regards CobraVanguard.💚
_ _ _ _ __ _ _ _ _ _ _ _ _ _ _ _ _ _ _ _ _ _ _ _ _ _ _ _ _ _ _ _
✅Thank you, and for more ideas, hit ❤️Like❤️ and 🌟Follow🌟!
⚠️Things can change...
The markets are always changing and even with all these signals, the market changes tend to be strong and fast!!

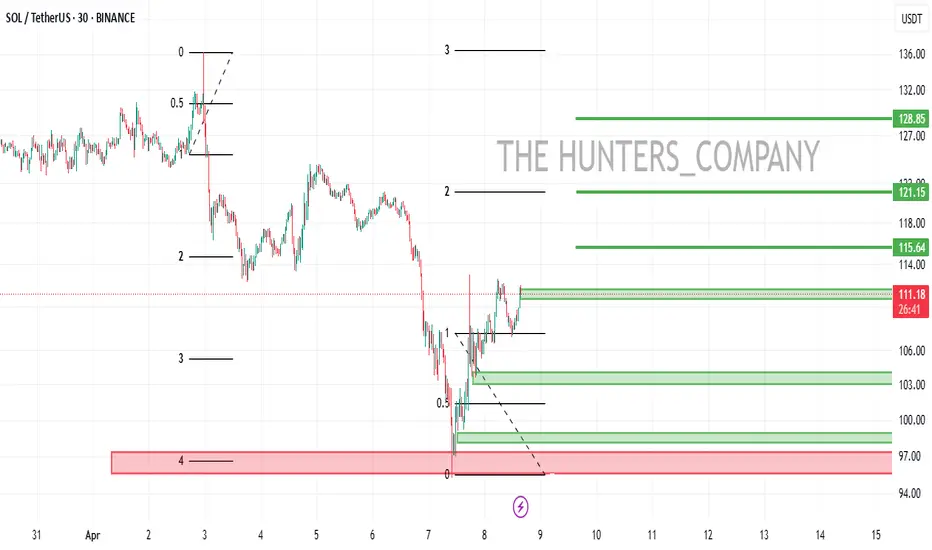
SOL throwback short setup formingShort Entry : 133
TP : 122
SL : 136.5
My trading is based on momentum, and the chart said that SOL is going to retest the previous 4H breakout resistance.

#SOL/USDT#SOL
The price is moving within a descending channel on the 1-hour frame, adhering well to it, and is heading for a strong breakout and retest.
We are experiencing a rebound from the lower boundary of the descending channel, which is support at 95.
We are experiencing a downtrend on the RSI indicator, which is about to break and retest, supporting the upward trend.
We are looking for stability above the 100 moving average.
Entry price: 108.50
First target: 114.06
Second target: 119
Third target: 127

Solana Potential DownsidesHey Traders, in today's trading session we are monitoring Solana for a selling opportunity around 140 zone, SOLUSDT is trading in a downtrend and currently is in a correction phase in which it is approaching the trend at 140 support and resistance area.
Trade safe, Joe.
MDTUSDT UPDATEMDT/USDT Technical Setup
Pattern: Falling Wedge Breakout
Current Price: $0.02544
Target Price: $0.0586
Target % Gain: 150.48%
Technical Analysis: MDT has broken out of a falling wedge on the 1D chart with a strong bullish candle and an 11.82% daily gain, confirming momentum. Breakout volume and candle close above resistance support further upside.
Time Frame: 1D
Risk Management Tip: Always use proper risk management.

SOL Bulls Strike Back — But Is It Sustainable?Solana continues to respect technicals with precision — after a +42.9% move from the $95 low, we're now at a pivotal moment in price structure. Let’s break down what’s happening and where the high-probability setups lie.
📍 Key Bounce Zone – Golden Pocket Confluence
Local Low: $95.26
Golden Pocket Zone (0.618–0.666): $97.09–$94.82
This area acted as a major demand zone, with price sharply rebounding.
First Volume Spike: Followed by retracement into Golden Pocket Zone at $102.
Second Volume Spike: Occurred right after touching Anchored VWAP ($108.21) from the $95.26 low, which added beautiful confluence with the Golden Pocket Zone – a secondary high-conviction long entry.
📈 Rally to Resistance – Short-Term Climax
After the anchored VWAP retest, SOL rallied into the key resistance zone aligned with the 0.786 Fib retracement from the previous down move — a historically reactive level and a prime profit-taking zone.
Monthly 21 EMA ($135.83) and the monthly 21 SMA ($133) — both key dynamic resistance zones.
Low-volume retest of that key high suggests buyer exhaustion, not continuation — a classic setup for a short-term reversal.
🧭 Current Market Structure
Current Price Action: Trading above both the weekly open ($128.38) and the monthly open ($124.54).
This forms a critical S/R zone between $124–$128, now acting as a potential battleground for bulls and bears.
As long as price stays above this zone, momentum remains with the bulls.
🔍 What to Watch Next – Reclaim or Reject?
Key Support to Watch:
$125 (psychological level) and monthly open at $124.54 – This zone is likely to be liquidity-hunted. Expect a sweep of this low, look for the reaction.
Daily Support Confluence: currently at 21 EMA: $123.77 & 21 SMA: $123.27
1.) 📈 Scenario A – Bullish Reclaim:
If SOL sweeps the low and shows strong buying reaction (bullish engulfing candle, volume spike), it sets up a potential long opportunity towards the weekly open, to watch for the next reaction.
2.) 📉 Scenario B – Failed Hold:
If there's no bullish reaction at $124–$125, expect further downside.
First target = $122
Second target = $120.65
🎯 Tactical Game Plan
Bulls:
Watch for reaction at $124–$125 – potential scalp long with tight SL.
Confirmation on volume expansion and break of $128.38 for continuation.
Re-enter long after clean retest of weekly open from above.
Bears:
Short setup possible if weekly/monthly open is broken and retested as resistance.
First TP = $122, second TP = $120.65.

SOLUSDT Holding Support, Targeting $150BINANCE:SOLUSDT bounced perfectly from the 0.618 Fib level and is now testing resistance. A small dip back to support is possible, but if $110 holds, we could see a strong move toward $150. Compared to other altcoins, SOLUSDT is showing real strength. Once the tariff noise clears, this could be one of the top performers. Always manage risk and set your stop loss!
BINANCE:SOLUSDT Currently trading at $118
Buy level: Above $112.5
Stop loss: Below $100
Target : $150
Max Leverage 3x
Always keep Stop loss
Follow Our Tradingview Account for More Technical Analysis Updates, | Like, Share and Comment Your thoughts

SOL USD LONG IdeaBased on a fibonacci speed fam from the all time low to all time high along with a fibonacci retracement both point out that the price has retraced down to the golden pocket areas. Based on the supoort holding, along with other indicators I'm using points out a very likely move to the upside of ~20%.

SOL/USDT:BUY...Hello friends
Due to the heavy price drop we had, the market fell into fear and at the specified support, buyers supported the price, which is a good sign that we should buy within the support ranges with capital and risk management and move with it to the specified targets.
Always buy in fear and sell in greed.
*Trade safely with us*
EHT/USDT:BUY...Hello friends
Due to the heavy price drop we had, the market fell into fear and at the specified support, buyers supported the price, which is a good sign that we should buy within the support ranges with capital management and move with it to the specified targets.
(Always buy in fear and sell in greed)
*Trade safely with us*

SOL/USDT – Potential Final Leg Down Before Major RallyBINANCE:SOLUSDT 🚀📉🔁
We are likely approaching one of the final moves down before a significant push higher. But before that, I expect one last move up to the $142 area, forming what I believe is a Red ABC corrective structure.
🔴 Red Wave A-B-C
Red Wave A has likely already completed, confirmed by a clean White ABC move.
We are now inside Red Wave B.
✅ Ideal Long Entry Zone
The ideal entry would be near the 88.7% Fibonacci retracement, which aligns with Green Wave B around $119.4.
From that level, I expect a drop down toward $100, completing Red Wave B.
🔄 What Comes After?
From the $100 zone, two possible scenarios for Red Wave C (or Wave 1 of a new impulse):
A 1-2-3-4-5 impulsive wave structure to the upside
Or a corrective A-B-C structure
We’ll need to carefully watch the first move out of the $100 zone:
A 5-wave move would suggest a new bullish impulse has begun
A 3-wave move might just be a larger corrective rally
🎯 Upside Target: $142
Once we hit $142, I anticipate another corrective move downward.
This could take the form of:
A clean ABC
A complex correction (A-B + 1-2-3-4-5)
Or even a direct impulsive 5-wave drop
Again, the key is watching the first leg down from $142 – whether it's impulsive or corrective will define the entire next phase.
⚠️ Summary:
Current focus: Entry near $119.4 (88.7% Fib), targeting $142
Caution: Expect volatility – structure will only become clear wave by wave
Watch: Reactions at $100 and $142 for structure confirmation
Let me know what you think below!
Like & follow if you enjoy deep EW breakdowns!

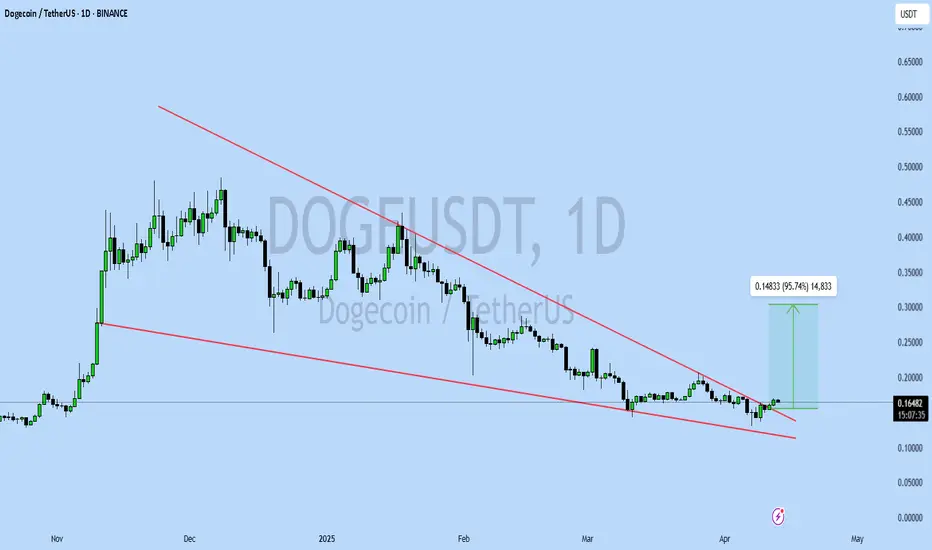
DOGEUSDT UPDATEDOGEUSDT is a cryptocurrency trading at $0.16485, with a target price of $0.30000. This represents a potential gain of over 90%. The technical pattern observed is a Bullish Falling Wedge, indicating a possible trend reversal. This pattern suggests that the downward trend may be coming to an end. A breakout from the wedge could lead to a significant upward movement in price. The Bullish Falling Wedge is a positive indicator, signaling a potential price surge. Investors are showing optimism about DOGEUSDT's future performance. The current price may present a buying opportunity. Reaching the target price would result in substantial returns for investors. DOGEUSDT is positioned for a potential breakout and significant gains.
CLAIM your SOUL for SOL!As analysed, the doodle says this, go for it? or let that short slowly chuck you to liquidation?

SOL preppin for a 300 revisit from this 100 bargain zone. SEED!SOL has been on rollercoaster ride the past few months -- going from 100 to almost 300 in a zoom when the market is at its peak.
Moreso, when memes started taking over the market and everyone, including the president himself is launching one on SOL blockchain, market started pickup up pace and eliciting euphoria among all, albeit momentarily. It has stirred up some hype and frenzy skyrocketing prices only to be met with so much saturation and gravity, then the BIG BLEED happens.
After a few weeks thing seem to have settled down -- a shift is gradually transpiring as we speak. SOL is now exhibiting some basing behavior at this current range at 100 levels. Net longs has started to pile up around this zone conveying a prep work of upside reversal soon.
Long term metrics suggests a tap at 61.8 FIB levels - a buyers convergence zone. This is where it all starts.
Ideal seeding is at the current discounted price range.
Spotted at 110
Mid target 300.
Long term 500.
TAYOR. Trade safely.

Solana Surges Nearly 8% As Janover Pivots to Solana Treasury The price of Solana ( CRYPTOCAP:SOL ) famously known as the ethereum killer has surged nearly 8% today as Commercial property platform Janover pivots to Solana treasury strategy, stock surges 1,100% as investors rush in prior the news.
Janover has invested over $9.6 million into Solana (83,000+ SOL) as part of a new digital asset treasury strategy, with plans to stake its holdings and run validators to generate onchain revenue.
The move follows a $42 million funding round and has triggered a 1,100% surge in Janover’s stock price as the company positions itself as a transparent, publicly traded vehicle for crypto exposure.
Solana has lost grip of the $120 pivot for the past 2 weeks, but reclaimed the zone today currently trading at $120.54 per $SOL.
The daily price chart shows Solana has been trading within an enclose rectangular zone with the Resistant and support points slightly above each other. For Solana, a break above the $170 zone could pave way for a move to the $200- $270 zone. Similarly, a break below the $100 zone could be catastrophic for Solana.
However, the RSI shades a bit of a light at the end of the tunnel as it stands at 47, which is prime for a reversal.

Solana Update: To Buy Or Not To Buy? Hold Or Sell?Here is an update on Solana.
The chart has the same numbers as before but the support line has been moved to match the 5-August 2024 low. The action is happening right above this level.
While Solana trades above its August 2024 low, the action is considered bullish. Below this level and we are certainly bearish. Being bearish in this way does not change the long-term outlook, bias and perspective, we are set to grow long-term based on a broader trend and bigger cycle. This is a closer look.
The low in April is a shy lower low compared to March. This is always important. Notice the steep decline. This is a bearish impulse, prices tend to move down fast and strong. When bearish momentum starts to die down, we see patterns like the one we have on the chart above. Some shaky action and then a lower or higher low. The market (SOLUSDT) is preparing to change course.
The correction is present since November 2024. For Solana, the higher high in January 2025 is part of a complex correction, an extended flat. 3-3-5 wave in Elliott terms.
This is irrelevant. The point is that once the correction is over prices tend to grow.
Consider this, between June and September 2024 we have more than three months of consolidation. The market garnered enough strength to produce a bullish wave. It took a while but it happened. Then there is a correction and this bullish wave was erased by more than 100%.
If buyers showed up at a price of $100, $120, $130 and even $150 in the past, they can definitely show up again. Now that the bullish move has been erased, we are back to square one, the starting point, the base; from this point forward Solana can grow again.
Solana looks weak right now on the very, very short-term. But do not let this deceive you, we are going up next. Focus on the long-term.
Accumulation can be done each time prices hit support.
What happens if I buy and prices move lower?
Wait patiently. If you have capital available, buy more.
And if it drops again? Keep waiting, continue buying.
You will be happy with the results once the market turns.
Thank you for reading.
Patience is absolutely key.
If you didn't sell at $290, $280 or $250, why would you sell when prices trade at $100? It makes no sense.
Buy when prices are low and hold.
Only sell when prices are moving higher.
Namaste.

SOLUSDT 1DSOL ~ 1D Analysis
#SOL Buy gradually after successfully penetrating this resistant line with a short -term target of at least 10%+.

SOL LONG????🔍 Overall Market Structure
The price recently saw a sharp drop from the $120.69 high and is currently consolidating around the $108–110 area.
A bullish structure is forming, suggested by the potential for a reversal pattern from a support zone.
🧠 Key Technical Components
📉 Fibonacci Levels (retracement from $101.21 to $120.69):
0.236 – $115.78 (resistance)
0.382 – $112.84
0.5 – $110.53
0.618 – $108.25 ← Current support
0.786 – $105.20
Price is bouncing from the 0.618 zone, a strong reversal area.
🟣 RSI (Relative Strength Index):
RSI is near oversold (31.15) and showing bullish divergence:
Price made lower lows.
RSI made higher lows.
This divergence suggests momentum is weakening on the downside, signaling a potential bullish reversal.
🟪 Support & Resistance Zones:
Demand Zone (support) around $107–108 (marked with purple box).
Supply Zone (resistance) around $118–120.
Price could bounce from support, targeting higher fib levels and possibly retesting the supply zone.
✏️ Projected Price Action (Black Curve):
Anticipated short-term reversal from $108.
Price might climb through:
$110 (0.5 fib)
$112.84 (0.382 fib)
Potentially to $115.78 (0.236 fib) or even back to the $120.69 high.
Shown within a larger wedge structure, so upper trendline resistance around $120.
✅ Conclusion:
Bullish reversal likely from $107–108 support.
RSI divergence + Fibonacci confluence supports the reversal thesis.
Next targets: $110.50 → $112.84 → $115.78 with final resistance near $120.69.


TAOUSDT UPDATETAOUSDT is a cryptocurrency trading at $231.9, with a target price of $360.0. This represents a potential gain of over 60%. The technical pattern observed is a Bullish Falling Wedge, indicating a possible trend reversal. This pattern suggests that the downward trend may be coming to an end. A breakout from the wedge could lead to a significant upward movement in price. The Bullish Falling Wedge is a positive indicator, signaling a potential price surge. Investors are showing optimism about TAOUSDT's future performance. The current price may present a buying opportunity. Reaching the target price would result in substantial returns for investors. TAOUSDT is positioned for a potential breakout and significant gains.

SOL/USDT Wedge Breakout (08.04.2025)The SOL/USDT pair on the M30 timeframe presents a Potential Buying Opportunity due to a recent Formation of a Wedge Breakout Pattern. This suggests a shift in momentum towards the upside and a higher likelihood of further advances in the coming hours.
Possible Long Trade:
Entry: Consider Entering A Long Position around Trendline Of The Pattern.
Target Levels:
1st Resistance – 120.60
2nd Resistance – 130.63
🎁 Please hit the like button and
🎁 Leave a comment to support for My Post !
Your likes and comments are incredibly motivating and will encourage me to share more analysis with you.
Best Regards, KABHI_TA_TRADING
Thank you.

[Update SOL]: $170-->$75-->$500-->$40?Let's see some boring predictions here based on range trading and Fib extensions...lazy
