SOL Trade Plan: Daily Support, Liquidity Grab & Trade Idea.Solana (SOL) is currently navigating a challenging market environment, with broader sell-offs across the crypto space weighing heavily on its price action. On the daily and 4-hour timeframes, SOL has traded into a significant support zone, marked by previous swing lows. This area has historically acted as a magnet for buyers, but the recent dip below these levels suggests a liquidity grab is underway. This move has likely triggered sell stops sitting below the lows, creating the potential for a reversal as smart money steps in. ⚡
Zooming into the 15-minute timeframe, SOL is consolidating within a tight range, reflecting a period of indecision. This range-bound behavior often precedes a breakout, and a bullish break above the range could signal the start of a recovery. A shift in market structure—marked by higher highs and higher lows—would provide further confirmation of bullish intent.
Key Insights:
Daily Timeframe: SOL has dipped below key support levels, sweeping liquidity.
4-Hour Timeframe: Price is overextended, trading into a critical demand zone.
15-Minute Timeframe: Consolidation within a range, awaiting a breakout for directional clarity.
Trading Plan:
Patience is Key: Wait for SOL to break out of the 15-minute range to the upside. 🚀
Market Structure Confirmation: Look for a clear shift to bullish market structure (higher highs and higher lows). 📊
Entry Strategy: Enter long positions after confirmation, with a stop-loss placed below the range low. 🛡️
Profit Targets: Focus on resistance levels on the 4-hour and daily timeframes for potential take-profit zones. 🎯
Levels to Watch:
Support Zone: Previous daily swing lows, now acting as a liquidity zone.
Resistance Zone: The upper boundary of the 15-minute range and key levels on the 4-hour chart.
This setup highlights the importance of waiting for confirmation before entering a trade. While the liquidity grab below support is a promising signal, a breakout and bullish structure are essential to avoid false moves. As always, this is not financial advice—traders should conduct their own analysis and manage risk appropriately. ⚠️
Solusdt

The key is whether it can rise to around 136.74
Hello, traders.
If you "Follow", you can always get new information quickly.
Please also click "Boost".
Have a nice day today.
-------------------------------------
(SOLUSDT 1M chart)
In terms of Fibonacci ratio, the key is whether it can rise after receiving support near 0.5 (98.71).
In order to continue the uptrend, the price must be maintained above the M-Signal indicator on the 1M chart.
Accordingly, we need to see whether it can rise above 136.92 and receive support.
If not, and it falls, you should go up again and check if it is supported near the Fibonacci ratio 0.5 (98.71) or if the HA-Low indicator on the 1M chart is generated, and then create a trading strategy.
-
(1D chart)
Therefore, if possible, it is more important to check if it is supported near the HA-Low indicator on the 1D chart, that is, near 136.74.
-
Fibonacci ratio 0.5 (98.71) should be interpreted as having an important meaning because it is in the middle of the overall chart.
Fibonacci ratio is a chart tool that helps with chart analysis, but it is not recommended to trade with it.
-
(30m chart)
The indicator that can create a trading strategy on my chart is the HA-Low, HA-High indicator.
Therefore, you can create a trading strategy by looking at the movement of the HA-Low, HA-High indicator formed on the time frame chart that you mainly view and trade.
-
Thank you for reading to the end.
I hope you have a successful trade.
--------------------------------------------------
- This is an explanation of the big picture.
I used TradingView's INDEX chart to check the entire range of BTC.
I rewrote it to update the previous chart while touching the Fibonacci ratio range of 1.902(101875.70) ~ 2(106275.10).
(Previous BTCUSD 12M chart)
Looking at the big picture, it seems to have been following a pattern since 2015.
In other words, it is a pattern that maintains a 3-year bull market and faces a 1-year bear market.
Accordingly, the bull market is expected to continue until 2025.
-
(Current BTCUSD 12M chart)
Based on the currently written Fibonacci ratio, it is displayed up to 3.618 (178910.15).
It is expected that it will not fall again below the Fibonacci ratio of 0.618 (44234.54).
(BTCUSDT 12M chart)
I think it is around 42283.58 when looking at the BTCUSDT chart.
-
I will explain it again with the BTCUSD chart.
The Fibonacci ratio ranges marked in the light green boxes, 1.902 (101875.70) ~ 2 (106275.10) and 3 (151166.97) ~ 3.14 (157451.83), are expected to be important support and resistance ranges.
In other words, it seems likely to act as a volume profile range.
Therefore, in order to break through this section upward, I think the point to watch is whether it can rise with support near the Fibonacci ratios of 1.618 (89126.41) and 2.618 (134018.28).
Therefore, the maximum rising section in 2025 is expected to be the 3 (151166.97) ~ 3.14 (157451.83) section.
To do that, we need to look at whether it can rise with support near 2.618 (134018.28).
If it falls after the bull market in 2025, we don't know how far it will fall, but considering the previous decline, we expect it to fall by about -60% to -70%.
So, if the decline starts near the Fibonacci ratio 3.14 (157451.83), it seems likely that it will fall to around Fibonacci 0.618 (44234.54).
I will explain more details when the downtrend starts.
------------------------------------------------------

Solana’s Critical Support at $120 - Will It Hold or Break?Solana has been respecting its $120 support level for over a year, consistently bouncing back every time it tested this zone. However, the price is now once again hovering around this crucial level after a small bounce a couple of weeks ago. The key question remains: will Solana hold this support and rally again, or is a major breakdown coming?
Weakening Support: A Bearish Signal?
When a price level is tested repeatedly, it often weakens as buyers at that level get exhausted. The most recent bounce from $120 was notably weak, indicating that buying pressure might be fading. This could be an early warning sign that sellers are gaining control, increasing the probability of a breakdown.
The $75 Scenario: What If Support Fails?
If Solana fails to hold $120, the next major support level sits around $75—a price zone where significant demand previously emerged. A breakdown could trigger a sharp move lower as stop-losses get triggered and bearish momentum accelerates.
Key Factors to Watch:
• Volume & Strength of the Current Test – Is buying volume picking up, or are sellers in control?
• Market Sentiment & Macro Trends – Broader crypto market trends, Bitcoin’s movement, and macroeconomic factors could influence Solana’s direction.
• False Breakouts & Traps – Sometimes, a brief break below support is a shakeout before a strong reversal. A reclaim of $120 after a breakdown could signal a bullish trap for shorts.
Final Thoughts
While $120 has been a strong floor for Solana, repeated tests make it more fragile. If buyers fail to step in with conviction, a drop toward $75 becomes a real possibility. However, if bulls defend this level strongly, we could see another bounce, potentially setting up a reversal.
Thanks for your support.
- Make sure to follow me so you don't miss out on the next analysis!
- Drop a like and leave a comment!

Crypto Sell-Off: Is Solana Headed for $80?Without a doubt, Solana was the hottest topic in the crypto market last year and at the start of this one—especially with the meme coin craze.
However, after peaking near $300, the price began to decline in what initially appeared to be a normal correction. But once Solana broke below the $200 mark, things turned ugly, and the price quickly dropped to the key $120 support zone—a level that held strong over the past year.
Now, it looks like Solana is on the verge of breaking below this support, which could trigger an acceleration toward $80, with the $100 psychological level as an intermediate stop.
________________________________________
Why the Downside is Likely to Continue
📉 Bulls Can’t Hold Gains – Short-term rallies are fading fast, showing a lack of real buying strength.
📉 Bearish Engulfing Candle – Yesterday’s price action printed a lower high, adding further pressure on support.
📉 $120 Breakdown Incoming? – If this level fails, expect a sharp decline toward $80.
________________________________________
Trading Plan: Selling Under $130
🔻 Sell Rallies Below $130 – Targeting a move to $80 in the medium term.
🔻 Only a Sustained Move Above $130 – Would shift Solana to a neutral stance—not bullish by any means.
For now, the bearish pressure remains, and selling rallies is the strategy to follow. 🚀

$SOL Breakdown Alert🚨 CRYPTOCAP:SOL Breakdown Alert! 🚨
Solana has broken down from a rising wedge pattern and is now targeting the Fair Value Gap (FVG) zone between $30–$50.
A potential -73% drop from recent highs could be on the table.
If support fails here, things could get brutal.
Stay cautious.

STRAXUSDT UPDATESTRAXUSDT is a cryptocurrency trading at $0.04440, with a target price of $0.07000. This represents a potential gain of over 80%. The technical pattern observed is a Bullish Falling Wedge, indicating a possible trend reversal. This pattern suggests that the downward trend may be coming to an end. A breakout from the wedge could lead to a significant upward movement in price. The Bullish Falling Wedge is a positive indicator, signaling a potential price surge. Investors are showing optimism about STRAXUSDT's future performance. The current price may present a buying opportunity. Reaching the target price would result in substantial returns for investors. STRAXUSDT is positioned for a potential breakout and significant gains.

SOL ANALYSIS🔮 #SOL Analysis 🚀🚀
💲💲 #SOL is trading in a Ascending Broadening Wedge Pattern and there is a breakdown of the pattern. And we can expect more bearish move towards it's support zone and the a reversal
💸Current Price -- $119.10
⁉️ What to do?
- We have marked crucial levels in the chart . We can trade according to the chart and make some profits. 🚀💸
#SOL #Cryptocurrency #DYOR

Short Position SOL/USDT#Singal
SOL/USDT
🔴 Short Position
🎲 Entry1 @ 123.75
🎲 Entry2 @ 125.12
✅ Target1@ 121.79
✅ Target2 @ 119.93
✅ Target3 @ 116.55
✅ Target4 @ 112.38
✅ Target5 @ 103.78
❌ Stop Loss @ 132.32
Leverage: 5X
Margin: 10% of Wallet Balance
⚠️"Take Care of Risk Management for Your Account"

ATOMUSDT UPDATEATOMUSDT is a cryptocurrency trading at $4.700, with a target price of $7.500. This represents a potential gain of over 60%. The technical pattern observed is a Bullish Falling Wedge, indicating a possible trend reversal. This pattern suggests that the downward trend may be coming to an end. A breakout from the wedge could lead to a significant upward movement in price. The Bullish Falling Wedge is a positive indicator, signaling a potential price surge. Investors are showing optimism about ATOMUSDT's future performance. The current price may present a buying opportunity. Reaching the target price would result in substantial returns for investors. ATOMUSDT is positioned for a potential breakout and significant gains.

PEPE/USDT:FREE SIGNALHello dear friends
Given the price drop we had in the specified support range, a double bottom pattern has formed, indicating the entry of buyers.
Now, given the good support of buyers for the price, we can buy in steps with capital and risk management and move to the specified targets.
*Trade safely with us*

ETH/USDT:UPDATEHello dear friends
Given the price drop we had, a head and shoulders pattern has formed within the specified support range, indicating the entry of buyers.
Now, given the good support of buyers for the price, we can buy in steps with capital and risk management and move towards the specified targets.
*Trade safely with us*

CRV/USDT: BUYHello dear friends
Due to the good price growth
Now we can buy in stages with capital and risk management and move towards the specified goals.
*Trade safely with us*

CFXUSDT UPDATECFXUSDT is a cryptocurrency trading at $0.0788, with a target price of $0.1400. This represents a potential gain of over 80%. The technical pattern observed is a Bullish Falling Wedge, indicating a possible trend reversal. This pattern suggests that the downward trend may be coming to an end. A breakout from the wedge could lead to a significant upward movement in price. The Bullish Falling Wedge is a positive indicator, signaling a potential price surge. Investors are showing optimism about CFXUSDT's future performance. The current price may present a buying opportunity. Reaching the target price would result in substantial returns for investors. CFXUSDT is positioned for a potential breakout and significant gains.

Solana Correction - Is a Drop to $60 Inevitable?After an explosive 200x rally, Solana surged from its all time low at $1 to a new all time high in 2021, followed by a correction to $10 in 2022. It then made another massive run to $250 in 2024.
Now, a double-top "M" pattern is forming, signaling a reversal. As shown on the chart, we could see a drop to $60.
What's your take - has the top been set, or do you disagree with the bearish outlook? Let me know your thoughts!
Kindly support this idea with a LIKE👍 if you find it useful🥳
Happy Trading💰🥳🤗

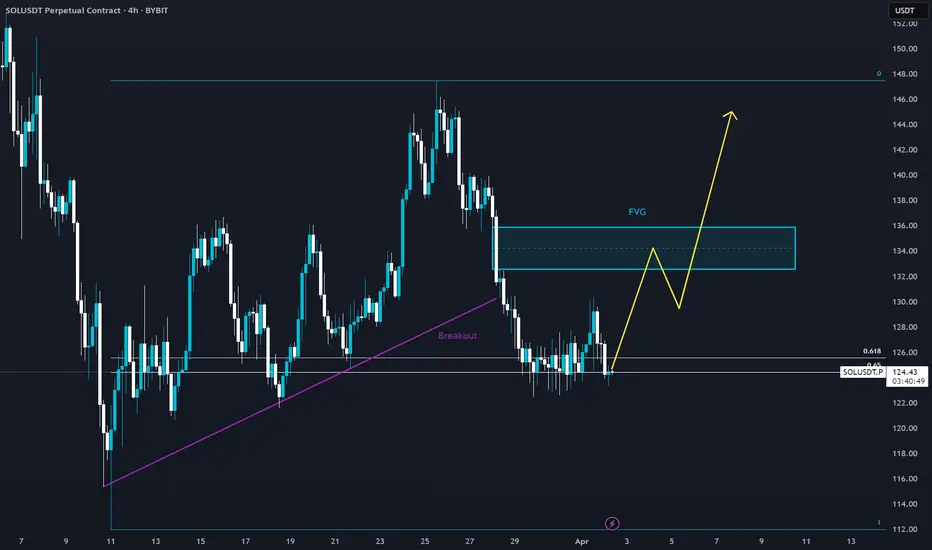
SOL - Breakout Retest & FVG Target This 4-hour SOL/USDT chart shows a breakout retest at a key support level, with a potential move toward the Fair Value Gap (FVG).
Key Observations:
🔹 Breakout & Retest: Price has broken below the trendline and is now stabilizing near support.
🔹 FVG Target: A bullish reaction from this level could send SOL toward the FVG before further continuation.
🔹 Potential Bullish Structure: A strong bounce could lead to higher highs, while failure to hold may invalidate the setup.
Will SOL confirm this bullish scenario? Let’s watch how it reacts! 📈🔥
SOLANA(UPDATE)Hello friends
Due to the heavy price drop, you can see that buyers are slowly entering and the price is creating a good ascending channel, which now provides a good opportunity to buy in stages and with capital management and move towards the specified goals.
Don't forget to save profit on each target.
*Trade safely with us*

SOLANA at key support zone - Is $160 within reach?BINANCE:SOLUSDT has reached a major support level, an area where buyers have previously shown strong interest. This zone has acted as a key zone, increasing the likelihood of a bounce if buyers step in.
A bullish confirmation, such as a strong rejection pattern, bullish engulfing candles, or long lower wicks, would strengthen the case for a move higher. If buyers take control, the price could rally toward the $160 target. However, a decisive breakdown below this support would invalidate the bullish scenario and could lead to further downside.
This isn’t financial advice, just my take on how I approach support and resistance zones. Best to wait for clear confirmation, like a strong rejection or a volume spike, before making a move.
Every trader has a unique perspective. Let’s discuss this setup within the TradingView community!

SOL/USD Technical Analysis (March 31, 2025)🔹 Potential Scenarios:
✅ Bullish Path (Green): If the price holds above the Golden Pocket (119.89 - 121.15) and breaks 147.38, it may continue rising toward 165-176 and possibly 201-210.
❌ Bearish Path (Red): A drop below 112.40 could push the price toward 109-119, and further breakdown may lead to 78-86 or even 51-57 in extreme cases.
🔄 Neutral/Alternative Path (Yellow): If support holds but no strong breakout occurs, the price may consolidate and later move in either direction.
💡 Key Levels to Watch:
Resistance: 147.38, 165-176, 201-210, 272+
Support: 119-121 (Golden Pocket), 112.40, 78-86, 51-57
📌 Keep an eye on price reactions at these levels to confirm the next move.

SOL | Accumulation Zones | BEST BUY ZONESSolana has topped out after its new ATH in January, and it has clearly marked the beginning of the bearish cycle since then.
The bearish-M pattern in quite significant in the weekly timeframe. ( More info on that pattern here, on the ETH chart ):
From a technical indicator perspective, we see a clear "sell" sign - a strong signal from a trend-based indicator:
Which every way we are heading down (stair step or pin drop), there are a few noteworthy zones to watch:
_______________________
BINANCE:SOLUSDT


Good r:r on alts.I have made market watch baded on indicator on main screen. It aggregate view on main alts. Fat dot is bullish. Thin coloured dot is signaling possible entry. Gray dot is bearish. No dot is just downtrend. Solid line is showing how market is performing. Now its valie is 1. In the recent past it was good place to enter long trades. Marked with yellow lines. Be aware. If this is entry into bear market there will be dead cat bouces so manage your risk.

Solana LongBulls need some motivation.
Major trend bearish,but short term bullish pullback.
Possibly it holds until APRIL 1st 2025-If Profit targets can not hold above daily support,then time to liquidate the positions, and get out earlier.

SOL/USDT – Key Support Test: Will It Hold or Break?#SOL/USDT #Analysis
Description
---------------------------------------------------------------
Solana (SOL) has been in a strong uptrend since late 2023, but recent price action suggests a key test of support around the $115–$135 zone. This level was previously a major resistance and is now being retested as support.
Moving Averages: The price has dipped below the shorter EMAs but is still above the long-term moving average.
Bearish Momentum: The recent sharp drop suggests selling pressure, but the support zone could lead to a reversal.
Two Scenarios:
🔼 Bullish: If the support holds, SOL could bounce back towards $180+ and continue its uptrend.
🔽 Bearish: If support breaks, a deeper correction to $43–$60 is possible.
📊 Trading Strategy
Long Entry: If a strong bounce occurs from the $115–$135 zone, targeting $180+.
Short Entry: A confirmed breakdown below $115 could trigger a move toward $60 or lower.
---------------------------------------------------------------
Enhance, Trade, Grow
---------------------------------------------------------------
Feel free to share your thoughts and insights. Don't forget to like and follow us for more trading ideas and discussions.
Best Regards,
VectorAlgo
