Solana SOL Weakness Continues: Is the Next Leg Lower Coming? 📉 Solana ⚡ is showing signs of weakness, maintaining a clear bearish trend on this 4H timeframe. Price action has traded into a key support zone, with a potential pullback offering an opportunity to enter short at a premium before the next leg lower 🔻.
If sellers remain in control, we could see a continuation to lower levels 📉.
⚠️ Not financial advice—always manage risk appropriately!
Solusdt

SOLUSDT - Move Down to Stronger Trend LineTrend Line in green is a good position for price to reverse in the bulls favor
This aligns well with the 0.786 fib line
As you can see it has broken down out of a small channel shown in the green dotted section
Weekly timeframe

SOL/USDT LONG SET UP (Solana)Entry 1 $120.00
Entry 2 $110.00
Stop loss $95.00
Take profit 1- $145.00
(Close 33%)
Take profit 2- $170.00
(Close 66%)
Take profit 3-$195.00
(Close 100%)

TAOUSDT UPDATETAOUSDT is a cryptocurrency trading at $263.8. Its target price is $360.0, indicating a potential 45%+ gain. The pattern is a Bullish Falling Wedge, a reversal pattern signaling a trend change. This pattern suggests the downward trend may be ending. A breakout from the wedge could lead to a strong upward move. The Bullish Falling Wedge is a positive signal, indicating a potential price surge. Investors are optimistic about TAOUSDT's future performance. The current price may be a buying opportunity. Reaching the target price would result in significant returns. TAOUSDT is poised for a potential breakout and substantial gains.

Fate of Solana As seen in this weekly candle size chart of #solusd i' ve explained all with balloons.
In 5 years period, #solana price has formed a huge bullish cup & handle pattern, but after relief rally has finished, #sol price heavily declined after completing the pattern. (X in the chart) Then, CRYPTOCAP:SOL failed the retest of the breakout zone that it accumulated more than 9 months. This was the 2nd bad declination.
And now, #solusdt is now testing weekly ichimoku cloud!.. This' one of the most important zone to be defended by the bulls. Losing this zone with weekly closings will be doom for the long term chart structure. So, must be defended at all costs to avoid bear season in mid term. Current situation is not safe for now.
For fully invalidation, #solusd must reclaim above 300 usd region with monthly close. Not financial advice. DYOR. (This' not a short term strategy)

For Solana, the $74-$110 range.For Solana, the $74-$110 range seems like a solid Spot entry point, with long-term targets of $800-$1000.
Why $74-$110? Because Coinbase has large limit buy orders set at $74 and $85 for Solana.
Waiting for the stock market and crypto market to drop.
The right moment to enter Spot is coming soon.

Will Solana drop 26% before finding support at $90?Hello and greetings to all the crypto enthusiasts, ✌
All previous targets were nailed ✅! Now, let’s dive into a full analysis of the upcoming price potential for Solana 🔍📈.
Solana remains in a downward channel, with a projected additional decline of at least 26% in the short term. A key support level at $90 is expected to be retested before any sustainable upward momentum can develop. The $100 mark serves as a significant psychological resistance, influencing market sentiment. Along the way, temporary bullish movements and short-lived green candles are natural fluctuations within the broader downtrend.📚🙌
🧨 Our team's main opinion is: 🧨
Solana is in a downtrend, likely dropping another 26% to retest $90, with $100 as key resistance, while brief upward moves are expected. 📚🎇
Give me some energy !!
✨We invest hours crafting valuable ideas, and your support means everything—feel free to ask questions in the comments! 😊💬
Cheers, Mad Whale. 🐋

Solana's important supporthello friends
Due to the heavy demand of Solana and the construction of new floors based on the market cycle, we expect a new floor within the specified range.
If we reach the support range of 105-110 dollars, we can buy with confirmation, of course, with capital management...
*Trade safely with us*

FIDAUSDT UPDATEFIDAUSDT is a cryptocurrency trading at $0.1094. Its target price is $0.2400, indicating a potential 100%+ gain. The pattern is a Bullish Falling Wedge, a reversal pattern signaling a trend change. This pattern suggests the downward trend may be ending. A breakout from the wedge could lead to a strong upward move. The Bullish Falling Wedge is a positive signal, indicating a potential price surge. Investors are optimistic about FIDAUSDT's future performance. The current price may be a buying opportunity. Reaching the target price would result in significant returns. FIDAUSDT is poised for a potential breakout and substantial gains.

OMUSDT UPDATEOMUSDT is a cryptocurrency trading at $6.2800. Its target price is $8.0000, indicating a potential 25%+ gain. The pattern is a Bullish Falling Wedge, a reversal pattern signaling a trend change. This pattern suggests the downward trend may be ending. A breakout from the wedge could lead to a strong upward move. The Bullish Falling Wedge is a positive signal, indicating a potential price surge. Investors are optimistic about OMUSDT's future performance. The current price may be a buying opportunity. Reaching the target price would result in significant returns. OMUSDT is poised for a potential breakout and substantial gains.

Solana Nears Key Support: Potential 25% Drop to $125 SoonHello and greetings to all the crypto enthusiasts, ✌
In several of my previous analyses, I have accurately identified and hit all of the gain targets. In this analysis, I aim to provide you with a comprehensive overview of the future price potential for Solana , 📚🎇
Solana is nearing a pivotal support level, which has previously proven strong. However, there are indications that this daily support may soon be breached, potentially triggering a decline of around 25% . Should this occur, the price target to watch would be $125, aligning with a key monthly support zone. This area has historically been a critical defense against further downturns, making it a crucial point in the current market analysis. 📚🙌
🧨 Our team's main opinion is: 🧨
Solana is approaching a key support level, and if it breaks, a 25% drop to $125—an important monthly support—could follow. 📚💡
Give me some energy !!
✨We invest countless hours researching opportunities and crafting valuable ideas. Your support means the world to us! If you have any questions, feel free to drop them in the comment box.
Cheers, Mad Whale. 🐋

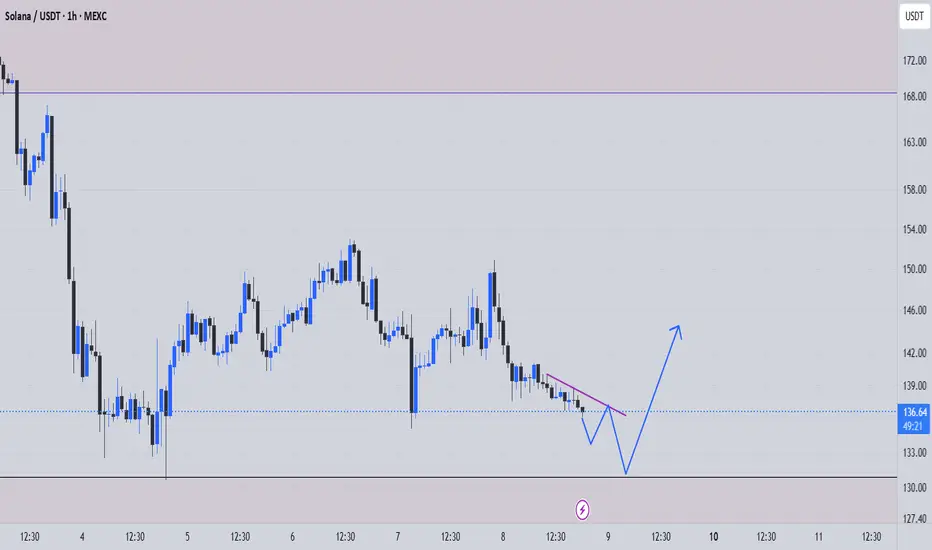
Could Solana face a 25% decline and hitting $145 target?Hello and greetings to all the crypto enthusiasts, ✌
In several of my previous analyses, I have accurately identified and hit all of the gain targets. In this analysis, I aim to provide you with a comprehensive overview of the future price potential for Solana , 📚🎇
It is possible that we may observe brief upward price movements as part of a corrective phase before the broader downtrend resumes, yet there remains a strong likelihood of further downside for Solana from its current position. I foresee an additional 25% decline for this highly influential protocol, with a primary target price of $145. The current bearish trend is still intact, as the price has already lost several crucial support levels along the way. Should Solana fail to break through the upper boundary of the ongoing triangle pattern, we are likely to see continued downward momentum, ultimately reaching the target specified in this analysis. 📚💡
🧨 Our team's main opinion is: 🧨
Solana might see a brief upward movement before continuing its downtrend, with a potential 25% drop to $145 if it fails to break the triangle pattern, as the bearish cycle persists and key supports are lost.
Give me some energy !!
✨We invest countless hours researching opportunities and crafting valuable ideas. Your support means the world to us! If you have any questions, feel free to drop them in the comment box.
Cheers, Mad Whale. 🐋

If SOL crosses this last area (1D) It'll be a really big problem
If SOL crosses down the last green area, we're done.
It's on daily timeframe, each candle = 1 day
Today's candle should close above the price 118, if it closes below, then there's a big chance of a big fall.

SOLUSD Bullish OutlookBullish Post Description for TradingView
Title: Bullish Setup on SOL/USD - Potential Bounce Opportunity!
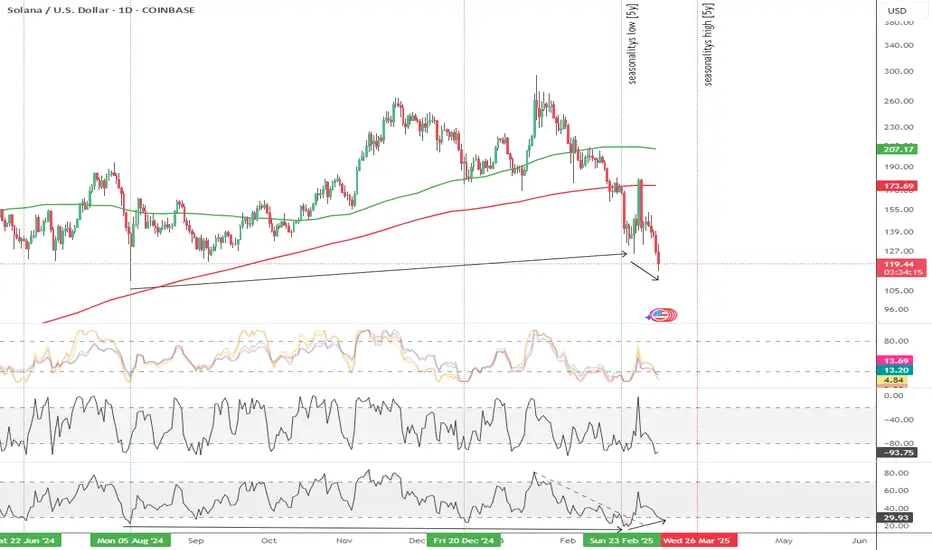
Hey traders, let’s break down this Solana (SOL) to USD chart (1D timeframe, COINBASE: SOLUSD) published by FairValueBuffet on TradingView (Mar 10, 2025, 21:18 UTC). Despite the recent downtrend, there are signs that SOL might be gearing up for a bullish reversal—here’s why:
Potential Support at Fair Value Gap (FVG): The price has dropped to 119.70 USD, aligning with a red FVG at this level. FVGs often act as magnets for price, and with the next unfilled FVG at 103.41 USD, we might see buyers stepping in to defend this zone, potentially triggering a bounce.
Momentum Indicator Oversold: The momentum indicator (top middle, likely RSI) has plummeted into oversold territory after the sharp decline from the 340 USD peak. This oversold condition often precedes a reversal, suggesting that selling pressure may be nearing exhaustion.
Moving Averages Convergence: The green (shorter-term, likely 20-day) and red (longer-term, likely 50-day) moving averages are starting to converge after the bearish crossover in early 2025. A flattening or potential bullish crossover could signal a shift in momentum.
COT Data Shift: The Commitment of Traders (COT) data shows large speculators’ net positions (red line) at -18.5K and commercial hedgers (blue line) at -20K, indicating extreme bearish sentiment. Historically, such extremes can mark turning points as the market becomes oversold, setting the stage for a bullish reversal.
With SOL at 119.70 USD and showing signs of stabilization near a key FVG, this could be a prime spot for a bounce. Keep an eye on the 119.70-120 USD level—holding above this could see SOL targeting the next FVG at 176.69 USD. Consider long positions or scaling in if we see increased buying volume and a break above the black descending trendline. Stay tuned for confirmation!
Bullish Case for Solana - Fundamental Perspective
While the SOL/USD chart indicates a recent bearish trend, the broader fundamentals for Solana as of March 10, 2025, present a compelling bullish case. Here’s why we might see upside potential in the longer term:
Ecosystem Growth: Solana continues to see strong adoption in decentralized finance (DeFi) and NFT markets, with transaction volumes and developer activity remaining robust despite the price correction. New projects launching on the network could drive renewed interest.
Market Sentiment Recovery: The broader crypto market often sees rotational buying after sharp corrections. With Bitcoin and Ethereum potentially stabilizing (as implied by general market trends), SOL could benefit from a risk-on sentiment as investors seek high-growth altcoins.
Technological Advantages: Solana’s high throughput and low transaction costs remain competitive advantages, especially as layer-1 solutions gain traction in a recovering market. This could attract institutional interest over time.
Macro Environment: A dovish Federal Reserve stance, with potential rate cuts signaled in early 2025, typically supports risk assets like cryptocurrencies. Lower interest rates could drive capital inflows into high-growth assets like SOL.
Given these fundamentals, Solana might be poised for a bullish recovery, especially if technical indicators confirm a reversal at the current price levels. The oversold momentum and alignment with an FVG suggest a potential bottoming pattern. Consider accumulating on dips or watching for a breakout above key resistance levels like 130 USD to confirm bullish momentum. Stay tuned for further developments!
Note: This analysis is based on the provided chart and my knowledge up to March 10, 2025. For the latest updates or to validate these trends, I can perform a web search or analyze additional X posts if requested!
Not Financial Advice
Crypto Markets See $3.8 Billion Outflow, What Does It Mean?Ethereum, Solana, and Toncoin were hit with multi-million outflows; but Bitcoin took the biggest hit with $2.59 billion in funding.
For the third week in a row, digital asset investment products have seen investors siphon off funds. This past week alone marked a historic $2.9 billion outflow, raising the cumulative figure to $3.8 billion in three weeks.
According to the latest edition of the Digital Asset Fund Flows Weekly Report, Bitcoin was hit the hardest by negative sentiment, suffering $2.59 billion in outflows last week, while short coin products attracted $2.3 million in inflows. Ethereum also faced heavy losses and received a record $300 million in outflows.
Toncoin was not immune, with investors siphoning off $22.6 million. Meanwhile, multi-asset products experienced $7.9 million in outflows, while Solana and Cardano saw outflows of $7.4 million and $1.2 million, respectively. Even blockchain stocks fell, losing $25.3 million.
Sui, on the other hand, saw inflows of $15.5 million, followed by XRP, which received $5 million, while Litecoin added $1 million in inflows.
Over the past week, outflows were broad, with the United States leading with $2.87 billion, followed by Switzerland with $73 million and Canada with $16.9 million. Sweden also recorded $14.5 million in outflows, while Brazil and Hong Kong saw $2.6 million and $2.5 million, respectively.
In contrast, Germany trended with $55.3 million in inflows as investors bought into the trend. Australia also recorded a modest inflow of $1 million. BITSTAMP:BTCUSD COINBASE:BTCUSD BYBIT:BTCUSDT.P BINANCE:BTCUSDT CRYPTO:ETHUSD

Breaking: Solana Tanking HardSolana often referred to as the Ethereum killer is tanking hard albeit Bitcoin also dipped to the $79k zone. Designed to facilitate decentralized app (DApp) creation, aiming to improve scalability by introducing a proof-of-history (PoH) consensus combined with the underlying proof-of-stake (PoS) consensus of a blockchain, SOL has been building a scalable network with massive growth noticeable in its ecosystem.
With Selling pressure increasing, Solana could be on the brink of a massive selling spree with support pegged to the $110-100 pivot points.
However, should Solana bounced back and break pass the 78.6% Fibonacci retracement point, a trend reversal is inevitable. With the RSI at 35, a little shift to a 45 point in RSI could be all what Solana needs to catalysed a bullish breakout.
Solana Price Live Data
The live Solana price today is $124.43 USD with a 24-hour trading volume of $4,578,943,167 USD. Solana is down 6.54% in the last 24 hours, with a live market cap of $63,337,175,317 USD. It has a circulating supply of 509,018,387 SOL coins and the max. supply is not available.

SHELLUSDT UPDATESHELLUSDT is a cryptocurrency trading at $0.3100. Its target price is $0.4500, indicating a potential 60%+ gain. The pattern is a Bullish Falling Wedge, a reversal pattern signaling a trend change. This pattern suggests the downward trend may be ending. A breakout from the wedge could lead to a strong upward move. The Bullish Falling Wedge is a positive signal, indicating a potential price surge. Investors are optimistic about SHELLUSDT's future performance. The current price may be a buying opportunity. Reaching the target price would result in significant returns. SHELLUSDT is poised for a potential breakout and substantial gains.

Trump Order Hits Crypto: $BTC Falls, $SOL Accumulates After news that Trump signed a strategic order for Bitcoin reserves, the US is not buying directly but using assets seized earlier.
The news hit the market hard. CRYPTOCAP:BTC dropped from 92k to 80k this morning.
After falling to 80k, strong buying returned—similar to the previous drop to 78k.
SOL might be accumulating between $120 and $130. This range could keep its base strong for the next wave.
SOL remains 1 of the few coins with a steady D1 uptrend, even during market consolidation from April-Oct. Large buy orders are concentrated in the $120-$130 range.
Whales and big players are betting:
• BTC at $80,000
• ETH at $2,000
• ETH at $120-$130
Most altcoins lack strong buying power. They may move sideways or drop as funds focus on US-based bluechips.
We’ll see how it plays out. If SOL can’t hold support, the market could face a broader decline.
#BTC #ETH #sol #MarketPullback #WhaleAccumulation

Long-term Solana (SOL) OutlookExpecting a further drop in price to a range of $10-$40 before a bull run to possibly another ATH. Sentiment and price pattern is similar across all major cryptocurrencies. HODLing would be extremely stressful during this bear run.
This is only my opinion and should not be taken as an investment advice. The market can of course, turn at any point in time.

10$ must be touchedHello everybody
I believe that all market must touch lower prices so don't be mad at me.

Solana Update: What About Now, Still Bullish? Yes!What can you tell me about Solana?
Are market conditions different now? Should we worry? Are we still bullish?
Is Solana growing or will it crash based on the chart?
Good questions my friend, great questions.
Market conditions stay the same.
The bullish jump 2-March was rejected but the action continues as a higher low compared to 28-February, and Solana is still trading above a long-term support zone. Above support means bullish.
Market conditions are bullish for Solana because support was tested and support holds. Conditions are bullish because after six days of bearish action the market remains strong. There is no bearish volume, no bearish momentum, no bearish force, mute.
If there was a retrace, it is just because the last move was a reactive event. That being the case, the market erased the move and conditions revert back to before the reaction took place. This means that the basics are in place.
The low is, trading above support. Nothing changes, Solana is set to grow.
Corrections, drops, swings, shakeouts and retraces are an opportunity to buy-in, rebuy and reload. Focus on the long-term while you do so. Solana will soon trade above $700 and it can reach $1,000, $2,000 or more. It will be wild, numbers will go off the chart.
I cannot say anymore so we wait, but you will be extremely happy with the results in several months if you decide to buy and hold.
Namaste.

SOL/USDT BUYHello friends
Given the price reaching resistance and price correction, now the best conditions have become to buy in stages and with capital management. We have also specified price targets for you.
*Trade safely with us*

sol buy midterm"🌟 Welcome to Golden Candle! 🌟
We're a team of 📈 passionate traders 📉 who love sharing our 🔍 technical analysis insights 🔎 with the TradingView community. 🌎
Our goal is to provide 💡 valuable perspectives 💡 on market trends and patterns, but 🚫 please note that our analyses are not intended as buy or sell recommendations. 🚫
Instead, they reflect our own 💭 personal attitudes and thoughts. 💭
Follow along and 📚 learn 📚 from our analyses! 📊💡"