LTC BUYhello friends
According to the formed channel and price support from the bottom of the channel, we can enter the position with capital management.
*Trade safely with us*
Solusdt

Solana Faces Pressure as Pump.fun Offloads $28M SOLThe cryptocurrency market has recently witnessed a notable shift as Pump.fun, Solana’s memecoin launchpad, executed a massive sell-off of 148,759 SOL, worth approximately $28.22 million, to Kraken. This move has triggered speculations regarding Solana’s potential downtrend, raising concerns among investors and traders.
Market Reaction to the Sell-Off
Despite the global crypto market reaching an impressive $3.16 trillion, Solana is facing notable resistance. The recent sell-off by Pump.fun has heightened fears of a continued bearish trend. To date, the launchpad has transferred a staggering 2,280,377 SOL, valued at approximately $462 million, to Kraken. While 264,373 SOL has already been sold for 41.64 million USDC, Pump.fun still holds 16,877 SOL, indicating the possibility of further market activity.
Additionally, Solana’s decline comes as Binance Coin (BNB) surpasses it in market capitalization, now standing at $96.15 billion compared to Solana’s $93.16 billion. Market sentiment is shifting as Solana’s 24-hour trading volume has decreased by 11.51%, now at $3.39 billion.
Technical Analysis
At the time of writing, Solana is trading at $191.17, experiencing a minor 0.20% increase in the last 24 hours. However, the broader trend presents a concerning outlook.
Key Technical Indicators:
- Break of Structure (BOS) Nearing $180: Currently, Solana is hovering around the BOS level. A confirmed breakdown below $180 could trigger a severe selling spree, pushing SOL toward deeper support zones.
- Fibonacci Retracement Analysis: A breakout above the 38.2% Fibonacci retracement level could invalidate the bearish sentiment and spark a bullish rally. If Solana reclaims this level, it could set sights on the $400-$500 range in the long term.
Conclusion
Solana is at a critical juncture, with its price movement hanging in the balance between bearish pressure and potential recovery. The recent Pump.fun sell-off has introduced uncertainty, but key technical levels and broader market sentiment will dictate the next move. A break below $180 could trigger a major decline, while a decisive move above the 38.2% Fibonacci level could renew bullish momentum. Traders should stay alert and adapt their strategies accordingly in this volatile environment.

SUI BUYhello friends
Due to the failure of the downward structure, we can enter into the transaction with capital management.
*Trade safely with us*

SOL buy setup 12H TFSolana has not yet formed a bearish structure on higher timeframes. There is a support zone on the chart from which the price may bounce upward.
The targets are marked on the chart.
A daily candle closing below the invalidation level will invalidate this analysis.
Do not enter the position without capital management and stop setting
Comment if you have any questions
thank you

$SOL - Parabolic Curve BreakdownSOLANA daily structure is still look intact, holding its daily parabolic curve, though it looks like it wants to roll over, to be honest.
SOL/BTC chart is showing the same setup that ETH/BTC had before losing strength to Bitcoin — a long consolidation before the inevitable breakdown.
If we're going to lose $180, we can see it dropping to $150 or could go lower to $115 (demand zone)

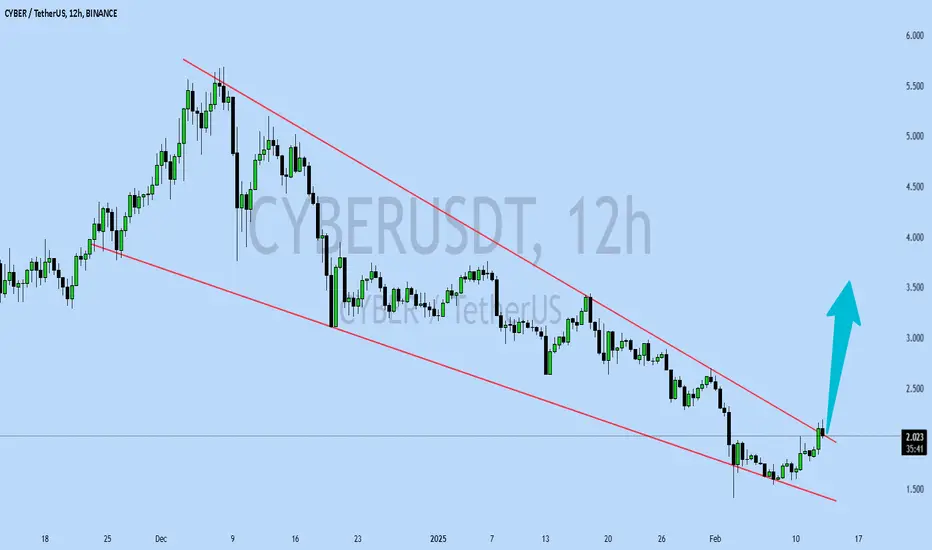
CYBERUSDT UPDATECYBERUSDT is a cryptocurrency trading at $2.026. Its target price is $3.500, indicating a potential 70%+ gain. The pattern is a Bullish Falling Wedge, a reversal pattern signaling a trend change. This pattern suggests the downward trend may be ending. A breakout from the wedge could lead to a strong upward move. The Bullish Falling Wedge is a positive signal, indicating a potential price surge. Investors are optimistic about CYBERUSDT's future performance. The current price may be a buying opportunity. Reaching the target price would result in significant returns. CYBERUSDT is poised for a potential breakout and substantial gains.
BNB ANALYSThe analysis is on daily time frame and will give you a long term view
If these analyses help you to make better profits then share this analysis with your friends
And post your questions below this analysis

Swing trade in 4H
Daily MACD is still deep in the bear zone and Solana hasn't even claimed the the previous week high. Therefore, the overall sentiment for Solana is still bearish to me, however, in the 4H chart, I can see some bullish momentum is building up and a potential swing opportunity might be coming up soon. The things I am seeing for a potential swing trade are as follows:
1) The price broke and closed above the descending treandline and now the price is consolidating (not dropping) in the range bound in the Fib 0.236 region.
2). When the price tries to move to the upside, the first barrier that it has to break is Fib 0.236. It doesn't guarantee it is the start of the bull, but it is the early sign of the bullish momentum. If the momentum is weak, the price starts to retrace to the downside when it hits 0.382 and 0.5. So, I need to wait and see the sideway consolidation ends and the price moves decisively (without a long top wick) above $203.
3) MACD needs to be properly crossed, point to the upside and enter the bull zone.
As I said, daily MACD is still in the bear zone. Therefore, 4H chart provides a good trade set up for a long, the upside momentum might be still limited to the Fib 0.5 -0.618 area. Therefore, if I open a long position based on 4H chart, I will be very cautious with position size and profit target.

SOL Explosive Breakout? Key Levels to Watch Now!SOL is currently trading within a falling wedge pattern after making a new All-Time High. The price is consolidating between the $189.89 support level and the $207 resistance level. A confirmed breakout above the falling wedge and resistance at $207 could push the price towards the next resistance zone, marked in green, between $218.76 and $223.12.
If SOL tests the support at $189.89, followed by a bullish Internal Change of Character (I-CHoCH), this would present a high-probability, low-risk entry. If momentum continue, SOL could rise to new highs.
However, if SOL breaks down and closes below the support zone (Yellow) between $174.28 and $177.23, the bullish setup would be invalidated. In this case, it’s best to remain patient and wait for clearer price action before considering an entry.

IDEXUSDT UPDATEIDEXUSDT is a cryptocurrency trading at $0.04942. Its target price is $0.08000, indicating a potential 60%+ gain. The pattern is a Bullish Falling Wedge, a reversal pattern signaling a trend change. This pattern suggests the downward trend may be ending. A breakout from the wedge could lead to a strong upward move. The Bullish Falling Wedge is a positive signal, indicating a potential price surge. Investors are optimistic about IDEXUSDT's future performance. The current price may be a buying opportunity. Reaching the target price would result in significant returns. IDEXUSDT is poised for a potential breakout and substantial gains.

CAKEUSDT UPDATECAKEUSDT is a cryptocurrency trading at $21.85. Its target price is $3.500 is likely incorrect, as it would be a significant price drop. However, assuming the target price is actually higher, a more plausible target would be around $39.41, indicating a potential 80%+ gain. The pattern is a Bullish Falling Wedge, a reversal pattern signaling a trend change. This pattern suggests the downward trend may be ending. A breakout from the wedge could lead to a strong upward move. The Bullish Falling Wedge is a positive signal, indicating a potential price surge. Investors are optimistic about CAKEUSDT's future performance. The current price may be a buying opportunity. Reaching the target price would result in significant returns.

Franklin Templeton Joins Solana ETF Race: A Game-Changer for SOLThe race for a Solana ( CRYPTOCAP:SOL ) ETF is heating up, and Franklin Templeton has just thrown its hat into the ring. The global investment giant has filed documents in Delaware to register the Franklin Solana Trust, marking a significant step toward launching a spot Solana ETF. This move comes hot on the heels of similar filings by VanEck, Grayscale, and Canary Capital, signaling growing institutional interest in Solana. But with CRYPTOCAP:SOL ’s price down 3.34% in the last 24 hours and 9.99% over the past week, is this ETF momentum enough to reverse the bearish trend? Let’s break it down.
Institutional Adoption Heats Up
Franklin Templeton’s entry into the Solana ETF race is a major vote of confidence for the blockchain platform. Known for its high-speed transactions and low fees, Solana has become a favorite among developers and users alike. Now, with institutional heavyweights like Franklin Templeton, VanEck, and Grayscale vying for a Solana ETF, the cryptocurrency is poised to gain even broader recognition.
Key Developments:
1. Franklin Solana Trust:
Franklin Templeton’s filing in Delaware is the first step toward launching a spot Solana ETF. While the SEC has yet to approve any Solana ETF, the growing number of applications highlights the asset’s potential.
2. SEC’s Stance:
The SEC has acknowledged filings from Grayscale and Canary Capital, opening a 21-day public comment period. However, Solana’s classification as an unregistered security remains a hurdle. Analysts suggest that Litecoin and Hedera ETFs might have a better chance of approval due to their clearer regulatory standing.
3. Franklin’s Crypto Index ETF:
Franklin Templeton has also filed for a **Crypto Index ETF**, which initially tracks Bitcoin and Ethereum but could expand to include other altcoins like Solana. This shows the firm’s long-term commitment to the crypto space.
Technical Analysis
Despite the bullish news, Solana’s price action tells a different story. Here’s what the charts are saying:
CRYPTOCAP:SOL is currently trading at $195, down 2.36% in the last 24 hours. The token has struggled to maintain momentum, with a 9.99% drop over the past week.The Relative Strength Index (RSI) is in bearish territory at 41, indicating that selling pressure outweighs buying interest. This suggests that CRYPTOCAP:SOL could face further downside before finding support.
If Bitcoin dips to $90,000, CRYPTOCAP:SOL could test the $180–$160 zone, a critical support area. However, a breakout above $240 (38.2% Fibonacci retracement level) could reignite bullish momentum, potentially pushing CRYPTOCAP:SOL toward its all-time high of $270.
Solana’s 24-hour trading volume is down 14.03% to $3.81 billion, despite its $95.94 billion market cap. This divergence suggests that retail interest may be waning, even as institutional demand grows.
Conclusion
Franklin Templeton’s entry into the Solana ETF race underscores the growing institutional interest in the blockchain platform. While the current price action is bearish, the potential approval of a Solana ETF could be a game-changer, driving CRYPTOCAP:SOL to new heights. For now, investors should keep an eye on key support and resistance levels, as well as regulatory developments.
Will Solana break out of its slump and reclaim its all-time high? Only time will tell, but one thing is clear: the race for a Solana ETF is just getting started.

BTC Breakout soonBitcoin’s tightening wedge on the 4H chart hints at a bullish breakout.
Break above $102K towards $117K +20%

SOL About to EXPLODE? Key Pattern Signals a Massive Move!Yello, Paradisers! Is SOLUSDT gearing up for a breakout, or will the market shake out weak hands before the real move? Let’s break it down!
💎SOLUSDT has completed a triple zig-zag pattern, which significantly increases the probability of a bullish move. This structure often marks the end of corrective phases, setting the stage for a strong reversal.
💎Adding to the bullish case, SOL has broken out of a falling wedge pattern—a textbook bullish reversal signal. However, to manage risk effectively, scaling into positions rather than entering all at once is the smarter play.
💎Further confluence comes from a bullish divergence, reinforcing the likelihood of upward momentum. That said, we could still see some consolidation or even a liquidity grab before the next major move. If SOL sweeps the lows for inducement and then prints a bullish I-CHoCH (Internal Change of Character), that would present a high-probability, low-risk entry.
💎However, if SOL breaks down and closes candle below the support zone, it would invalidate this bullish setup. In that case, the best approach would be to stay patient and wait for clearer price action before taking any new positions.
🎖 The market rewards patience and precision. Let the liquidity games play out, and only strike when the setup is at its highest probability. Trade smart, Paradisers!
MyCryptoParadise
iFeel the success🌴

Solana With Another Clear Long Signal Given!Trading Fam,
Not too much to say here other than the fact that my indicator has recently given us another very clear buy signal inside our liquidity block after hitting support. This alone is all we needed for entry but if you're not familiar with how accurate my indicator has been for us on these larger cap/large volume tokens, then you can see below we also have plenty of confirmation from the Heiken-Ashi, RSI, and MACD. Here we go!
✌️ Stew

The key is whether the price can be maintained above 202.45
Hello, traders.
If you "Follow", you can always get new information quickly.
Please also click "Boost".
Have a nice day today.
-------------------------------------
(SOLUSDT 1M chart)
In order to turn into a downtrend, it is expected to start by falling below 147.74.
Since the BW(100) indicator was formed at 231.77, the point to watch is whether it can rise above this point.
-
(1W chart)
The key is whether it can receive support near 202.45.
-
(1D chart)
The key is whether it can receive support near 194.46, the HA-Low indicator point, and rise above 202.45.
-
The charts that do not display support and resistance points and the charts that do are displayed are displayed separately for each time frame chart.
The basic chart for trading is the 1D chart.
Therefore, if you want to trade by looking at charts below 1D charts, it is recommended to mark at least the support and resistance points of the 1D chart.
As traders, the reason we analyze charts is to trade.
Therefore, chart analysis is to select key support and resistance points.
Therefore, you must select key support and resistance points in any way.
-
Thank you for reading to the end.
I hope you have a successful trade.
--------------------------------------------------
- Big picture
I used TradingView's INDEX chart to check the entire range of BTC.
(BTCUSD 12M chart)
Looking at the big picture, it seems to have been maintaining an upward trend following a pattern since 2015.
In other words, it is a pattern that maintains a 3-year upward trend and faces a 1-year downward trend.
Accordingly, it is expected that the upward trend will continue until 2025.
-
(LOG chart)
Looking at the LOG chart, you can see that the upward trend is decreasing.
Accordingly, the 46K-48K range is expected to be a very important support and resistance range from a long-term perspective.
Therefore, we expect that we will not see prices below 44K-48K in the future.
-
The Fibonacci ratio on the left is the Fibonacci ratio of the uptrend that started in 2015.
In other words, it is the Fibonacci ratio of the first wave of the uptrend.
The Fibonacci ratio on the right is the Fibonacci ratio of the uptrend that started in 2019.
Therefore, it is expected that this Fibonacci ratio will be used until 2026.
-
No matter what anyone says, the chart has already been created and is already moving.
How to view and respond to this is up to you.
When the ATH is updated, there are no support and resistance points, so the Fibonacci ratio can be used appropriately.
However, although the Fibonacci ratio is useful for chart analysis, it is ambiguous when used as support and resistance.
This is because the user must directly select the important selection points required to create Fibonacci.
Therefore, since it is expressed differently depending on how the user specifies the selection points, it can be useful for chart analysis, but it can be seen as ambiguous when used for trading strategies.
1st : 44234.54
2nd : 61383.23
3rd : 89126.41
101875.70-106275.10 (Overshooting)
4th : 134018.28
151166.97-157451.83 (Overshooting)
5th : 178910.15
-----------------

SOL/USDT 1H: Bullish Bias – Accumulation & Hidden Divergence?SOL/USDT 1H: Analysis
Current Market Structure:
Price: $200.30, currently in the equilibrium zone.
RSI: 50.70 (neutral), but note the hidden bullish divergence when compared to price action.
Structure: Bullish bias with higher lows forming, supporting an upward trajectory.
Trade Setup:
Position: Long
Entry Zone: $198 - $200 (after a retest of the current equilibrium zone with a bullish order block formation).
Targets:
T1: $207.50
T2: $215
Stop Loss: $195 (placed below the recent swing low).
Risk Score: 7/10
Rationale: Favorable risk-to-reward ratio, but precision on the retest is key.
Smart Money Analysis:
Accumulation: Visible in the $190 - 195 zone.
Premium Zone: Established at $220, suggesting a target for market makers.
Market Maker Behavior:
Likely to trigger stops below $195 before propelling the price upward.
Volume Profile: Supports the continuation of bullish momentum.
Key Recommendation:
Action: Wait for a retest of the $198 - $200 zone accompanied by a bullish order block formation before entering a long position.
Caution: Avoid shorts given the overall bullish market structure.

SOL 4 hr breakout coming 2 Patterns ConvergeLook at my busy chart, been keeping it all for the run...
But SOL on 4hr is ready to breakout. may be a retest to 198.5 but both a falling wedge pattern with the red arrow and the measured move from the W pattern both break north somewhat like the Lark lines in yellow, to 216 not much in the way to 230, may snap north
Stop loss below the base of the W
Download the chart if you want and look at the greater trend lines on the 3-5 day time frames

Alt season could already be here, only is winter seasonThe Crypto Market at a Crossroads: What’s Could Next for Bitcoin and Altcoins?
The cryptocurrency market is at a critical juncture, and the narratives being pushed by crypto influencers might not be telling the full story. Over the next weeks and months, the altcoin landscape could undergo significant changes, and there are signals emerging that few are discussing. In this post, I’ll analyze Bitcoin, altcoins, and Bitcoin dominance and what I expect in the coming months.
Bitcoin’s Current Position: Are We Near the Top?
When analyzing Bitcoin, it’s crucial to zoom out and assess the bigger picture. On a weekly chart, Bitcoin’s price action suggests that we might be nearing a top. While some argue that the peak has already occurred, the current structure indicates that Bitcoin could enter a sideways/ downward movement like we saw last year.
If Bitcoin continues to move sideways, altcoins are likely to follow suit. However, during these phases, some altcoins may experience brief runs, especially if Bitcoin dominance starts to decline.
But here’s the catch: Bitcoin dominance has been steadily rising since Bitcoin’s bottom, which is unusual. Typically, during the late stages of a cycle, Bitcoin dominance drops as altcoins surge. This time, however, the landscape seems different.
Altcoin Season: A Muted Rally?
The idea of a massive altcoin season, where all altcoins surge simultaneously, might be a thing of the past. While some coins like BINANCE:SOLUSDT have already seen significant runs (from nearly $80 to $300 top in one year), the broader altcoin market has not experienced the same explosive growth. Instead, only a select few altcoins made significant moves.
This doesn’t mean that altcoins are dead. There will still be opportunities, but they will likely be more selective. Coins that have already made substantial gains, like Solana, may have already topped out.
Going forward the key should be to focus on coins that show strong volume breakouts and price action, rather than holding onto underperforming assets.
Bitcoin Dominance and the Changing Landscape
Bitcoin dominance has been on an upward trajectory, which is unusual for this stage of the cycle. Historically, Bitcoin dominance falls as altcoins begin to rally.
However, this time, the dominance chart suggests that the market dynamics are shifting. While a drop in Bitcoin dominance is still possible, it may not be as pronounced as in previous cycles.
This changing landscape could be due to the sheer number of altcoins in the market. With thousands of coins vying for attention, there simply isn’t enough liquidity to pump all of them. This dilution effect means that only a handful of coins will likely see significant gains, while the majority will continue to underperform.
The Role of Meme Coins and Newer Projects
One of the standout trends in this cycle has been the rise of meme coins and newer projects. Coins like BINANCE:SUIUSDT , which launched during this cycle, have already broken their all-time highs. However, even these newer coins may be entering a bear market phase.
The market is saturated, and without a significant influx of liquidity, it’s unlikely that we’ll see another massive altcoin season.
Meme coins, in particular, have been a double-edged sword. While they’ve provided some of the most explosive gains, they’ve also drained liquidity from the broader market.
This extraction of value has made it harder for other altcoins to gain traction, further complicating the market dynamics.
The Bigger Picture: A Potential Bear Market
Looking at the broader market, there’s a growing possibility that we could be entering a bear market.
The sheer number of coins in the market, combined with the lack of liquidity, suggests that the crypto space is due for a significant shakeout.
Coins like BINANCE:DOTUSD , CAPITALCOM:FILUSD and even BINANCE:ADAUSDT , which have been in a bear market since 2021, are a prime example of this trend.
Many altcoins are already down 80-90% from their all-time highs, and the chances of them recovering are slim.
This is why it’s crucial to focus on coins that have already established a bull trend and are hovering around their support zones, as they have a higher probability of breaking out and continuing their upward trajectory.
Key Takeaways and What to Watch For
1. Bitcoin’s Sideways Movement: Bitcoin is likely to move sideways or slightly downward in the coming weeks, which could create opportunities for select altcoins.
2. Selective Altcoin Runs: Not all altcoins will rally. Focus on coins with strong volume breakouts and price action.
3. Bitcoin Dominance: Keep an eye on Bitcoin dominance. A drop could signal a brief altcoin rally, but it may not be as significant as in previous cycles.
4. Meme Coins and Newer Projects: While meme coins and newer projects have seen gains, they may be entering a bear market phase. Be cautious with these assets.
5. Long-Term Bear Market : The crypto market could be entering a bear market. Focus on preserving capital and avoid holding onto underperforming assets.
Final Thoughts:
The crypto market is at a crossroads, and the next few months could be pivotal. While there will still be opportunities, they will likely be more selective and harder to come by.
By focusing on strong projects with solid fundamentals and avoiding the hype, you can navigate this changing landscape more effectively.
Remember, the key to success in crypto is not just about making money—it’s also about avoiding losses.
Best of Luck!
Mihai Iacob

SOLUSDT Analysis – Potential Bullish Reversal📉 Current Market Structure:
SOL is currently trading at $201.39, showing a downward trend that has reached a key support zone (highlighted in white). A descending trendline has been respected, but price action suggests a potential breakout.
📈 Bullish Scenario:
A breakout above the descending trendline could indicate a trend reversal.
If SOL maintains support and breaks above this level, the next key resistance zones to watch are around $295.90 and $332.53.
The red arrow suggests a potential upward move if buyers step in.
⚠️ Key Levels to Watch:
✅ Support Zone: ~$190 - $200
✅ Breakout Confirmation Above: ~$210
✅ First Major Resistance: ~$295
✅ Final Target: ~$330+
🔎 Conclusion:
If SOL successfully breaks above the trendline with strong volume, we might see a bullish move toward the next resistance levels. However, if the support zone fails, further downside may be expected. Keep an eye on price action and confirmation signals before entering a trade!
💬 What are your thoughts on SOL's next move? Drop a comment below! 👇

SOLUSDT 1DSOL ~ 1D Analysis
#SOL Re -testing this support and so far continues to maintain this support. Bullish again holds control as long as this support continues to be maintained. Minimum target of 15%++

SolanaSol usdt Daily analysis
Time frame daily
Risk rewards ratio =3 👈👌
My target= 303 $
Technical analysis
Let's take a look at the chart. The price is between two ascending diagonal lines. At times it has approached the upper line but has not touched it and has turned back. But the lower line has become a good support and can give us a signal that the price will not go lower than this. This support has worked well even in severe declines.

SOL/USDT 1H: Accumulation in Play – Rebound to $208?SOL/USDT 1H:Analysis
🚀 Follow me on TradingView if you respect our charts! 📈 Daily updates!
Current Market Analysis:
Price at $197.49, rejecting at the $204 FVG (Fair Value Gap).
RSI indicating potential hidden bullish divergence, suggesting underlying strength.
Market structure forming lower highs, with key resistance at the $204-$208 zone.
Trade Setup:
Confidence Level: 7/10 – Favorable setup but requires confirmation.
Entry: Wait for a retest of $196 support before entering.
Targets:
T1: $204 (FVG fill).
T2: $208 (Premium zone).
Stop Loss: Below $192 (recent swing low).
Risk Score:
7/10 – Decent R:R setup, but potential liquidity grabs below $192 pose risk.
Smart Money Analysis:
Accumulation likely occurring within the $192-$196 range.
Market Makers building liquidity below $192, possibly targeting a stop hunt before reversal.
Recommendation:
Wait for confirmation of support at $196 before entering long positions.
Increased volume is necessary to confirm a bullish move.
Be patient and watch for a liquidity sweep below $192 for a potential reversal entry.
Confidence Level:
7/10 – Bullish bias in play, but confirmation needed for execution.
🚀 Follow me on TradingView if you respect our charts! 📈 Daily updates!
