SOLUSDT 1DSOL ~ 1D
#SOL In Time Frame 1D this is very strong support for now. Buy from here with a minimum target of 15%++
Solusdt

Solana Double Bottom: Looking For A Break Of The Range High!Solana has formed a double bottom with a dip below, suggesting a potential bullish move could be on the horizon. This pattern indicates a possible trend reversal. I'm watching for a break above the range high, followed by a retrace to retest the range high on the lower timeframe, with a potential continuation to the upside. Monitor the Fibonacci pullback to the 50-61.8% level on the previous four-hour swing for a possible bullish entry. This is not financial advice.


Solana (SOL) Analysis: Fundamental and Technical Breakdown📊 Solana reached its all-time high (ATH) of $264 on November 22, but has since entered a corrective phase, experiencing price volatility in recent weeks. In this analysis, we will explore both the fundamental and technical aspects of this popular cryptocurrency to uncover potential trading opportunities.
Fundamental Analysis 🔄
1. Anticipation of a Solana ETF: Major financial institutions like VanEck and Grayscale are competing to launch a Solana ETF. The U.S. Securities and Exchange Commission (SEC) is expected to announce its decision by January 2025. With a 77% estimated chance of approval, this could positively impact SOL’s price.
2. Total Value Locked (TVL) :Solana's ecosystem has seen a consistent rise in its TVL throughout 2024, driven by ecosystem expansion and the launch of meme coins on its blockchain.
3. Market Sentiment and Volatility: Investor sentiment towards Solana remains mixed. The Net Unrealized Profit/Loss (NUPL) indicator suggests holders are cautious. Entering the fear zone may create buying pressure opportunities.
Overall, Solana’s fundamentals indicate significant growth potential, but traders should also be mindful of existing challenges.
Technical Analysis 🔢
Weekly Timeframe:
Solana is trending within an ascending channel, showing strong momentum and volume.
After correcting from its ATH of $265, SOL has reached the channel’s midline.
As long as SOL remains above the key support zone of $150-$165 , traders can seek long opportunities for both futures and spot holdings.
Daily Timeframe:
A breakout above the $245 resistance could signal a strong buying opportunity for holding positions.
If a deeper correction occurs, this level might adjust, and updates will follow.
4-Hour Timeframe:
Recent price fluctuations stem from U.S. job market news, strengthening of the DXY, Bitcoin’s decline, and rising BTC dominance.
A breakout above $202 could trigger a long position, contingent on traders confirming their setups.
Trigger Confirmation Tips:
Method 1: Watch for a rejection at resistance, and enter on the next breakout.
Method 2: Enter on a successful retest (pullback) post-breakout.
For short positions, watch for a breakdown below the $160 support zone.
🚀 Solana presents promising opportunities backed by solid fundamentals and technical setups. However, managing risk and waiting for proper confirmations remain crucial. Are you ready to capitalize on Solana’s next move? Share your thoughts in the comments!
I’m Skeptic , here to simplify trading and help you achieve mastery step by step. Let’s keep growing together!

LQTYUSDT UPDATELQTYUSDT is a cryptocurrency trading at $1.830. Its target price is $3.000, indicating a potential 60%+ gain. The pattern is a Bullish Falling Wedge, a reversal pattern signaling a potential trend change. This pattern suggests that the downward trend may be ending. A breakout from the wedge could lead to a strong upward move. The Bullish Falling Wedge is a positive signal, indicating a potential price surge. Investors are optimistic about LQTYUSDT's future performance. The current price may be a buying opportunity. Reaching the target price would result in significant returns. This pattern typically leads to a strong upward move.

SOLUSD overview and market outlook expecting BOUNCE🔸Hello traders, today let's review 12hour price chart for SOLUSD . pullback/correction in progress with limited upside currently, however expecting a bounce next week.
🔸Trading right now at 185 usd, strong bullish liquidity located near OBs 150/155 usd. bulls will likely take over once we trigged the liquidity order blocks below market.
🔸Recommended strategy: BUY LOW near liquidity OBs 150/155 usd, TP bulls is fresh overhead liquidity at 200/210 USD. expecting decent bounce in this market.
🎁Please hit the like button and
🎁Leave a comment to support our team!
RISK DISCLAIMER:
Trading Futures , Forex, CFDs and Stocks involves a risk of loss.
Please consider carefully if such trading is appropriate for you.
Past performance is not indicative of future results.
Always limit your leverage and use tight stop loss.

SOL waiting for 180,1$I closed my TON position with a +22.5% profit a nd SOL with +39.55% profit , all within one day. This was during an extremely volatile period, making it one of the most challenging trades, as both the stock and crypto markets faced significant pushback yesterday.
At one point, I saw a -100% unrealized loss, but the order setup allowed me to recover and secure profits.
Currently, the market appears to be leaning downward, with bulls trying to defend key levels: BTC at $90k-$93k, SOL at $180, and TON at $5-$5.2. These levels have been tested multiple times, but liquidity ultimately dictates the game.
For now, I’m staying cautious and I do not enter into a deal. However, I’m setting an order for Solana at $180 with 25x leverage and a $30 margin, assuming SOL might dip again and recover quickly.

Correction Is Finished For Solana SOL, $300+ Is NextHello, Skyrexians!
Today it's time to observe BINANCE:SOLUSDT the most overbought crypto of 2024. Today we will not try to guess where is going to be top and bottom, look at the local picture instead because in the short term it's about to show the significant growth.
Let's take a look at 12h time frame. We can mark the previous impulse with the green. Decrease from the top can be counted as a correction because of its ABC Elliott waves structure. Now the Bullish/Bearish Reversal Bar Indicator can print the bullish green dot which inside the Fibonacci support level can be the strong reversal sign. As always, alerts from this indicator are automatically replicated on my accounts. You can find the information in our article on TradingView . If reversal will be confirmed, the next target is somewhere above $300. When price will reach it we make an update.
Best regards,
Skyrexio Team
___________________________________________________________
Please, boost this article and subscribe our page if you like analysis!

Solana (SOL/USD) – Bullish Technical Setup AnalysisPrice Action Recap:
Strong bounce off the $180 support level confirms its critical role as a floor for Solana.
The uptrend remains intact, with Solana forming higher lows and highs within an ascending channel.
Recent pullbacks showed strong buying interest at the lower trendline, suggesting dominance by the bulls.
Key Levels to Watch:
Support Zone:
$180: A crucial level that has held multiple times, acting as a floor for the price. A strong bounce here indicates continued bullish momentum.
Break below $180: If this support fails, the bullish outlook would be in jeopardy, and the price could shift to retest lower levels.
Resistance Zones:
$220-$230: First target zone, aligning with previous highs, where the price could face some resistance.
$250: Potential extension zone, derived from the measured move of the ascending channel, if the uptrend continues unabated.
Market Implications:
Bullish Continuation: If Solana continues to hold above $180 and momentum persists, there’s potential for a continued rally toward the $220-$250 range.
Bearish Scenario: A break below $180 would require a reassessment of the bullish outlook and could prompt a deeper correction, testing lower support levels.
Outlook:
Bullish Scenario: Solana could move toward the $220-$230 range, and with sustained momentum, may reach $250.
Bearish Scenario: A loss of $180 would shift the outlook to a more neutral or bearish stance, and potential downside targets could be below this support zone.
Conclusion:
Solana's uptrend remains strong, supported by $180. The $220-$230 zone is the next key resistance area. A break above this would confirm the continuation of bullish momentum, while a break below $180 would require caution and re-evaluation of the market dynamics.

Solana to $100 Easy trade, solana is finished and probably just going to los value. The only use it had was for memecoin traders and now that is being banned across the globe they will rotate into another chain to scam people with that.Any ideas?

$SOLUSDT LONG AGAINWell, this is quite interesting. Two successful SOL trades, and now I’m ready to try for the third. We’re back in the game! During the night, we saw a nice correction, and it’s a good time to note that the underlying narratives haven’t changed.
Let’s stick to the same strategy as before:
Duration:
This trade can be either short-term or long-term, depending on your goals. You could also consider entering as an investor in the SOL ecosystem, which allows you to average down costs in case the trade doesn’t go as planned. The key here is to monitor funding rates, especially if you’re planning to hold for a longer period.
Target:
The goal is to achieve 100% profit. The entry is made on Binance with 25x leverage, using a $37 margin, creating a total position size of $950.
Risk:
This trade is classified as medium risk, particularly if you’re ready to use dollar-cost averaging (DCA) to manage the position. This time, I’ve added an extra layer of caution by limiting potential losses to 60% of the deposit.

Trading opportunity for SOLUSDTBased on technical factors there is a Buy position in :
📊 SOLUSDT
🔵 Buy Now or by Breakout
🪫Stop loss 184.90
🔋Target 201.00
📏 R/R 2
💸RISK : 1%
We hope it is profitable for you ❤️
Please support our activity with your likes👍 and comments📝

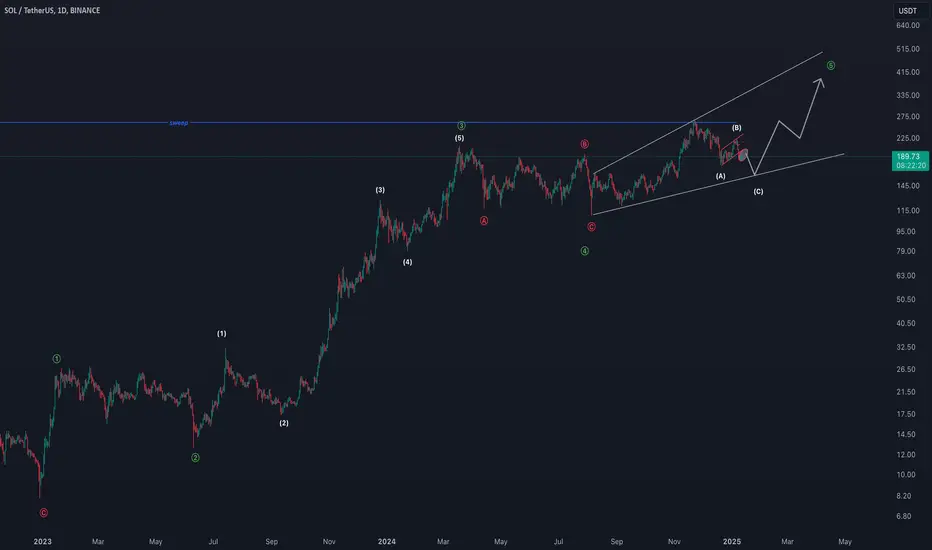
SOLANA EW COUNTMy view of SOLANA
IMO wave 5 is developing
Structure is a bit complicated but hight probability for ending diagonal here
Join my X for more charts
XRPUSDT UPDATEXRPUSDT is a cryptocurrency trading at $2.4840. Its target price is $3.1000, indicating a potential 25%+ gain. The pattern is a Bullish Pennant, a continuation pattern signaling a potential breakout. This pattern suggests a brief consolidation before a strong upward move. The Bullish Pennant is a positive signal, indicating a potential price surge. Investors are optimistic about XRPUSDT's future performance. The current price may be a buying opportunity. Reaching the target price would result in significant returns. The Bullish Pennant pattern typically leads to a strong upward move. XRPUSDT is poised for a potential breakout.

SOLANA Break down the minor trend line!Recommend R:R= 1:2 or 1:3
Always use money management!
There is nothing probability of chart pattern above 70% (in other words there is a possibility of failure)

Re-entering the SOL Trade: A Strategic MoveYesterday, our SOL idea played out brilliantly, delivering a 65% profit in just 12 hours . While I didn’t hold out until the initial target, I want to be clear about my approach—I calculate not just price movements but the time frame as well. If I see rapid growth within a few hours that yields more than 50% of my deposit, I consider it a solid trade and decide to exit rather than risk overstaying.
By the evening, I closed the trade with satisfaction. However, this morning, the market brought SOL’s price right back to where it started. It’s almost as if the conditions for the trade reset themselves, presenting a renewed opportunity.
With this in mind, I’ve decided to re-enter the trade.
Trade Details
Duration:
This trade can evolve into either a short-term or long-term position based on individual goals. Alternatively, you could approach it as an investment in the SOL ecosystem, allowing you to average down costs if the trade doesn’t play out. Monitoring funding rates remains key to this strategy.
Target:
The goal is to achieve a 100% profit. The entry is made on Binance with 25x leverage, using a $37 margin and creating a total position size of $950.
Risk:
This trade is categorized as medium risk, particularly if you’re prepared to utilize dollar-cost averaging (DCA) to manage the position. This time, I’ve added an extra layer of caution by limiting potential losses to around 60% of the deposit.
Conclusion
Trading is a mix of timing, strategy, and calculated risk. SOL has proven its potential in a short timeframe, and with similar conditions presenting themselves today, I’m ready to take another shot. Let’s see how it unfolds!

PHAUSDT UPDATEPHAUSDT is a cryptocurrency trading at $0.3209. Its target price is $0.5000, indicating a potential 50%+ gain. The pattern is a Bullish Falling Wedge, a reversal pattern signaling a potential trend change. This pattern suggests that the downward trend may be ending. A breakout from the wedge could lead to a strong upward move. The Bullish Falling Wedge is a positive signal, indicating a potential price surge. Investors are optimistic about PHAUSDT's future performance. The current price may be a buying opportunity. Reaching the target price would result in significant returns. This pattern typically leads to a strong upward move.

I take $SOLUSDT LONGBINANCE:SOLUSDT - Opening a #LONG position
The trade with TON could have been left open, but I decided that fundamentally SOL is stronger in case of a dip. Currently, the market is in a sideways trend, deciding where to move next. For BTC, the support level is around 92-93k, but it doesn’t seem very strong.
SOL is 14% off its previous high and has recovered less than TON. TON is currently down 45%, and while I could have held it, I feel that if things go well, SOL could reach $218. Considering the growing popularity of memecoins, I think Solana has better chances to deliver solid gains.
Duration:
This trade can be either short-term or long-term, depending on your goals. You can also consider entering as an investor in the SOL ecosystem to average down your costs in case of a failed trade. The key is to monitor funding rates.
Target:
Achieve 100% profit. Entry made on Binance with 25x leverage. Margin used: $29.77. Total position size: $744.32.
Risk:
Medium, especially if you’re ready to use dollar-cost averaging (DCA) to manage your position. I’m not setting stop-losses because I currently see a high probability of growth. If it doesn’t work out, this was essentially a $29 lottery ticket.

Solana - It Just Looks Super Bullish Now!Solana ( CRYPTO:SOLUSD ) is creating a break and retest:
Click chart above to see the detailed analysis👆🏻
With the last monthly candle of more than +40%, Solana broke all resistance towards the upside and finally created a new all time high. Now we are seeing the perfect retest of the previous resistance which is now turned support and another strong move higher is absolutely possible.
Levels to watch: $200, $400
Keep your long term vision,
Philip (BasicTrading)

sol buy midterm"🌟 Welcome to Golden Candle! 🌟
We're a team of 📈 passionate traders 📉 who love sharing our 🔍 technical analysis insights 🔎 with the TradingView community. 🌎
Our goal is to provide 💡 valuable perspectives 💡 on market trends and patterns, but 🚫 please note that our analyses are not intended as buy or sell recommendations. 🚫
Instead, they reflect our own 💭 personal attitudes and thoughts. 💭
Follow along and 📚 learn 📚 from our analyses! 📊💡"

SOLUSDT: Tough Spot, But Opportunity Awaits!SOLUSDT: Tough Spot, But Opportunity Awaits! 🧐
Right now, the market conditions make it tricky:
Too low to short, yet too high to long.
Solution: If the price reaches the blue box, it’s a strong zone to consider taking a long position.
Always confirm with your favorite tools like CDV, volume profiles, and LTF structure breaks before diving in.
The patient win the race! Boost, comment, and follow for elite-level strategies! 🚀
Let me tell you, this is something special. These insights, these setups—they’re not just good; they’re game-changers. I've spent years refining my approach, and the results speak for themselves. People are always asking, "How do you spot these opportunities?" It’s simple: experience, clarity, and a focus on high-probability moves.
Want to know how I use heatmaps, cumulative volume delta, and volume footprint techniques to find demand zones with precision? I’m happy to share—just send me a message. No cost, no catch. I believe in helping people make smarter decisions.
Here are some of my recent analyses. Each one highlights key opportunities:
🚀 GMTUSDT: %35 FAST REJECTION FROM THE RED BOX
🎯 ZENUSDT.P: Patience & Profitability | %230 Reaction from the Sniper Entry
🐶 DOGEUSDT.P: Next Move
🎨 RENDERUSDT.P: Opportunity of the Month
💎 ETHUSDT.P: Where to Retrace
🟢 BNBUSDT.P: Potential Surge
📊 BTC Dominance: Reaction Zone
🌊 WAVESUSDT.P: Demand Zone Potential
🟣 UNIUSDT.P: Long-Term Trade
🔵 XRPUSDT.P: Entry Zones
🔗 LINKUSDT.P: Follow The River
📈 BTCUSDT.P: Two Key Demand Zones
🟩 POLUSDT: Bullish Momentum
🌟 PENDLEUSDT.P: Where Opportunity Meets Precision
🔥 BTCUSDT.P: Liquidation of Highly Leveraged Longs
🌊 SOLUSDT.P: SOL's Dip - Your Opportunity
🐸 1000PEPEUSDT.P: Prime Bounce Zone Unlocked
🚀 ETHUSDT.P: Set to Explode - Don't Miss This Game Changer
🤖 IQUSDT: Smart Plan
⚡️ PONDUSDT: A Trade Not Taken Is Better Than a Losing One
💼 STMXUSDT: 2 Buying Areas
🐢 TURBOUSDT: Buy Zones and Buyer Presence
🌍 ICPUSDT.P: Massive Upside Potential | Check the Trade Update For Seeing Results
🟠 IDEXUSDT: Spot Buy Area | %26 Profit if You Trade with MSB
📌 USUALUSDT: Buyers Are Active + %70 Profit in Total
🌟 FORTHUSDT: Sniper Entry +%26 Reaction
🐳 QKCUSDT: Sniper Entry +%57 Reaction
📊 BTC.D: Retest of Key Area Highly Likely
This list? It’s just a small piece of what I’ve been working on. There’s so much more. Go check my profile, see the results for yourself. My goal is simple: provide value and help you win. If you’ve got questions, I’ve got answers. Let’s get to work!

SOL Long OpportunityMarket Context:
SOL is experiencing a retracement alongside the broader market, approaching a key support zone that offers a strategic entry for a long spot trade.
Trade Details:
Entry Zone: Between $160 – $170
Take Profit Targets:
$200 – $220
$260 – $280
Stop Loss: Just below $138
This trade leverages SOL's pullback to a critical support area with strong upside potential for continuation. 📈

80% Profit on SOL Long The Gains Keep Coming !Whopping 80% (20x Lev) Profit From SOL Long ! 🚀💰 I hope everyone enjoyed the massive gains I delivered Make sure to follow for more profitable calls and share this with your network. Let’s keep winning together the best is yet to come! Whoever is not following us is really missing a ton of profits for sure
~@wolfchemist

Public trade #3 - #SOL price analysis ( Solana )The CRYPTOCAP:SOL price has already dropped into the medium-term Buy zone
If you see prospects for #Solana and want to buy this coin for your investment portfolio, then the $155-190 buy zone is just for you
The price of OKX:SOLUSDT shouldn't go any lower if the “planned” targets for further growth to $340, $650, and even $1100 remain relevant in MM.
📈 As for how to buy: either with limit orders at $190 and $155 or at an average price of $173, or with a “grid” in the specified range - it all depends on the amount of your deposit allocated to this asset and your trading strategy in general.
_____________________
Did you like our analysis? Leave a comment, like, and follow to get more
