SOL 6H. Solana Heading to $400 in the Medium Term. 12/12/24The asset price is currently stabilizing within the $222-$204 range, which could serve as a critical support zone. Support is the level where the price tends to bounce back as buyers step in aggressively, holding the price at this level.
In the short term, I’m considering a buy position targeting $260, which marks the upper boundary of the current range. For me, this is strictly a near-term goal. In the medium term, I anticipate Solana trading between $300 and $400.
To put it clearly and concisely: I expect further growth for #SOL and do not foresee the price dropping below $204.
DYOR.
Solusdt

Sol Short ScalpAdded to shorts.
Entry 227
Tight and flat Stoploss at 229
Targeting 206
Note: Not a Financial Advise.

#SOL reached support zone 📊#SOL reached support zone ✔️
⚡️The entry point of spot trading has been triggered, so the previous reduced position is automatically bought back.
🧠From the perspective of wave theory, the bearish wolf wave here may have ended, and a rebound can be expected.
➡️For futures trading, we do not have much cost advantage, so I will let everyone choose to wait and see. It is not certain whether it will stabilize here. If it continues to break down, it is possible to touch our defense point, and we will turn profit into loss, which is not worth the loss.
👀I need to further observe whether it can stabilize here, and we will participate in long transactions after specific signals appear.
Let's see👀
🤜If you like my analysis, please like💖 and share💬
BITGET:SOLUSDT

SOL Mid-term IdeaSol has a possibility of retesting my support trendline between $160-175. I would aim for that confluence to buy spot or long it from there.

SOLUSDT Buy Zones HighlightedWith the possibility that the cryptocurrency market may not recover by year-end, I’ve lowered my buy positions significantly to reflect a more cautious approach in the current environment.
For SOLUSDT, the blue boxes on the chart mark key support zones where I plan to join as a buyer. These levels are strategically selected for their potential to act as strong support, offering a favorable entry with reduced risk.
Key Levels:
Buy Zones: Blue boxes on the chart
Risk Management: Stop loss placed just below the lower boundary of the final blue box
Target: Monitoring for a bounce and strength confirmation before setting upside targets
Patience and sound risk management are critical in these uncertain market conditions.
Disclaimer: This is not financial advice.
I keep my charts clean and simple because I believe clarity leads to better decisions.
My approach is built on years of experience and a solid track record. I don’t claim to know it all, but I’m confident in my ability to spot high-probability setups.
My Previous Analysis
🐶 DOGEUSDT.P: Next Move
🎨 RENDERUSDT.P: Opportunity of the Month
💎 ETHUSDT.P: Where to Retrace
🟢 BNBUSDT.P: Potential Surge
📊 BTC Dominance: Reaction Zone
🌊 WAVESUSDT.P: Demand Zone Potential
🟣 UNIUSDT.P: Long-Term Trade
🔵 XRPUSDT.P: Entry Zones
🔗 LINKUSDT.P: Follow The River
📈 BTCUSDT.P: Two Key Demand Zones
🟩 POLUSDT: Bullish Momentum
🌟 PENDLEUSDT: Where Opportunity Meets Precision
🔥 BTCUSDT.P: Liquidation of Highly Leveraged Longs
🌊 SOLUSDT.P: SOL's Dip - Your Opportunity
🐸 1000PEPEUSDT.P: Prime Bounce Zone Unlocked
🚀 ETHUSDT.P: Set to Explode - Don't Miss This Game Changer
🤖 IQUSDT: Smart Plan
⚡️ PONDUSDT: A Trade Not Taken Is Better Than a Losing One
💼 STMXUSDT: 2 Buying Areas

Solana touched $204 and will now target $375Traders,
In my previous post on Solana I explained the significance of that blue trendline. When Solana was at $260, I observed that while BTC consolidates with sideways price action, Solana could drop to $204 (pink horizontal support). It did that. In fact, we hit that price several times and so far that support has held. I have now taken a long position and will be targeting $375. on SOL. Here's my quick thesis.
First of all, you will notice that inverse head and shoulders pattern. While it hasn't completed yet, nor confirmed, I highly suspect the pattern will play out. There are several reasons why this could be the case.
Number one. The rotation of alts is different this year. In case you haven't observed this yet, it goes something like this: Bitcoin pumps either slightly before or sometimes simultaneously with Solana and Solana based meme coins. Often, Solana based memecoins, especially AI genned mcs, are even ahead of Solana and Bitcoin. I have started to observe this recently while looking at my Solana mc list. Many of the Sol AI genned mcs were up yesterday and today. Now, maybe I got lucky and just picked all the right coins to add to my list, but I don't think so. One of my mcs was up almost 900% today at it's peak. That was DEVIN. I am so stoked 'cuz I hold a huge bag in that one. Anyways, I think this is giving me my first hint that the pump rotation is just about to begin again before Christmas. It often starts with SOL based AI mcs first, then other mcs like the OG cats, dogs, and frogs, etc. Then we hit the dex's like Jupiter, Ray, GUAC, Orca, etc. Then you'll see SOL start (maybe in conjunction with BTC). Next you'll start to see other chain based mcs pump along with AI coins like FET, TNSR, AIOZ, NEAR, etc. Last but not least, you'll see the OG Boomer ALTS pump to finish it up. My suspicion is that we get one more round of something like this before Christmas. I could be wrong but so far, my record speaks for itself here so be prepared for this.
✌️ Stew.

SOLUSDT Trade LogSOLUSDT Short Setup (4H)
Trade Logic:
- Entry: Short within the 4-hour Fair Value Gap (FVG) following a strong sell signal.
Confluence Factors:
- Overextension: Price shows significant overextension above key resistance levels, increasing the probability of a reversal.
- Market Structure Shift (MSS): Clear break of bullish structure, signaling a potential trend reversal.
- Long Squeeze: Evidence of trapped long positions, adding downward pressure as they exit.
- Declining CVD (Cumulative Volume Delta): Weak buyer momentum during the recent price rally, supporting bearish bias.
- Risk-Reward: Minimum 1:2 RRR with stop-loss above the FVG and a maximum risk of 1% of account balance.
- Target: TP1 at the next structural demand zone; TP2 near key psychological support (e.g., $50).
Macro Context:
- Market Sentiment: Broader crypto market shows risk-off behavior as BTC retraces, aligning with bearish SOLUSDT bias.
- Funding Rates: Positive funding rates indicate aggressive long positioning, increasing short squeeze potential.
- On-Chain Metrics: Declining SOL staking activity and increased token flow to exchanges suggest reduced demand and potential sell pressure.
Keep stops tight and reassess if SOL breaks back above the 4H FVG, invalidating the setup.

SOL Swing Trade: From $175 Support to $800 TargetIn this video, we revisit Solana's (SOL) price action, highlighting the progression toward our entry target of $100 as discussed in March. Now facing resistance at the previous all-time high (ATH), a pullback appears both healthy and likely. We'll analyze the potential for support levels to hold, with $175 being a key structural level. From there, Solana could chart a path to our profit targets: $500 for a 2x return and $800 for a 5x return. Join me as we explore strategic entry points, key levels, and market conditions driving SOL's performance, and discuss how to capitalize on this exciting opportunity for swing traders.

SOL short Position Sol rejection from here can send it down pretty fast.
Looking into short position from here.
Above 241 with close sl of 245.
Risky call but have nice RR.
Note: Not a Financial Advise.

SOLUSDT 2DSOL ~ 2D
#SOL the price got a pretty good reaction at this support block area.
This is also the Golden Fibonacci area.
Buy gradually on this support block,. with a minimum target of 20%++

SOL is making a correction#SOL is making a correction which can let the market drop to lower prices as there is some fibo levels to reach and after that can make another rise

SOLStop run LWL into upper falling wedge breaking out > consolidate > ATH BO. weekly not overbought, back inside bolly bands

sol usdt long futures"🌟 Welcome to Golden Candle! 🌟
We're a team of 📈 passionate traders 📉 who love sharing our 🔍 technical analysis insights 🔎 with the TradingView community. 🌎
Our goal is to provide 💡 valuable perspectives 💡 on market trends and patterns, but 🚫 please note that our analyses are not intended as buy or sell recommendations. 🚫
Instead, they reflect our own 💭 personal attitudes and thoughts. 💭
Follow along and 📚 learn 📚 from our analyses! 📊💡"

$SOL - AnalysisCRYPTOCAP:SOL 4H
1. Harmonic Pattern:
- A potential harmonic pattern is observed, consisting of points X, A, B, C, and D.
- Point D is located at the 0.952 Fibonacci level, indicating the completion of the pattern, and there is an expectation of correction or reversal.
2. Order Block:
- An "Order Block" area is identified near the price peak (range of 156 to 160). This area could act as a strong resistance, with a likelihood of price reversal from this level.
3. Ascending Trendline:
- The price has reacted to an ascending trendline multiple times. This line can serve as strong support, and if broken, it could lead to further price declines.
4. Retest Area or Rise from Here?:
- Two potential scenarios are illustrated in the analysis:
- Bullish Scenario: After reaching the trendline, the price could pull back and move upward.
- Bearish Scenario: If the trendline support is lost, the price may decrease further and move toward lower areas (around 140).
5. Strong High Area:
- This area is marked as a very strong resistance above the price, which, if broken, could lead to significant upward movement, potentially reaching the range of 164 and above.

Solana (SOL/USD): Eyeing a Return to All-Time HighsSolana is in a critical phase, attempting to reclaim its all-time high (ATH) of $260 as it builds bullish momentum. With Bitcoin (BTC) stabilizing in the $92,000–$103,000 range, the broader crypto market is ripe for a rally, providing the perfect environment for SOL to break its ATH and target a new high of $400 by March 2025.
Key Factors for SOL’s Rally:
Bullish Momentum Curve:
December will be pivotal as Solana needs to form a steady, upward momentum curve. This means a series of higher highs and higher lows, with minimal volatility to maintain investor confidence.
Critical Support Levels:
$200: Key psychological and technical support. Staying above this level will signal strength and resilience.
$180 (Worst Case): If SOL drops to this level, it must find strong buying support to avoid breaking the bullish structure.
Resistance at $260:
The $260 ATH will be a critical barrier. A successful breakout here will not only confirm the bullish trend but could ignite a wave of buying that propels SOL toward its next target of $400.
Positive Scenario:
If SOL/USD continues to defend the $200–$180 range and Bitcoin remains stable, Solana can gain the momentum needed to break $260 by early 2025.
Once this level is breached, SOL could rally quickly, entering price discovery mode and targeting $400 by March 2025.
Risks and Challenges:
A failure to maintain support above $180 could lead to increased selling pressure, disrupting the bullish outlook.
Broader market volatility or BTC dropping below $92,000 might also hinder SOL’s progress.
Outlook for SOL Holders:
This December is crucial for Solana as it battles to establish a solid base and regain momentum. Holding above $200 while building a steady bullish curve will set the stage for SOL to not only reclaim its ATH of $260 but also push toward a new milestone of $400 by March 2025, marking a significant achievement for the ecosystem and its investors.

Kween on SOL - AI movies next big thing?Kween
AI movies as philosophical art with dark humor - next big thing?
It is irresponsible to recommend the purchase of kween, I only note an exceptional chart and something new has arrived the crypto space. Worth checking out for some inspiration. If kween plays her cards right, this could be something.
I don't want to call kween memecoin she is something else even though the chart is similar to a pumping meme coin.
With a market cap of around 17 million, it could be a big fall or an explosion.

SOL pumping?🔼 Climb to $204.46: This level acts as a key resistance. A breakout above this confirms a bullish continuation.
🎯 Next Target at $364.43: After surpassing $204.46, the next profit target offers a 160% potential gain at $364.43.
🔴 Support Zone at $190: This level is currently holding as a strong support to prevent further downside.
⚠️ Downside Risk: Breaking below $190 could lead to a drop toward $138 or even $116.
✅ Buy Signal: If the price stabilizes above $204.46, it signals a bullish entry.
🚀 Profit Potential of 75%-160%: The chart suggests great upside opportunities if the upward trend continues.
📊 Summary: A breakout above $204 triggers a valid buy signal 🎉, but caution is needed if the price dips below $190 ⚡.

SOLANA LOOKING ALL TIME HIGHS - SOL LONGPrice rejected strongly from the daily demand zone after running the daily swing liquidity. This move created a 4H demand zone. Following that, we saw a break of the bearish trendline, with a retest of both the trendline and the 4H demand.
I entered a position during this retest, even as BTC was aggressively dumping by over $10K, which is why I couldn’t share this idea in real time. However, I am already in this trade and targeting a bare minimum of $271 as the next level.

Solana’s Memecoin Hub Faces UK Ban Amid Regulatory ConcernsThe Solana ecosystem has been making waves in the crypto space, not only for its technological advancements but also for its thriving memecoin market. However, recent developments surrounding **Pump Fun**, a prominent Solana-based memecoin launchpad, have sparked regulatory debates. Despite the challenges, Solana’s native token, CRYPTOCAP:SOL , demonstrates resilience in the face of adversity.
Pump Fun’s UK Ban: A Regulatory Crackdown
Pump Fun, a leading platform for memecoin creation and trading, has abruptly restricted access to users in the United Kingdom. This decision follows a warning from the Financial Conduct Authority (FCA), which accused the platform of operating without proper authorization under UK financial laws.
Key highlights of the FCA’s concerns include:
- Lack of financial authorization for services provided.
- Warnings of potential risks for users engaging with Pump Fun.
- A directive to the public to avoid the platform.
In compliance, Pump Fun updated its terms of service and barred UK residents, marking the UK as a restricted jurisdiction.
The Rise and Controversy of Pump Fun
Launched in early 2024, Pump Fun quickly became a hub for Solana’s memecoin enthusiasts.
- Trading Dominance: Facilitated over $250 million in token trades, capturing 62% of Solana’s decentralized exchange (DEX) transactionsfi in November.
- Popular Tokens: Enabled the creation of tokens like PNUT and WIF, driving memecoin hype.
- Challenges: Faced backlash for inadequate content moderation and reports of misuse of its now-disabled livestreaming feature.
With its roots in the UK, Pump Fun's founders, operating under pseudonyms, have come under scrutiny. Legal experts warn that its lack of compliance with anti-money laundering regulations could result in further penalties.
Solana’s Reaction: CRYPTOCAP:SOL Remains Strong
Despite Pump Fun’s legal troubles, CRYPTOCAP:SOL has maintained its footing in the market.
- Price Movement: As of this writing, CRYPTOCAP:SOL is trading at 1.74% up, unaffected by the negative sentiment around Pump Fun.
- RSI Insights: The Relative Strength Index (RSI) at 53 suggests a balanced momentum, with neither overbought nor oversold conditions.
- Bullish Pattern: A bullish engulfing candlestick on the daily chart indicates buyer interest, even in uncertain times.
- Support Levels: If selling pressure increases, immediate support lies at the 61.8% Fibonacci retracement level.
What’s Next for Solana and Pump Fun?
Pump Fun's UK ban could set a precedent for stricter regulation of memecoin platforms, not just in the UK but globally. For CRYPTOCAP:SOL , its resilience underscores the ecosystem's ability to weather localized disruptions. However, the Solana community may need to address reputational risks tied to controversial platforms like Pump Fun.
Conclusion
While Pump Fun’s UK ban signals the growing scrutiny of crypto platforms, Solana's technical and fundamental strengths continue to shine. As CRYPTOCAP:SOL holds steady, this could present an opportunity for investors to consider its long-term potential amidst temporary market turbulence.

SOLANA NEXT STOP $300Solana has been outperforming ETH for a while now, not only on the charts and for investors but behind the scenes as well. Some simple price action coupled with the certainty retail traders have of SOL indicate a breakthrough of the ATH resistance, not to mention the bullish general market sentiment crypto has at the moment.
I would put SOL in the top 3 at the moment with good potential. If we do see confirmation of a breakthrough, there will obviously be some relief and a pull back and likely a retest of that key level which would now be acting as a support. This is where i would expect huge influx of liquidity from retail and commercial investors to further boost SOL on its upwards cycle towards my mid term target of $300 ($308 to be precise).

Why is SOLANA expected to reach $300 ?Hello and greetings to all the crypto enthusiasts, ✌
In several of my previous analyses, I have accurately identified and hit all of the gain targets. In this analysis, I aim to provide you with a comprehensive overview of the future price potential for SOLANA , 📚💡
In response to the query raised in the heading, Solana has consistently outperformed Ethereum across several critical performance metrics in recent months. This achievement is further bolstered by its highly skilled development team, which has successfully rolled out a series of strategic updates, solidifying Solana's position as a leader in blockchain technology through cutting-edge innovations. 📚✨
With its strong foundational strength, a price target of $300, reflecting a potential 27% price increase , seems entirely plausible. Additionally, technical analysis supports this optimistic outlook, suggesting that the upward trend is likely to continue. 📚🙌
🧨 Our team's main opinion is: 🧨
Solana has outpaced Ethereum in key performance metrics, backed by a skilled development team and strategic updates, positioning it as a leader in blockchain innovation. With strong fundamentals, a $300 price target and a 27% potential gain are well-supported by technical analysis, indicating continued upward momentum.
Thank you for your attention. If you have any questions or comments, I’m here to respond to you. 🐋💡

SolanaSol usdt analysis
Time frame 4 hours
Risk rewards ratio >3 👈👌
Base on technical analysis
Head and shoulders pattern is created . Then price dropped
Now the price is close to strong support
Solana reached new peak after 2 years and then dropped.
Now this support area is good to enter and give a good benefit

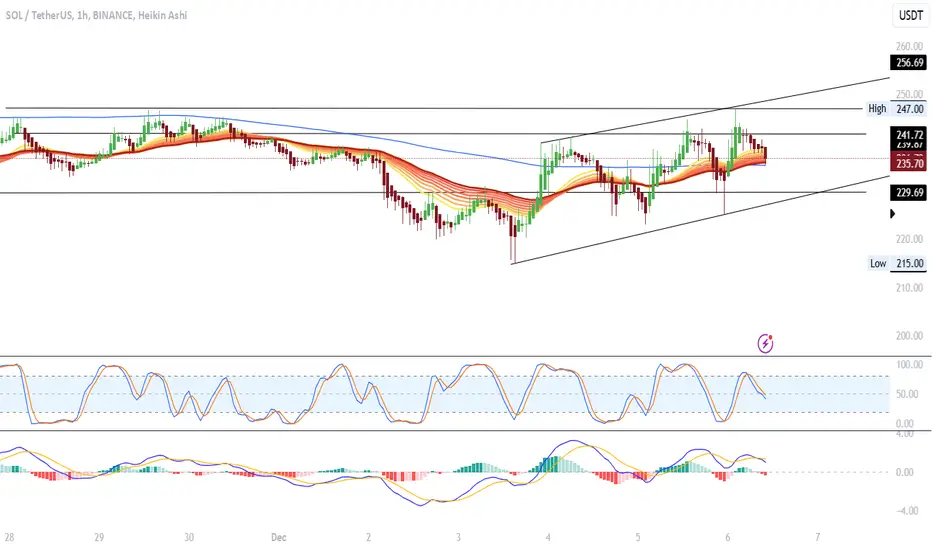
SOLUSDT 1H - Ascending Channel Under Selling PressureThe chart shows a sideways movement with an upward slope, within an ascending channel visible on the 1-hour timeframe. At the moment, the price is close to the dynamic support of the channel, but the indicators show selling pressure.
The EMA (Exponential Moving Average) suggests dynamic resistance, with the price finding it difficult to consistently break above it.
Support:
$229.69
$225.00: Considered a critical support, its loss could signal a broader reversal in the short term.
Resistance:
$241.72
$247.00: Upper resistance on the 1H chart, coinciding with the recent top. A break of this level could propel the price towards $256.69.
RSI (Relative Strength Index):
Indicates selling pressure.
MACD:
Also presents a bearish crossover, reinforcing the sell scenario at the moment.
Although the price of SOL/USDT is inside an ascending channel, the selling pressure indicated by the indicators (RSI and MACD) suggests that the price may test the supports before resuming the uptrend.