TradeCityPro | SOL Holds PRZ as Bulls Eye Range Breakout👋 Welcome to TradeCity Pro!
In this analysis, I want to review the SOL coin for you. This is one of the popular Layer1 projects, nicknamed the “Ethereum killer,” with a market cap of $85 billion, currently ranked 6 on CoinMarketCap.
📅 Weekly timeframe
In the weekly timeframe, after the bankruptcy news related to FTX, this coin had a very sharp bearish move and even dropped to as low as 9.84, but it managed to recover afterward.
⭐ From the key top at 27.62, a very strong bullish move started, reaching up to 255.96 and retesting its previous ATH.
📊 Currently, a range box has formed between the 128.66 and 255.96 levels, where the bottom of this box is a very strong PRZ, created from the overlap of a major support zone and the area between the 0.236 and 0.382 Fibonacci levels.
🔍 Also, the price is being supported by the SMA99, which has supported the price twice so far and has prevented the box from breaking to the downside.
⚡️ If you have already bought SOL, you can set your stop-loss if the price closes below this area. A confirmed breakdown could lead to deep corrections toward lower Fibonacci levels.
🛒 For buying this coin, the first trigger is the break of 178.22, which is a bit riskier but offers a good price entry. On the other hand, if the price revisits 128.66 and gives confirmation, we can enter from there.
📈 However, the main trigger for spot entry is the breakout of the 255.96 top. Breaking this level can unlock some very ambitious targets. If that happens, I’ll definitely update the analysis and provide those targets.
📅 Daily timeframe
In this timeframe, we can see the price action in more detail. A small range box has formed between 144.11 and 164.74, and the price is currently stuck below the top of the box and reacting to it.
✨ If 164.74 breaks, we can enter a long position. The next major resistance is 183.54. A breakout above that will serve as the main confirmation for a long position targeting 255.96, which can also be used as a spot trigger.
💥 The RSI oscillator is now above the 50 zone, and if it enters the Overbuy area, it will serve as strong momentum confirmation for this position.
✅ If the price gets rejected from the top, we can also open short positions on lower timeframes. A break below 144.11 will be the main short trigger.
📝 Final Thoughts
This analysis reflects our opinions and is not financial advice.
Share your thoughts in the comments, and don’t forget to share this analysis with your friends! ❤️
Solusdt

Bearish RSI Divergence on SOLUSDT (4H) – Patience Over FOMO!
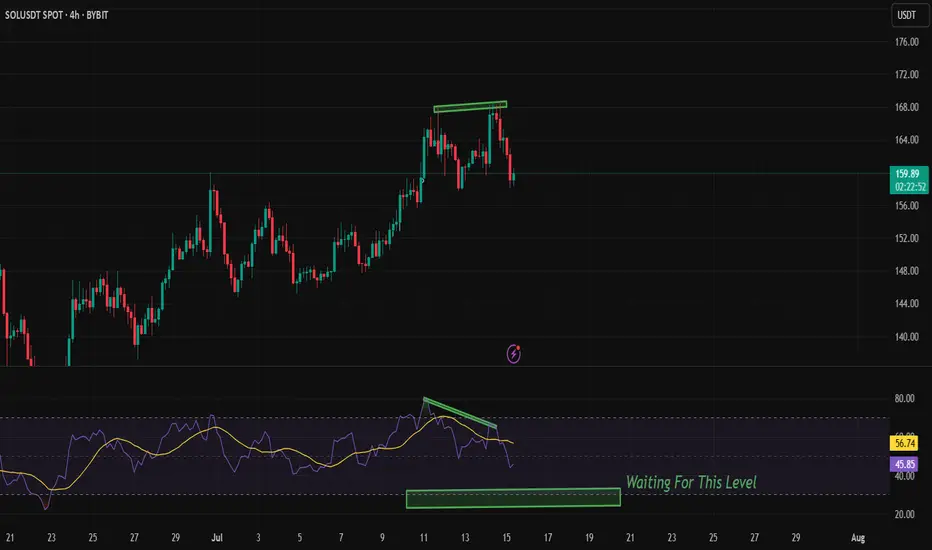
🚨 Observing a clear Bearish RSI Divergence on the 4H chart for $BYBIT:SOLUSDT.
While the price made a higher high, the RSI showed a lower high, indicating weakening bullish momentum.
🟣 RSI is now trending down and currently around 46.
💡 I'm waiting for RSI to approach the 30 level (oversold zone) before considering a long entry.
🎯 No rush to buy — I prefer to wait for confirmation and a better risk-reward zone.
📅 Timeframe: 4H
📍 Plan: Waiting for RSI near 30
✅ Staying disciplined and avoiding emotional entries.
🧠 Let the setup come to you. Don’t chase the market.
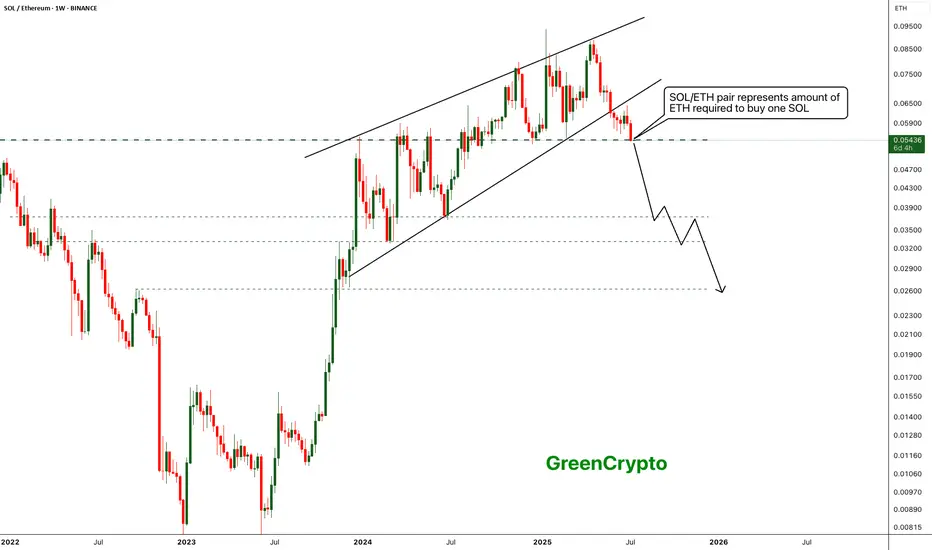
Ethereum is outshining Solona- Ethereum is finally outshining Solona
- ETH/SOL pair has broke down from the raising wedge pattern indicating clear bearish sentiment
- with the current bearish trend, we can expect the SOL/ETH pair to drop further down to 0.02630 range..
- This is clear sign the holder are preferring ETH or SOL
Stay tuned for more updates
Cheers
GreenCrypto
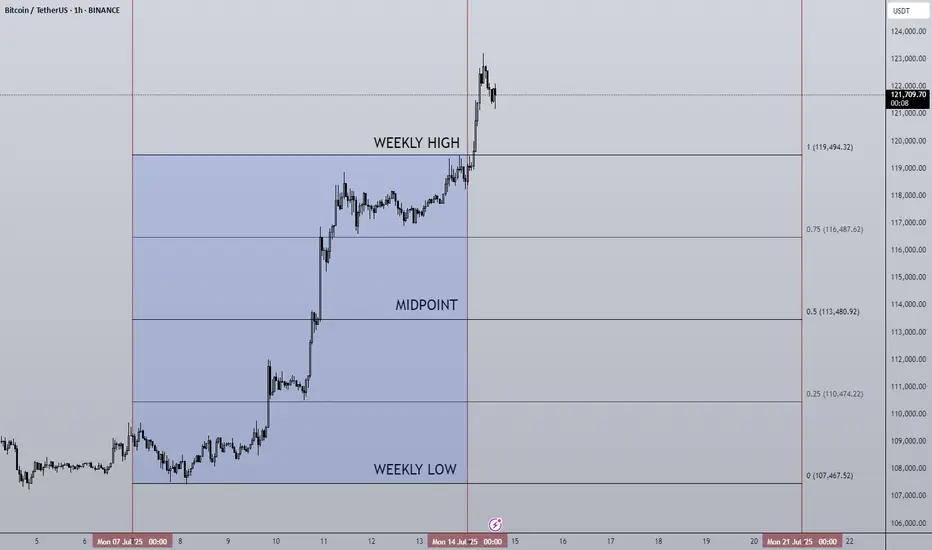
14/07/25 Weekly OutlookLast weeks high: $119,494.32
Last weeks low: $107,467.52
Midpoint: $113,480.92
NEW BTC ATH!
This is what we've all been waiting for, BTC breaks through resistance at $110,000-112,000 to set a the highest weekly close ever ($119,086). Thanks to a further $2.27B net inflows via BTC ETFs, the passing of the "big beautiful bill" flipping from a more deficit reduction stance by the US to an environment perfectly suited to risk on assets. Things are looking good for Bitcoin.
This week already in the Asia session BTC has broken above the weekly high to hit $123,100. Despite this incredible rally BTC.D has been falling since Thursday of last week. To me this signals altcoins have started to play catch up and we've seen that with ETH breaking $3000 (+14% relative to BTC).
I would like to see BTC consolidating here above the weekly high while altcoin majors break their choppy rangebound environments and shift to a trending environment just as BTC had last week.
There are also major data releases this week:
Tuesday CPI
Wednesday PPI
Thursday Euro CPI
Thursday US Initial Jobless Claims
I do not expect these data releases to have a major effect on the markets in their current state due to the risk appetite we've seen in both crypto and equities, such shallow pullbacks prove the demand is there to absorb and sell-side pressure for now.
Now is an excellent time to back strong projects with great fundamentals that are breaking out from downtrends/ranges in both their USD & BTC pairs, as BTC.D drops alts can print some great returns. Beta plays of ETH & SOL can offer higher returns than the majors themselves in these market conditions too.
Good luck this week everybody!
#SOL/USDT Loves THIS Pattern | BULLISH#SOL
The price is moving within a descending channel on the 1-hour frame, adhering well to it, and is on its way to breaking strongly upwards and retesting it.
We have a bounce from the lower boundary of the descending channel. This support is at 143.
We have a downtrend on the RSI indicator that is about to break and retest, supporting the upside.
There is a major support area in green at 142, which represents a strong basis for the upside.
Don't forget a simple thing: ease and capital.
When you reach the first target, save some money and then change your stop-loss order to an entry order.
For inquiries, please leave a comment.
We have a trend to hold above the moving average of 100.
Entry price: 149.
First target: 153.
Second target: 156.
Third target: 159.
Don't forget a simple thing: ease and capital.
When you reach the first target, save some money and then change your stop-loss order to an entry order.
For inquiries, please leave a comment.
Thank you.

SOLANA's Situation, A Comprehensive Analysis (1h) !!!The price on the 1-hour timeframe is within an ascending triangle, which can be promising. If the price breaks this pattern with bullish candles, it could easily rise by the distance of AB=CD .
Best regards CobraVanguard.💚

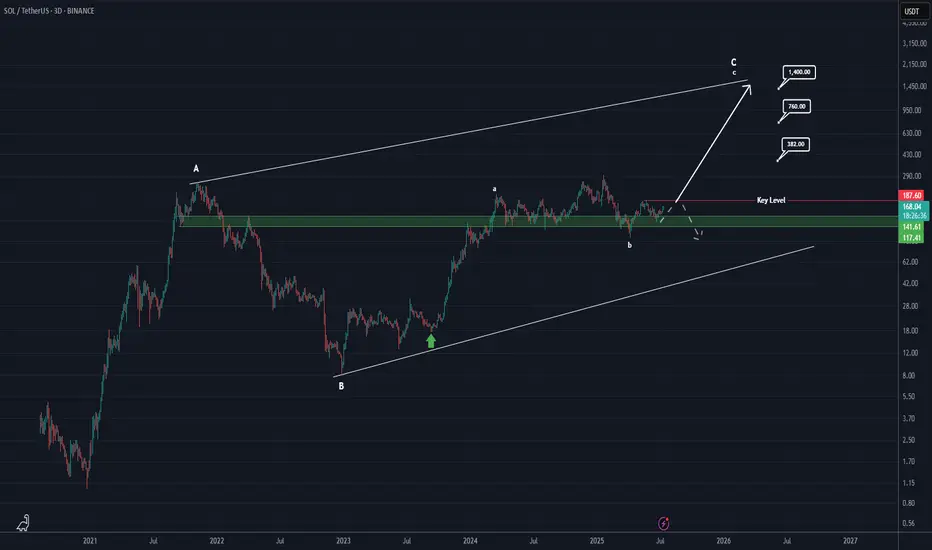
Will Solana reach $1400?After analyzing Solana’s complete data, it appears that a large diametric pattern is forming in the long term.
Currently, it seems we are in wave c of C.
If the key level of $187 is broken and price consolidates above it, we can be much more confident that we are indeed in wave c of C, confirming this scenario.
However, if the price fails to break and hold above $186 on higher timeframes like the 3D or weekly, and gets rejected downward, this scenario will be invalidated.
If confirmed, the targets for wave c of C are marked on the chart.
For risk management, please don't forget stop loss and capital management
When we reach the first target, save some profit and then change the stop to entry
Comment if you have any questions
Thank You
sol sell midterm"🌟 Welcome to Golden Candle! 🌟
We're a team of 📈 passionate traders 📉 who love sharing our 🔍 technical analysis insights 🔎 with the TradingView community. 🌎
Our goal is to provide 💡 valuable perspectives 💡 on market trends and patterns, but 🚫 please note that our analyses are not intended as buy or sell recommendations. 🚫
Instead, they reflect our own 💭 personal attitudes and thoughts. 💭
Follow along and 📚 learn 📚 from our analyses! 📊💡"

"Solana Heist in Progress! Will the Breakout Hold or Fake Out?"🔥🚨 "SOLANA HEIST ALERT: The Ultimate Bullish Raid Plan (Breakout or Fakeout?)" 🚨🔥
🌍👋 Greetings, Market Pirates & Profit Bandits!
(English, Spanish, Portuguese, French, German, Arabic—we speak MONEY.)
💎 STRATEGY BASED ON THIEF TRADING STYLE 💎
(High-risk, high-reward—steal the trend or get caught in consolidation!)
🎯 MISSION: SOL/USD (Solana vs. Dollar) CRYPTO HEIST
🐂 Direction: LONG (But watch for traps—cops & bears lurk nearby!)
🚀 Escape Zone: ATR line (High-Risk Profit-Taking Area)
⚠️ Warning: Overbought? Reversal? Police line at resistance? TAKE PROFITS EARLY!
📈 ENTRY: "THE BREAKOUT HEIST BEGINS!"
Trigger: Wait for candle close ABOVE 148.50 (MA)
Alternative Entry: Buy stop above MA OR buy limit on pullback (15m-30m TF)
🛎️ SET AN ALERT! Don’t miss the breakout—thieves strike fast.
🛑 STOP LOSS: "DON’T GET CAUGHT!"
Thief SL: 136.00 (2H Previous structure Swing Low) (Adjust based on your risk & lot size!)
⚠️ Warning: If you ignore this, you’re gambling—your loss, not mine.
🎯 TARGET: "LOOT & BOUNCE!"
🎯 167.00 (or escape earlier if the trend weakens!)
🧨 Scalpers: Only play LONG—use trailing stops to lock in gains!
📢 NEWS & RISK WARNING
🚨 Avoid new trades during high-impact news! (Volatility kills heists.
🔒 Use trailing stops to protect profits if the market turns.
💥 BOOST THIS HEIST! (More boosts = more profit raids!)
👉 Like ✅ | Follow 🚀 | Share 🔄
💬 Comment your take—bullish or bearish trap?
🚀 Next heist coming soon… Stay tuned, bandits! 🤑

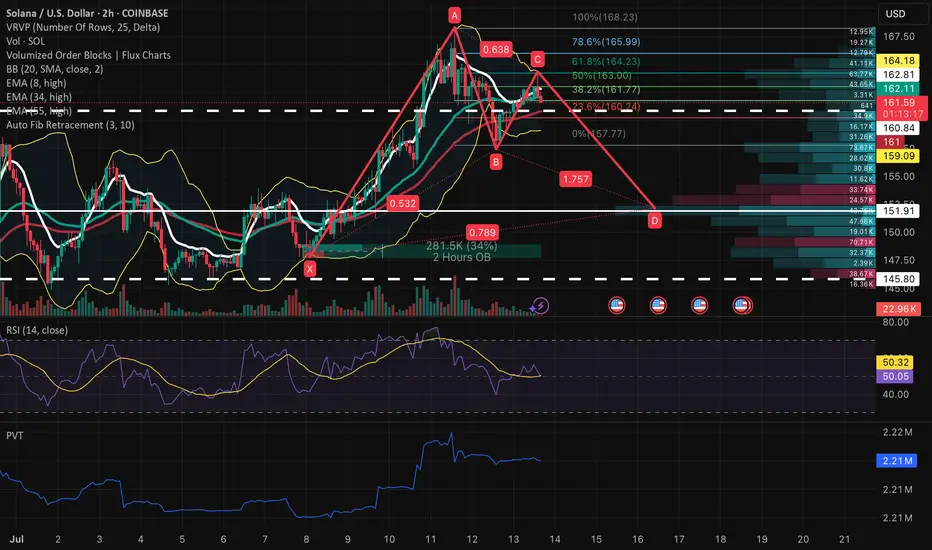
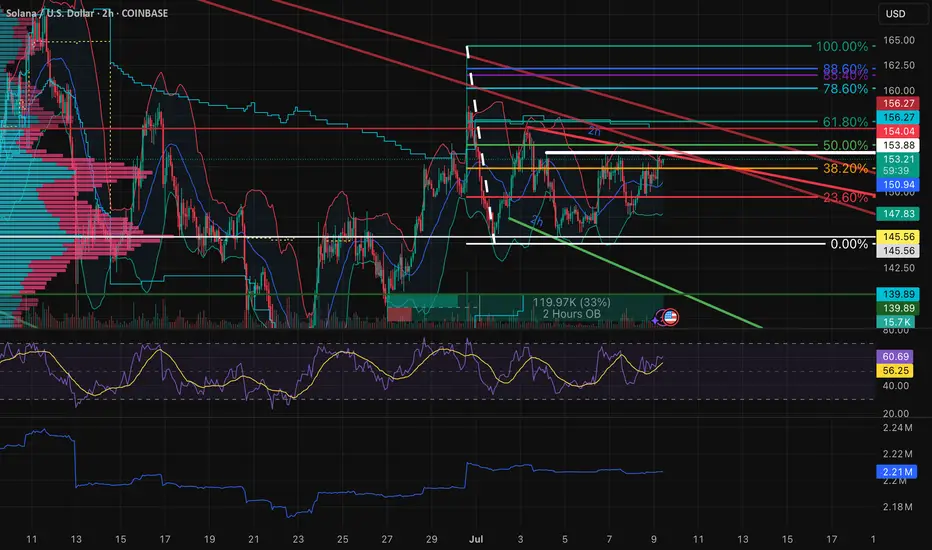
Projected Harmonic Extension Into Key Demand Zone (157–152 WatchMacro to Micro Context
SOL is currently reacting off a short-term distribution zone between 164 and 168 after an impulsive run-up from early July. While no complete harmonic has printed yet, the structure forming resembles a potential Bearish Gartley. The CD leg shown is not yet confirmed, but represents a projected path derived from the local point of value and volume geometry on the 2H chart. The area between 157 and 152 remains the primary zone of interest, given historical demand and high-volume node alignment.
Structural and Momentum Breakdown
XABCD Estimate:
XA was impulsive, AB retraced 53.2%, and BC retraced 63.8% of AB
CD projection is speculative, drawn from the confluence of the BC extension (1.757), 0.786 retrace of XA, and the local value zone around 157.5–152
Volume Profile: Substantial volume shelf aligns with projected CD completion. Above 164, volume thins out sharply, indicating inefficiency and risk of rejection
Order Blocks: 2H bullish OB from July 1–3 sits directly inside the 157–152 range, adding further structural validity to this projected leg
Momentum Signals:
RSI is stalling below mid-band (50–60), suggesting loss of buyer momentum
Price Volume Trend (PVT) shows deceleration post-surge, potentially preceding distribution
Bollinger Bands are compressing, which often leads to volatility re-expansion following trend exhaustion
Trade Plan
At this stage, the CD leg remains a hypothesis based on value structure and harmonic geometry. The trade plan focuses on preparing for potential long entries if price moves into the estimated completion zone with supportive signals.
Watch Zone for Long Setup: 157.5 to 152.5
Invalidation: Clean break below 147 suggests breakdown and invalidates harmonic idea
Take-Profit Targets on Reversal:
TP1: 161.5 to 163.0
TP2: 165.5 to 168.0
Required Confirmation:
Bullish divergence on RSI or PVT bounce
Reclaim of 2H order block zone with impulse and follow-through
[UPD] Trend analysis: BTC / ETH / SOL / XRP and other Just recorded a new video overview of the crypto market and the current trend developments in major coins: CRYPTOCAP:BTC , CRYPTOCAP:ETH , CRYPTOCAP:SOL , CRYPTOCAP:XRP , CRYPTOCAP:LINK , GETTEX:HYPE , BSE:SUPER , $FLOKI.
Among the new assets on my radar I shared my view on the trend structure of $RENDER.
In my personal investment planning, I continue to treat any potential corrections into key support zones as opportunities to add or open new positions.
Thank you for your attention and I wish you successful trading decisions!
If you’d like to hear my take on any other coin you’re tracking — feel free to ask in the comments (just don’t forget to boost the idea first 😉).

Can SOL break out strong and rally 12% to $185?Hello✌
let’s dive into a full analysis of the upcoming price potential for Solana📈.
BINANCE:SOLUSDT is forming a clear inverse head and shoulders pattern near a strong daily support zone, signaling a potential trend reversal. This setup suggests at least a 12% upside, targeting $185, marking a promising start for SOL’s next bullish move. 📊🔥
✨ Need a little love!
We pour love into every post your support keeps us inspired! 💛 Don’t be shy, we’d love to hear from you on comments. Big thanks , Mad Whale 🐋

SOL USDT SCALP Long / Buy Setupwait for the entry and then take, as liquidation still lies upside, chances are high that sol will re-visit 164, before any major move to the downside. SL is important on any side. We took good profit on previous SOL short setup.
The 1.414 Fib – Smart Money’s Darkpool Fib📐💸 The 1.414 Fib – Smart Money’s Darkpool Fib 🔍🧠
Let’s talk about the 1.414 Fibonacci extension — also known as √2 — a subtle but deadly precise level that smart money uses to trap retail.
We saw this play out perfectly on Solana.
That ~$295 zone (close to 300$ but 'no cigar') ?
That was the 1.414 Fib , and it nailed the top before a brutal reversal — a textbook darkpool distribution move.
But Solana wasn’t alone.
🔁 This Isn't Just About SOL
The 1.414 (√2) level has repeated across the crypto market , quietly acting as a marker for institutional exit zones:
📉 It showed up on multiple altcoins in December 2024, just before the entire altcoin rejection
🟠 It’s even been visible recently on Bitcoin itself — yes, even the king of crypto respects this level
So no — this isn’t random. This level has a story to tell.
🤖 Why 1.414 Matters
Most retail traders fixate on the golden ratio: 1.618.
But the 1.414 (√2) is just as important — and arguably more manipulative.
It allows institutions to:
- Front-run major Fibs
- Exit quietly
- Trap late bulls
It’s less obvious, less crowded, and often more effective.
That’s why I call it the "Darkpool Fib."
💔 Why I’m Divorcing Altcoins — But Not Yet
Solana’s chart — and its story — are symbolic of a deeper shift in me as a trader.
I’ve made the decision: at the end of this cycle , I’ll be divorcing altcoins.
Not out of hate — but out of clarity. I won’t “believe” in them anymore. I’ll just trade them.
But let’s be clear:
That moment isn’t now.
Right now, I’m still bullish. I still see opportunity. I’m here to ride the structure — while it’s still giving, or at least going to give something back.
📍Take Solana...
🔹 It was built on Rust, a language praised for speed and performance — perfect for high-throughput, data-heavy blockchain architecture
🔹 It could have been the chain that led us into the future
🔹 Instead, it’s become a memecoin playground , with repeated outages and centralized concerns
I don’t hate it. I just don’t believe in it the way I used to.
Narratives die. Structure doesn’t.
So yes — I’m trading SOL. I respect its levels. But I’ve let go of the idea that it will “change the game.”
I’ll trade the rally. I won’t marry the story.
📊 The Technical Setup
[📍 Support Zone: $153.48 $140.44
Below that, deeper support at $130.17 and $112.12
📍 Current Price: ~$158
📍 Upside Targets:
Minor: $196.80
Mid-channel: $221.53
Structural resistance: $234.97
Upper red trendline: $271.07
Final Extension: ~$325–$362
Potential: 271$, 362$, 490$(close but no cigar of the 500$ mark), 593$ technically is the ultimate resistance.
If Solana reclaims its momentum, this setup gives plenty of upside. But let’s be surgical. We are traders first.
⚠️ Final Thought
We’re in the phase of the cycle where hope is expensive.
Structure is free — if you choose to follow it.
Buy over support
Exit near resistance
Trade the level — not the label
One Love,
The FXPROFESSOR 💙
Disclosure: I am happy to be part of the Trade Nation's Influencer program and receive a monthly fee for using their TradingView charts in my analysis. Awesome broker, where the trader really comes first! 🌟🤝📈

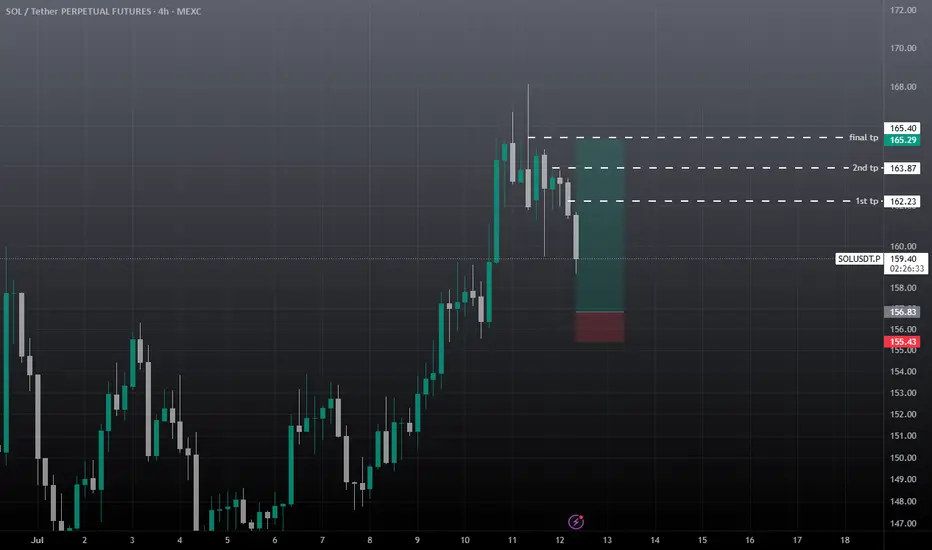
SOL Sell / Short SetupSell at cmp 163.49, 2nd entry mentioned and tp also mentioned, Must keep SL, best of luck.

SOLUSDSell SOLUSD Candle Stick Pattern
SL TP EP All In Charts Prolong your targets but risk free and book partially your trade
Lets see how it goes

[UPD] BTC / ETH / SOL / XRP / HYPE / SUPER / FLOKIUpdating my view on intermediate trend structures I am tracking in CRYPTOCAP:BTC , CRYPTOCAP:ETH , CRYPTOCAP:SOL , CRYPTOCAP:XRP , GETTEX:HYPE , BSE:SUPER and SEED_DONKEYDAN_MARKET_CAP:FLOKI highlighting key support and resistance zones to watch in the coming sessions
Charts featured in the video:
BTC
ETH
XRP
SOL
HYPE
SUPER
FLOKI
Thank you for your attention and I wish you successful trading decisions!
If you’d like to hear my take on any other coin you’re tracking — feel free to ask in the comments (just don’t forget to boost the idea first 😉).


BTC / ETH / SOL / XRP / HYPE: Potential Trend StructuresIn this video, I share my current daily and weekly analysis on the trend structures of BTC, ETH, SOL, XRP, and HYPE, highlighting key support and resistance zones to watch in the coming sessions.
Charts featured in the video:
BTC
ETH
SOL
XRP
HYPE
Thank you for your attention and I wish you successful trading decisions!
If you’d like to hear my take on any other coin you’re tracking feel free to ask in the comments (just don’t forget to boost the idea first 😉).

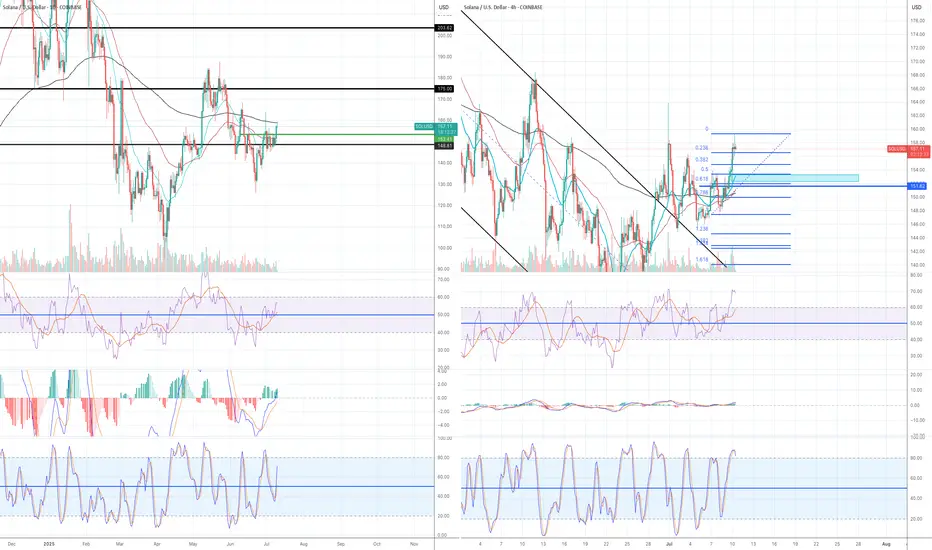
LONG - I am going to add more position when this happensI currently have a small size of long position but I am planning to add more (please see my previous article for my first trade set up), but I am waiting for a certain set up to come up:
Daily:
1) all momentum indicators are entering the bull zone, so there is a plenty of room to move to the upside.
2) The candle has crossed and closed above both EMA 21 and 55, but EMA 200 is currently working as a resistance.
3) EMAs have not crossed and lined up for the bull trend - 21> 55> 200
4H:
1) EMA55 has finally crossed above EMA200!! But when they cross, the price very often has a decent pull back before taking off.
2) Stochastic and RSI are already in the overbought territory which tells me the pull back is likely to happen.
The chart is looking really good for the bull but I am going to wait for the price to retrace to Fib0.5-0.618 zone (see blue rectangular box in 4h chart).
If the price rebounces from that zone and momentum indicators reset to move to the upside, I am prepared to go big on long.
$SOL | Triple Top or Launchpad?Macro to Micro Context:
SOL is now testing a third rejection in the upper 153s, forming a textbook triple top just under a multi-month descending trendline and major Fib resistance. This ceiling has held firm since late June, despite higher lows grinding up from below. Price is now squeezed tightly between compressing demand and stacked supply, with volatility contraction apparent across the board.
The structure is coiling hard but momentum and volume must confirm resolution before positioning aggressively.
Structural & Momentum Breakdown:
Resistance Layering (Reinforced):
Triple Top: Price has repeatedly failed to break above the upper 153s.
Fib Overlap: 50%–61.8% retracement range aligns with both trendline resistance and OB stack.
Order Block Stack: Resistance from mid-153s to low-154s is now reinforced across timeframes (30M → Daily).
Momentum Shifts:
RSI Divergence: Lower highs on RSI across 2H/1H, despite flat or slightly higher price.
PVT Flattening: No fresh accumulation during recent tests.
Volume Decline: Progressive volume deterioration on each retest distributional tone building.
Demand Shelf:
Key demand and support range from low-150s to mid-151s has held through three separate dips.
This is the immediate pivot zone — lose it and vacuum effect likely down into the upper 140s.
Updated Trade Plan:
Rejection Short Setup:
Entry: Breakdown through mid-151s with confirming sell volume.
Stop: Above low-154s to account for potential deviation wicks.
TP1: Upper 148s (first OB cluster).
TP2: Mid-146s (Fib + minor support).
TP3: Low 140s (macro demand + wedge base).
Bear Confirmation: RSI breakdown + volume expansion + OB flips into resistance.
Breakout Setup (Only on Clear Validation):
Entry: Strong candle close above low-154s with breakout volume.
Stop: Below low-151s — invalidation of reclaim.
TP1: Upper 157s (Fib zone).
TP2: Low 160s (swing high area).
TP3: Upper 160s (macro breakout expansion).
Bull Confirmation: RSI > 62 on 2H, strong PVT rise, and flip of local OB into demand.
Risk Warning:
Triple tops near macro resistance are high-risk unless clearly broken. This zone is overloaded with historical rejection. Don't front-run the breakout — volume will show you who's in control.
Closing Thoughts:
With a confirmed triple top now visible, SOL is facing its most important rejection zone in weeks. Bulls must reclaim with strength or this becomes a clean setup for rotation into the mid to low 140s. Patience and confirmation are key here. Keep risk asymmetric.
Altseason, just a thought ! Basically, right now we’re chilling in a major confluence zone — a whole bunch of important levels are stacked right here.
We’ve got:
The 0.78 Fib retracement holding it down
Volume profile support giving us a comfy cushion
That good old accumulation support from 2019–2021 saying “welcome back”
…just to name a few.
IMO, we’re in that sneaky “deviation/manipulation” phase before the real markup begins — a.k.a. altseason is warming up in the locker room.
If we actually hit the bull flag target… well, let’s just say the numbers start looking spicy. But hey, let’s not get ahead of ourselves — things can (and probably will) move faster than you think.
Alright, that’s the vibe. Let’s see how it plays out. Good night! 😴🚀

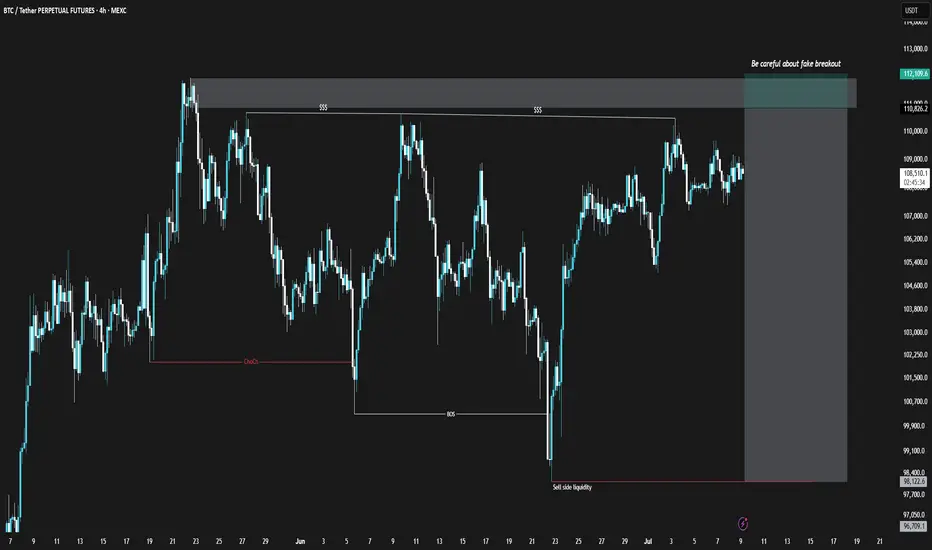
BTCUSDT Short Position (25/Jul/9)Bitcoin, similar to the TOTAL chart, is showing weakness in its bullish momentum. However, unlike TOTAL, the divergence in Bitcoin is clearly noticeable. Additionally, within the marked zone on the Bitcoin chart, there is a possibility of a fake breakout and liquidity grab. I suggest entering only with proper confirmation.
⚠️ This Analysis will be updated ...
👤 Sadegh Ahmadi: GPTradersHub
📅 2025.Jul.9
⚠️(DYOR)
❤️ If you apperciate my work , Please like and comment , It Keeps me motivated to do better