SOLUSDT Elliott Waves AnalysisHello friends.
Please support my work by clicking the LIKE button👍(If you liked). Also i will appreciate for ur activity. Thank you!
Everything on the chart.
Entry: market and lower (17-14$)
Targets: 30 - 40 - 50
after first target reached move ur stop to breakeven
Stop: (depending of ur risk). ALWAYS follow ur RM .
RR: 1 to 4
risk is justified
Good luck everyone!
Follow me on TRADINGView, if you don't want to miss my next analysis or signals.
It's not financial advice.
Dont Forget, always make your own research before to trade my ideas!
Open to any questions and suggestions
Solusdtidea

SOLUSDT Daily: 25/02/2023: let's see!You can see important levels and possible scenarios on the chart.
If you have a question feel free to ask.
💡Wait for the update!
🗓️25/02/2023
🔎 DYOR
💌It is my honor to share your comments with me💌

The target price for SOLUSD is 25.50
On the four-hour chart, SOLUSD has experienced a major decline, but has recently tested the support level at 21.5 twice and confirmed its effectiveness. This has resulted in a strong rebound, indicating a demand for an upward trend and clear bullish signals.
In the short term, the 21.5-22 range presents good buying opportunities, with a final profit target of 25.5. This is a long-term position, and those with large capital may consider following suit to capture maximum profits. For those with smaller capital , it is recommended to take advantage of short-term profits, and the chart provides suggested short-term exit points.
As an individual with deep research into cryptocurrency, foreign exchange, stock, gold, crude oil, and other futures products, I often provide updates on daily operations and positions. Thank you for your attention and support. If you have any questions, please feel free to leave a message, and I will provide the most reliable advice to assist you.
BINANCE:SOLUSD

SOLUSDT Elliott Waves Analysis (Local Setup)Hello friends.
Please support my work by clicking the LIKE button👍(If you liked). Also i will appreciate for ur activity. Thank you!
Everything on the chart.
Entry: market and higher
Target: 20 - 17 and maybe even ~15.5
after first target reached move ur stop in breakeven
Stop: (depending of ur risk). ALWAYS follow ur RM .
risk is justified
Good luck everyone!
Follow me on TRADINGView, if you don't want to miss my next analysis or signals.
It's not financial advice.
Dont Forget, always make your own research before to trade my ideas!
Open to any questions and suggestions.

SOLUSDT Idea✅ ✅ Risk warning, disclaimer: the above is a personal market judgment and analysis based on published information and historical chart data on The trading view,
And only some of these analyzes are my actual real trades.
I hope Traders consider I am Not responsible for your trades and investment decision.

#Solana SOL/USD -Daily chart#SOL - From analysing the chart, it is clear that the overall sentiment is bullish, meaning that we expected to increase.
However, it's important to take note that the relative strength index (RSI) is quite high, which may indicate that the market is overbought and could experience a short-term pullback.
Additionally, it's important to be aware of any resistance levels that may be present on the chart and to consider the historical patterns and trends. Despite the high RSI, it's important not to jump to conclusions and to evaluate the chart with a critical eye. It's essential to not make hasty decisions out of fear of missing out (FOMO) and to take a moment to think critically in order to come to a conclusion.
Overall, it's important to be careful and to make well-informed decisions.

SOL/USDT :: Everything is according to plan .SOL/USDT :::
It is moving regularly in the descending channel .
The price will make corrective movements by following the middle line of the channel, and then the price will increase .
<<< Good luck >>>

Solana SOL price may start correction in the coming daysA few days of the rapid growth of the SOLUSDT price has given many owners of the coin hope for super-strong growth.
But not everything is as good as it may seem at first glance.
Firstly, the SOLANA project is very much connected with FTX and Co (the show on this situation will last for many months, if not years). More details about the amounts involved and the number of SOLs involved with FTX we wrote in our previous ideas.
Secondly, the SOLUSD price is entering the liquidity zone of $13-16. In this zone, at least two groups of traders will sell SOL: those who unsuccessfully took a long position in November 2022 and sat through a 50% drawdown, and now will exit from the position to "zero" and those who bought SOL with limit orders at a liquidity level of $8, and now it's time to fix +70-100% profit.
In the medium term, we assume that the formation of a reversal pattern "Inverted Head and Shoulders" is possible
According to this pattern:
- risky buy zone of SOLUSDT around $10
- conservative purchase of SOLUSDT after a confident consolidation of the price above $16
The target for the development of this pattern is around $31
Given the fact that SOLANA is very much dependent on how the process of judicial proceedings over FTX and co. will take place. It is worth understanding that one news or tweet and the price of SOL can plummet.
Therefore, it is worth insuring your long positions with stops.
It is worth keeping limit orders to buy SOLUSDT around: $3.70, $2.25, $1.65 . And maybe someday you will be lucky with a super profitable purchase of SOL, like those who bought SOL a week ago at $8
_____________________
Did you like our analysis? Leave a comment, like, and follow to get more

SOLUSDT Elliott Waves AnalysisHello friends.
Please support my work by clicking the LIKE button👍(If you liked). Also i will appreciate for ur activity. Thank you!
Everything on the chart. (update)
Entry: market and lower (12.5 - 9$)
Target: 15 - 20 and 25-27$ zone.
after first target reached move ur stop to breakeven
Stop: (depending of ur risk). ALWAYS follow ur RM .
risk is justified
Good luck everyone!
Follow me on TRADINGView, if you don't want to miss my next analysis or signals.
It's not financial advice.
Dont Forget, always make your own research before to trade my ideas!
Open to any questions and suggestions.

A fast trade on solIt is a bearish market .
A fast trade on sol usd on a bearish basis .
A strong and fast sell we done . we must put a stop that shown in the graph as it couldnt pentrate the resisitance shown in the graph .
If it was broken we should leave it away

SOLUSDT forming Flag Pattern!!SOLUSDT (4h Chart) Technical analysis
SOLUSDT (4h Chart) Currently trading at $13.21
Buy level: Above $13.4 (Buy After Breakout)
Stop loss: Below $12.5
TP1: $14
TP2: $15
TP3: $16
TP4: $19
Max Leverage 3x
Always keep Stop loss
Follow Our Tradingview Account for More Technical Analysis Updates, | Like, Share and Comment Your thoughts

SOL : Bounce soon...Solana has been trading at its support zone in the daily and weekly timeframe and is also following the ETH 2018 Fractal.
Currently expecting a bounce from here to the next macro resistance zone.

SOLUSDT Elliott Waves Analysis (Local Setup)Hello friends.
Please support my work by clicking the LIKE button👍(If you liked). Also i will appreciate for ur activity. Thank you!
Everything on the chart.
Entry: market and lower
Targets: 14.8 - 15.5 - ~16
after first target reached move ur stop in breakeven
Stop: 12.7 (depending of ur risk). ALWAYS follow ur RM .
Risk/Reward: 1 to ~2.5
risk is justified
Good luck everyone!
Follow me on TRADINGView, if you don't want to miss my next analysis or signals.
It's not financial advice.
Dont Forget, always make your own research before to trade my ideas!
Open to any questions and suggestions.

SOLUSDT - price goes to liquidity- accumulation of 11 days
- no buyer's volume
- trend support
- on the third touch i am opening short position on the first leverage.
- on the fourth touch i am opening short position on the fifth leverage.
- liquidity under $13 level should be collected

SOLANA Local VisionHi everyone,
I will appreciate for ur activity. Thank you!
We are in an ascending channel , i decided to open a long position by market and buy limit order at 12.5
Targets: 15 - 16 - 17
Stop: 11.5
RR: 1 to 2
I hope my work suits you and you are satisfied.
DYOR!

SOLUSDT Elliott Waves AnalysisHello friends.
Please support my work by clicking the LIKE button👍(If you liked). Also i will appreciate for ur activity. Thank you!
Everything on the chart.
We're in global buy zone(15-10), good entry point for long-midterm deals.
2 possible scenarios on the chart,
orange if we will forming impulse in wave (c).
Yellow if we forming ending diagonal .
I'm tend more towards the yellow marker, because the orange implies a sideways movement in the supposed wave (iv) of (c) for another month and a half, which is too long for me.
Entry: market and lower (13-9$)
Target: 20 - 25 - 30 - 35
after first target reached move ur stop to breakeven
Stop: (depending of ur risk). ALWAYS follow ur RM .
risk is justified
Good luck everyone!
Follow me on TRADINGView, if you don't want to miss my next analysis or signals.
It's not financial advice.
Dont Forget, always make your own research before to trade my ideas!
Open to any questions and suggestions.

SOLANA - It's not as bad as it looks.After stopping the downtrend on the chart, there is a breakout with a breakout of the historical support level. In order for this breakout to be considered false, the price needs to return above support with bars of renewed buying on rising volumes.
There are sales through the claymatic, to confirm the purchases you need a test of this buyer, which stands at 12-15. Observe.
If you liked the idea, please like it. That's the best "Thank you!" for the author 😊
P.S. Always do your own analysis before a trade. Put a stop loss. Fix profits in installments. Withdraw profits in fiat and make yourself and your loved ones happy.

🟢 SOLUSDT - 1D (16.10.2022)🟢 SOLUSDT
TF: 1D
Side: Long
SL: $27.8799
TP 1: $32.7158
TP 2: $35.7075
TP 3: $38.1255
SOL RSI has given a buy cross signal on the 1D time frame.
Looks like a successful retest of the trend line so far as well.

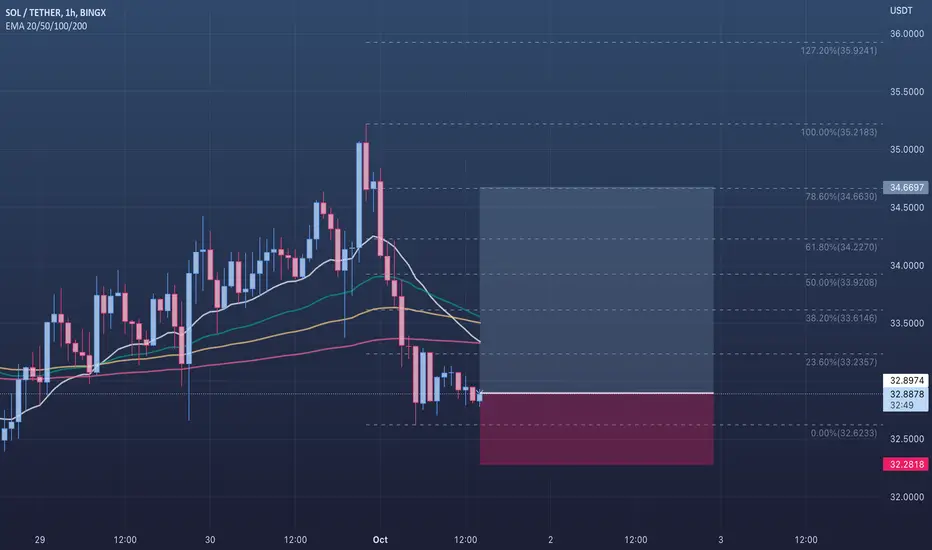
🟢 SOLUSDT - 1H (01.10.2022)🟢 SOLUSDT
TF: 1H
Side: Long
SL: $32.2818
TP 1: $33.2357
TP 2: $33.6146
TP 3: $33.9208
MY SOLUSDTPERPETUAL SIGNAL GAVE ALMOST 60% PEAK PROFIT WITH 20x MY SOLUSDTPERPETUAL SIGNAL GAVE ALMOST 60% PEAK PROFIT WITH 20x
My prediction idea is mentioned below.

🟢 SOLUSDT - 4H (22.09.2022)🟢 SOLUSDT
TF: 4H
Side: Long
Pattern: Double Bottom
Leverage: 5x
SL: $30.0260
TP 1: $32.1309
TP 2: $33.4331
TP 3: $34.4855
Possible double bottom on SOL so gonna try this with a tight SL.

SOLUSDT SK analysis buying setup cryptomarket reached our red buying zone WCL with good potential for bulls to move the market upward RR 1.73:1

SOLUSD in correction channel! SOLUSDTThe uptrend initially moved upward in a channel with a low and soft slope ( The white channel).
Then the price started to grow with a jump move in an ascending channel with a high slope (more than 70 degrees) (in the blue channel)
Now, in order to reach the balance and also to continue the uptrend, it should form a channel with an angle of about 40 degrees to 45 degrees, and for this reason, it has a correction and a short downtrend ( micro-channel), and then it continues to move upwards in the Red channel...
SOLUSD/ Solana vs Tether | SOLUSDT
--------------------------------------------------------------
Please write any advice or suggestions.
Dear friends, request any cryptocurrency pair, currencies pair for forex, and any index that you want to be analyzed and ask any questions.
Thanks for your attention
