Join the Golden Wave on Solana! Ride the Momentum and Long SOLSolana, the rising star of the crypto world, has been hitting nothing but golden crosses lately, and it's time for you to get in on the action!
If you've been keeping an eye on Solana, you already know that it has been making waves in the market. But what's even more remarkable is the consistent streak of golden crosses it has been hitting. 🌟 For those not familiar, a golden cross occurs when a shorter-term moving average crosses above a longer-term moving average, indicating a potential bullish trend. And boy, has Solana been delivering on this front!
With each golden cross, Solana has been defying gravity and soaring to new heights. The momentum is undeniable, and it's time for us to ride this wave together. By joining the Solana train, you have the opportunity to capitalize on its upward trajectory and make some serious gains.
So, what's stopping you from getting in on the Solana action? Don't miss out on the chance to be a part of this incredible journey. Here's your call-to-action: Long Solana today and seize the moment! 🚀
Why should you long Solana, you ask? Well, let me give you a few compelling reasons:
1. Unstoppable Momentum: Solana's golden crosses are a testament to its unstoppable momentum. It has consistently shown its ability to break through resistance levels and reach new highs. By going long on Solana, you position yourself to ride this incredible momentum and potentially enjoy substantial profits.
2. Growing Ecosystem: Solana's ecosystem is expanding rapidly, attracting developers, projects, and investors from all corners of the crypto world. With its high-performance blockchain and low transaction fees, Solana has become a favored platform for decentralized applications (dApps) and DeFi projects. By long Solana, you're not just investing in a single asset; you're investing in a thriving ecosystem with boundless potential.
3. Community Power: Solana's passionate community is a force to be reckoned with. With each golden cross, the community grows stronger and more enthusiastic. By joining this community, you'll be surrounded by like-minded individuals who are equally excited about Solana's future. Together, we can support and uplift each other as we navigate the exciting world of Solana trading.
So, my dear traders, the time is now. Long Solana and join the golden wave that's sweeping the crypto market. Don't let this opportunity slip through your fingers! Trust in Solana's golden crosses and let them guide you towards a brighter trading future.
Solusdtlong

Celebrating Solana's Incredible Performance - Time to Long SOL!Solana's recent performance has left many of us in awe, as it has consistently defied expectations and pushed the boundaries of success. The project's innovative technology, robust ecosystem, and growing adoption have undoubtedly fueled its meteoric rise.
Now, you might be wondering, "What's next for Solana?" Well, my dear traders, the answer is simple: it's time to long SOL and ride the wave of this unstoppable momentum!
With Solana's strong fundamentals, increasing institutional interest, and a vibrant community backing it, there's every reason to believe that this upward trend will continue. By strategically positioning ourselves to long SOL, we can potentially reap substantial rewards in the near future.
So, let's seize this opportunity and take advantage of Solana's bullish run. Here's your call-to-action:
1. Conduct thorough research: Dive deep into Solana's technological advancements, partnerships, and upcoming developments. Educate yourself about the project's potential and understand why it stands out in the competitive crypto landscape.
2. Analyze market trends: Keep a close eye on SOL's price movements, trading volume, and market sentiment. Look for patterns that can help you make informed decisions and identify favorable entry points.
3. Develop a trading strategy: Craft a well-thought-out plan that aligns with your risk tolerance and investment goals. Determine your entry and exit points, set stop-loss orders, and consider leveraging appropriate trading tools to maximize your potential gains.
4. Stay updated: Stay connected with reliable news sources, industry influencers, and Solana's official channels. By staying informed, you'll be equipped with the latest information to make timely decisions.
Remember, trading always carries risks, and it's important to exercise caution and conduct your own due diligence. However, with Solana's current trajectory and the positive sentiment surrounding it, the potential for profits is undeniably exciting.

SOLANA HITTING $40 - 31/10/23SOL (Solana) - The Power of Dollar-Cost Averaging
📌 Entry Point: Bought SOL at $15 (Dollar-Cost Averaging Strategy)
📌 Current Price: Just touched $40
💹 The Journey:
From an entry point of $15, SOL has shown promising and impressive growth, nearing a whopping 167% ROI as it grazes the $40 mark. This exemplifies the strength of the SOL ecosystem and the bullish sentiment surrounding it.
📈 Dollar-Cost Averaging (DCA): For those unfamiliar, Dollar-Cost Averaging is an investment strategy in which an individual divides up the total amount to be invested across periodic purchases of the asset. This strategy reduces the impact of volatility on large purchases of financial assets such as cryptocurrencies.
By DCA'ing into SOL at $15, we were not only able to lower the average cost of the asset over time but also benefited from its phenomenal run, minimizing the potential impact of short-term volatility.
🔍 Current Market Analysis:
As exhilarating as this climb has been, it's crucial to exercise caution. We're observing potential signs that SOL could face a healthy pullback. Testing the lows, support, and demand levels is a natural part of any asset's growth trajectory. As traders, it's essential to anticipate, protect, and capitalize on these potential moves.
🛑 Cautionary Advice:
Watch the Supports: Keep a close eye on key support levels. If SOL breaks below them, it might signal a more profound pullback, testing those demand levels we've previously seen.
Protect Your Profits: If you've achieved significant gains, consider setting stop losses or taking partial profits to protect your position.
Stay Informed: Always be aware of the broader market sentiment, and any news or developments related to Solana. A well-informed trader is a successful one.
🚀 Future Outlook:
For the long-term believers in Solana's tech and vision, holding this 'bad boy' for an extended period could prove rewarding. Solana's high-speed and low-cost transactions, combined with its growing ecosystem, give it immense potential in the crypto space.
However, always remember the golden rule: Never invest more than you can afford to lose. In the ever-evolving world of crypto, risks and rewards are two sides of the same coin.
Stay safe, trade smart, and here's to the continued success of our SOL journey! 🥂🌞📈

Solana Skyrockets to $35 as VanEck Predicts Unprecedented GrowthSolana, the rising star of the blockchain ecosystem, has just hit a staggering milestone, soaring to an impressive $35! But that's not all - brace yourselves for even more excitement as VanEck, a leading investment management firm, projects unprecedented growth for Solana in the near future!
This monumental achievement is a testament to the immense potential and resilience of Solana. With its lightning-fast transaction speeds and low fees, Solana has captured the attention of both retail and institutional investors alike. Now, with VanEck's bullish prediction, it's time to seize this opportunity and take your trading game to new heights!
So, why should you consider long positions on Solana? Allow me to present you with a few compelling reasons:
1. Unparalleled Scalability: Solana's architecture is designed to handle thousands of transactions per second, making it one of the most scalable blockchain platforms available. This scalability ensures that Solana can support a wide range of decentralized applications and attract more users and developers to its ecosystem.
2. Growing Ecosystem: Solana's ecosystem is expanding rapidly, with an increasing number of projects and dApps being built on the platform. This growth is a clear indicator of the confidence developers have in Solana's capabilities and its potential to disrupt various industries.
3. Institutional Support: VanEck's projection of unprecedented growth for Solana adds significant weight to its potential as a long-term investment. Institutions like VanEck have a deep understanding of market dynamics and their endorsement can instill confidence in traders looking for profitable opportunities.
Now, the big question is, how can you capitalize on this exciting development? It's simple - consider going long on Solana! By taking a long position, you can potentially benefit from the anticipated growth and capitalize on the upward momentum. Keep a close eye on the market trends, set your stop-loss orders wisely, and ride the Solana wave to potential profits!
Remember, trading always carries risks, and it's essential to conduct thorough research and seek professional advice before making any investment decisions. However, with Solana's recent achievements and VanEck's positive outlook, the potential rewards appear to be worth the calculated risks.
Don't let this opportunity pass you by - join the Solana revolution and embrace the potential for unprecedented growth! Keep a close watch on the market, stay informed, and make your move when the time is right.

Solana Wedge Formed with $40 Target - Time to Long Solana!I couldn't wait to share this incredible development in the Solana market with you.
So, here's the scoop: a fantastic Solana wedge formation has caught the attention of experts, and they predict a potential surge in its value, with a juicy $40 target on the horizon. Isn't that fantastic?
Now, I know you're probably wondering what this means for you and your trading strategy. Well, my friend, it's time to seize this opportunity and consider going long on Solana. With such a promising target, it's like finding a hidden treasure in the vast ocean of cryptocurrencies.
Why should you consider going long on Solana, you ask? Well, let me break it down for you. Solana has been making waves in the crypto space, gaining recognition for its lightning-fast transaction speeds, low fees, and robust infrastructure. Its innovative technology has attracted significant attention from both developers and investors alike.
Moreover, Solana has been gaining traction as a platform for decentralized applications (dApps), making it a potential game-changer in the crypto world. With its strong fundamentals and growing ecosystem, Solana is poised for incredible growth, and we don't want to miss out on this golden opportunity.
So, my friend, it's time to take action! Consider adding Solana to your portfolio and joining the long Solana movement. With the $40 target in sight, we have a chance to ride the wave of success together.
Remember, trading is all about seizing opportunities, and this Solana wedge formation is a clear sign that the time to act is now. Don't let this chance slip through your fingers!
If you need any additional information or assistance in making your trading decisions, feel free to comment below. I'm here to support you every step of the way.
Wishing you a profitable trading journey and a day filled with excitement!

Solana Launches New Incubator! Time to Long Solana!Solana just made a groundbreaking announcement that will surely pique your interest.
I'm thrilled to share with you that Solana, the high-performance blockchain platform, has recently launched its very own incubator program. This exciting development is set to revolutionize the Solana ecosystem, and I couldn't be more excited about the opportunities it presents for traders like yourself.
The Solana Incubator aims to foster innovation and support early-stage projects that leverage Solana's cutting-edge technology. By providing mentorship, funding, and resources, Solana is empowering talented developers to build groundbreaking decentralized applications (dApps) on their platform. This means that we can expect a surge of innovative projects popping up, pushing the boundaries of what's possible in the blockchain space.
Now, you might be wondering, "How does this benefit me as a trader?" Well, my friend, this is where the real excitement lies. With the launch of the Solana Incubator, we can anticipate a surge in interest and investment in the Solana ecosystem. As more talented developers flock to Solana, the platform's value is bound to skyrocket. And guess what? This presents an incredible opportunity for us to go long on Solana and potentially reap substantial profits!
By investing in Solana now, you position yourself at the forefront of a rapidly expanding ecosystem, backed by an exceptional team and a technology that outperforms many of its competitors. The Solana Incubator is a clear signal that the platform is gaining traction and attracting top talent, making it an ideal time to get in on the action.
So, my friend, don't miss out on this golden opportunity to long Solana and potentially ride the wave of success. Take action now, and let's position ourselves strategically to maximize our gains!
If you're ready to dive into the world of Solana and want to learn more about how to long it, I'd be more than happy to share some valuable insights, tips, and resources. Feel free to comment below, and let's embark on this exciting journey together!

Solana's Surge Unveils Massive Upper Target Zones!Our beloved Solana (SOL) has been on an incredible journey, and I couldn't wait to share this exciting development with each one of you. So, let's dive right into it!
In case you haven't noticed, Solana has been making waves in the crypto world, and its recent surge has unveiled some massive upper target zones that are nothing short of extraordinary. This surge has ignited a sense of enthusiasm and optimism among traders, and I strongly believe it's time to seize this golden opportunity.
Why wait on the sidelines when you can ride this remarkable wave of success? Solana's upward trajectory has been astounding, and the potential for further growth seems limitless. As the market continues to embrace Solana's innovative technology and scalability, we have every reason to anticipate a bright future for this incredible project.
So, here's my call-to-action for all you traders out there: it's time to consider going long on Solana! With its recent surge and the immense upper target zones that await, we have a chance to maximize our gains and be a part of Solana's remarkable journey towards success. Don't let this opportunity pass you by!
But remember, as always, it's essential to conduct thorough research, assess your risk appetite, and make informed decisions. While the market sentiment is positive, it's crucial to stay vigilant and keep a close eye on market trends and developments. By doing so, we can navigate the crypto landscape with confidence and make the most of Solana's potential.
So, let's embrace the positive vibes and take advantage of Solana's incredible surge. Longing Solana can be a rewarding decision, and I encourage each one of you to explore this opportunity further. Together, let's ride the Solana wave to new heights and celebrate our success!
If you have any questions, need guidance, or simply want to share your thoughts, please feel free to comment below. Let's support each other in this exciting journey and make the most of this incredible opportunity!
Happy trading and wishing you all the best!

Solana Breaks Through $32 Resistance! $40 Next Target?
I have some exhilarating news to share with you today that will surely put a smile on your face. Solana has just made a groundbreaking move by surging past the $32 resistance level, signaling a strong bullish trend for our favorite cryptocurrency.
But that's not all! The momentum is building, and experts in the field are now eyeing the next target for Solana: $40! Yes, you heard it right. With the recent surge in value, Solana is on the verge of hitting this significant milestone, and the excitement is palpable.
Why is this such a big deal, you may ask? Well, Solana's impressive performance is a testament to its growing recognition and adoption in the crypto space. Its lightning-fast transaction speeds, low fees, and robust ecosystem have captured the attention of investors and developers alike. As a result, Solana's value has been steadily climbing, making it one of the hottest cryptocurrencies to watch.
Now, here comes the exciting part: I invite you to join the Solana revolution and seize this incredible opportunity. By going long on Solana, you can potentially reap the rewards of its upward trajectory. With the $40 target in sight, now is the perfect time to consider adding Solana to your investment portfolio.
Here's a quick call-to-action for you:
1. Research: Dive deeper into Solana's technology, its partnerships, and the latest developments. Understanding the fundamentals will help you make informed decisions.
2. Strategize: Evaluate your investment goals and risk tolerance. Consider consulting with a financial advisor or doing your own analysis to determine the best approach for your unique situation.
3. Take Action: Once you have gathered all the necessary information, take the leap and start your journey with Solana. You can purchase Solana on popular cryptocurrency exchanges like Binance, Coinbase, or Kraken.
Remember, investing in cryptocurrencies involves risks, but it also offers the potential for significant rewards. So, why not ride the wave of optimism surrounding Solana and potentially benefit from its upward momentum?

📈Solana analysis, Weekly insight into price behavior📉BINANCE:SOLUSDT
COINBASE:SOLUSD
Hello Traders, please check out my previous ideas.
In the next few days, Solana is expected to stabilize between near the red area.
If the price breaks below the mentioned area, the price will drop to the level of 14$ (probably price receive support here) and then 13-12 area.
✌💥If you are satisfied with my analytical content, please share my ideas💥✌
✍🐱👤Otherwise, make sure you leave comments and let me know what you think.🐱👤✍
🤑🍾Thank you for your support. I hope you will gain profit by following my analyses.🍾🤑

Can SOLANA reach 100? Is it too soon?Yes I was looking short on Solana but SEC approved BTC-ETF. That's why every crypto pumps like its Bullrun. But few coins are much more likely to go even further and one of them is Solana. If we look closely Solana hadn't make Lower High since November 2021, all we had was little pullback to 140 area. If SOL close the candle below 32.5 in 1W TF I might consider to go in long position.

Solana's Potential Breakout to $55 - It's Time to Long!
If you've been keeping an eye on the market lately, you might have noticed Solana's impressive performance. This blockchain platform has been making waves and gaining significant attention from both investors and traders alike. With its lightning-fast transaction speeds and low fees, Solana is proving to be a formidable competitor in the crypto space.
But what's got me truly pumped up is the recent price action and technical analysis surrounding Solana. The charts are indicating that SOL is ready to embark on a remarkable journey towards the upper target of $55. This breakout could be a game-changer for those who take advantage of the opportunity to long Solana at its current price levels.
So, why am I so confident about Solana's potential? Let's dive into the details:
1. Bullish Momentum: Solana has been exhibiting strong bullish momentum, with consistent higher highs and higher lows on the charts. This upward trend suggests that there is a growing demand for SOL, and the market sentiment is overwhelmingly positive.
2. Supportive Volume: The recent surge in trading volume for Solana is a clear indication of increased market interest. Higher trading volume often accompanies significant price movements, and it reinforces the likelihood of a breakout to the upper target.
3. Technical Indicators: Various technical indicators, such as moving averages and oscillators, are aligning favorably for Solana. These indicators suggest that SOL is currently undervalued and poised for a potential upward movement.
Now, here comes the exciting part - the call-to-action!
If you're as enthusiastic as I am about Solana's potential breakout, I strongly encourage you to consider taking a long position on SOL. By doing so, you'll be well-positioned to ride the wave of this anticipated price surge and potentially reap substantial profits.
However, as with any investment, it's crucial to conduct your own research and make informed decisions. Keep a close eye on the market, study the charts, and evaluate your risk tolerance before making any trading moves.
Remember, timing is key when it comes to seizing opportunities in the crypto market. So, don't delay! Take action now and position yourself for a potentially rewarding journey with Solana.
Feel free to reach out if you have any questions or if you'd like to discuss further trading strategies. Let's make the most of this exciting opportunity together!

Another Bolish position for Solana ...Another head and shoulders pattern on Solana's chart...and the possibility of another rally for Solana to around $32.20 .
In the previous analysis, Solana reached exactly the predicted growth with a similar pattern...
Everything is ready to increase the price of Solana.

Solana Looking for Rise in its Price! {22/10/2023}Educational Analysis says SOLUSDT may go Long according to my technical.
This is not an entry signal. I have no concerns with your profit and loss from this analysis.
Why Long?
Broker Binance
Although the SOLUSDT Market is in a downward trend on a daily time frame, On 4 hours it is making higher lows and higher highs.
So one trade is already on with RR is 1:4.85
Disclaimer
I HAVE NO CONCERNS WITH YOUR PROFIT OR LOSS.
Happy Trading, Fxdollars.

SOL CHIEFbest time
The best place
The best area
the best candle
Currency performance
The best crypto
And this currency has always been the leader of all currencies with potential growth
Buy and enjoy
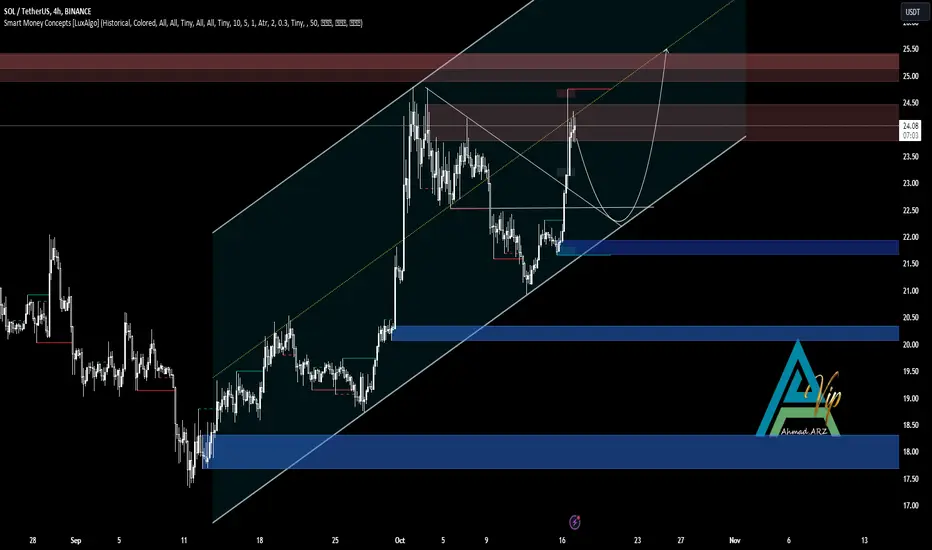
SOLUSDTSOLUSDT was trading in symmetrical triangle pattern. The price was reacting well the support and resistance of triangle.
Currently the price has given the breakout of triangle and now retesting the broken level where it is also forming a local support zone and seems like the price may go for another leg higher.
If the breakout sustain to upside the optimum target could be 26 followed by 30
What you guys think of this idea?

SOLUSDT - H4SOLUSDT
There may be either the end of the ABC correction or a continuation of the local downward movement. When the correction is completed, the nearest target will be at 24.70.
If we continue to move down, we can see targets at the level of 20.10
What can you expect?
Upward movement - if we see a breakdown of the level of 22.47 - local targets - 22.80 - 23.14 - 23.57 - 24.70. Cancellation of the idea when the level of 21.69 is broken
Downward movement - if we see a breakdown of the level of 21.69 - local targets - 21.39 - 21.00 - 20.66 - 20.10. Cancellation of the idea when the level of 22.47 is broken
Long
Targets – 22,80 - 23,14 - 23,57 - 24,70
Short
Targets – 21,39 - 21,00 - 20,66 - 20,10

#SOLUSDTLast setup on this CRYPTO pair hit our first target zone. Awaiting for the price to drop our new zone where we can enter new position.
Keep Supporting!!

SOLUSDTSOLUSDT is in strong bullish trend.
As the market is consistently printing new HHs and HLs.
currently the market is being respected by inclining trendline and has also formed bullish flag pattern which is also being supported by inclining trendline.
These two to gather putting strong bullish confluence for the pair.
What you guys think of this idea?

SOL forming a descending wedge to $29SOL made a a new high and now consolidating and getting ready for the new legup.Each rectangle has 3 points where are important, above the mid line , mid line and below the mid line. holding above it is bullish. midline is 50/50, below mid line is leaning towards bearish and more downside.
Cya guys at $29

Solana Skyrockets: Breaking Through Resistance with $30 TargetSolana, the blockchain platform known for its lightning-fast transaction speeds and low fees, has been making waves in the crypto market lately. Its recent surge in popularity is not without reason - Solana's innovative technology and impressive ecosystem have caught the attention of both investors and developers alike.
But let's talk about the breakthrough that has everyone buzzing. Solana's price has been on an unstoppable upward trajectory, and it has now successfully broken through the resistance level that has been holding it back. This is a significant milestone that signals a potential bullish trend ahead!
With this new target of $30, Solana is poised to continue its meteoric rise in the coming days and weeks. The market sentiment surrounding SOL is overwhelmingly positive, and this breakthrough could be just the beginning of an even greater surge.
So, what does this mean for you as a trader? It's time to seize this golden opportunity and consider going long on Solana! By taking a long position, you can potentially profit from Solana's upward momentum and ride the wave of its success.
Don't miss out on this exciting chance to be part of Solana's incredible journey. Here's your call-to-action: consider opening a long position on Solana (SOL) today and position yourself for potential gains. Remember, as with any investment, it's important to conduct your own research and make informed decisions.
Reach out to me with any questions or concerns you may have by commenting below. We're dedicated to supporting you on your trading journey and helping you make the most of this thrilling market opportunity.
Stay tuned for further updates on Solana and other exciting developments in the crypto space. The world of cryptocurrency is constantly evolving, and there's never a dull moment!


SOL reach all Targets and here is higher one1h time frame
-
According to our previous analysis about SOL, this Head and Shoulders has been providing lots momentum to pump.
Here is the best timing to set protective stop to avoid unrealized profit gone.
Adjust SL from 18 to 22 or 20
Also, if you remain partial positions, I set two higher targets at 25.1 and 28.3, which are the next resistance zones.
Previous post as below.

[EN] Solana restructures to the upside // GaliortiTradingAfter overcoming the 2021 bearish trend line, the stock has performed a pull-back and rested on its long-term bullish trend line. From there, BINANCE:SOLUSDT restructured to the upside .
Donchian channels restructured to the upside .
After 127 weeks the RSI attacks for the third time its long term bearish trend line . If it breaks above it, the upward stretch would be considerable, with its first target at $49 . Medium-term target: $140 .
Pablo G.
