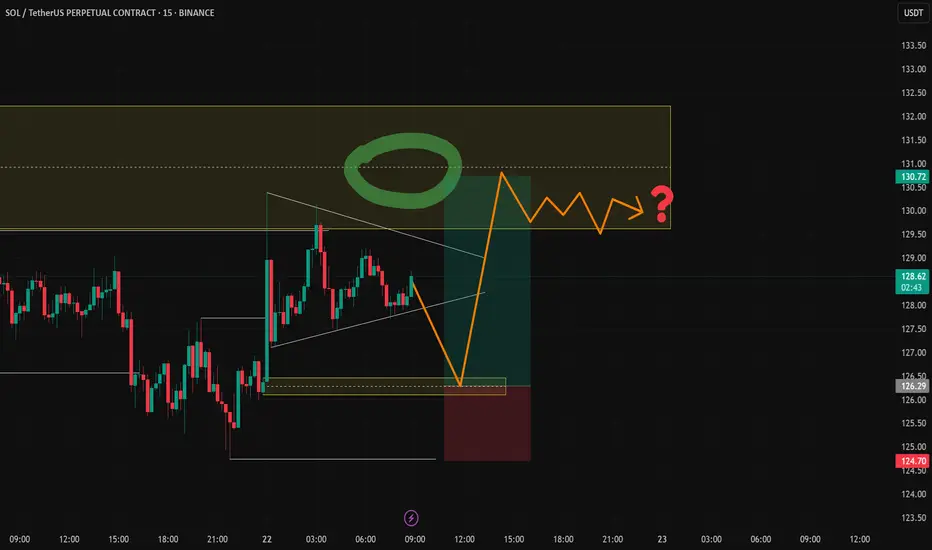
solana trade setup 15min chart* if you are trading on market orders need to set limit order *
i say this because last week it has going all directions and playing with strict levels are important
just spotted a triangle forming which could be drying up in volume as of recording this chart setup it saturday where major market remains closed the volume and volatility will be low
buy area 126-126.50 target 130.5 to 131 sl 124.70-50
triangle is trap for liquidation be careful !!
SOLUSDTPERP
#SOL/USDT#SOL
The price is moving in a descending channel on the 1-hour frame and is expected to continue upward.
We have a trend to stabilize above the 100 moving average once again.
We have a downtrend on the RSI indicator that supports the upward move with a breakout.
We have a support area at the lower boundary of the channel at 121.60.
Entry price: 126
First target: 129
Second target: 132
Third target: 135

SOL/USDTHello friends
Given the downward trend we had, the price has reached a good support area and if the area is maintained, you can enter a buy trade and move to the specified targets with it.
*Trade safely with us*

SOLUSDT: Strong Bounce from Major Support!!BINANCE:SOLUSDT has shown a strong recovery after hitting a major support zone around $110. This bounce is accompanied by good trading volume, indicating growing interest. Investors who missed the previous rally are now accumulating, which adds further strength to the bullish sentiment.
As market conditions improve, the entry of bigger players could push SOL towards higher highs. If momentum continues, there’s potential for SOL to breach its previous all-time high, with a long-term target of $500 in sight.
For investors, this presents a solid buying opportunity to hold for the long term. Traders, however, should manage their risk carefully and always set a stop loss to protect their capital.
BINANCE:SOLUSDT Currently trading at $132
Buy level: Above $110
Stop loss: Below $90
Target : $500
Max Leverage 3x
Always keep Stop loss
Follow Our Tradingview Account for More Technical Analysis Updates, | Like, Share and Comment Your thoughts

Long-term Solana (SOL) OutlookExpecting a further drop in price to a range of $10-$40 before a bull run to possibly another ATH. Sentiment and price pattern is similar across all major cryptocurrencies. HODLing would be extremely stressful during this bear run.
This is only my opinion and should not be taken as an investment advice. The market can of course, turn at any point in time.

SOL/USDT BUYHello friends
Given the price reaching resistance and price correction, now the best conditions have become to buy in stages and with capital management. We have also specified price targets for you.
*Trade safely with us*

#SOL/USDT#SOL
The price is moving in a descending channel on the 1-hour frame and is adhering to it well and is heading to break it upwards strongly and retest it
We have a bounce from the lower limit of the descending channel, this support is at a price of 157.48
We have a downtrend on the RSI indicator that is about to break and retest, which supports the rise
We have a trend to stabilize above the Moving Average 100
Entry price 159.85
First target 165.92
Second target 169.59
Third target 175.10

SOL BUY ZONE FOR LONGTERM. As you can see on chart that I have pointed out every single point and reversal area forsolusdt. Its shortterm support line is at 120$. And if it lost then we can go lower to the 89-84 area which is our major DEMAND ZONE.

#SOL/USDT Weekly overview!Solana is down 57% from its peak and is currently trading just below the 63-week support level.
This is a crucial level! The last weekly candle closed right above the support, but for now, it seems we’ll need to wait a few more days for more clarity.
It could either turn into a nice juicy dip or signal the start of a bearish price action. I personally think it's a dip,
Either way, it’s better to wait for the weekly close for more clarity.
Do hit that like button and share your views in the comment section.
Thank you
#PEACE

Solana (SOL) Holding Strong – Can It Reclaim $200?Solana (SOL/USDT) is currently testing a critical support zone around $140, aligning with a long-term ascending trendline that has provided strong support in previous market cycles. The 50-week EMA ($168.03) is also acting as dynamic resistance, making this an important decision point for the market.
The recent pullback from resistance at the previous ATH zone suggests some profit-taking, but if SOL can hold this key support level, a bullish reversal could follow, pushing prices back toward $200+ in the coming weeks.
However, a break below $140 could lead to a deeper retracement toward the trendline support around $100-$120.

Solana (SOLUSDT) is Not Dead! A Major Move is Coming! Solana (SOL) is holding strong at its major support level of $110, making this an ideal accumulation zone between $110 and $140. With CME Group launching SOL Futures on March 18th, institutional interest could surge, potentially triggering a massive rally. As Solana gears up for a recovery to previous highs, this could be a prime opportunity to buy and hold for the long term. Don’t miss out—accumulate
BINANCE:SOLUSDT Currently trading at $144
Buy level: $110 - $140.
Stop loss: Below $90
Target : $500
Max Leverage : 1x /Spot trade
Always keep Stop loss
Follow Our Tradingview Account for More Technical Analysis Updates, | Like, Share and Comment Your thoughts

SOL BuySOL/USDT Analysis & Trade Signal
Chart Overview:
The Solana (SOL/USDT) chart is on a 4-hour timeframe.
The price is currently in a downtrend, trading inside a descending channel.
Major support zone: $124 - $112 (marked in red).
Major resistance zones: $152, $177, $227, and $285.
Trade Plan & Signal:
📌 Buy Zone (High Risk Entry):
The price is around $124.67, which is near the support zone.
The chart suggests waiting for a strong bullish candle before entering.
If the price holds this support, it could trigger a reversal.
📌 Stop Loss:
Below $112.93 to minimize risk.
📌 Target Levels:
First target: $152
Second target: $177
Third target: $227
Final target: $285
📌 Risk Management:
If the price breaks below $112, the downtrend could continue.
Enter only after confirmation of a bullish reversal.
Conclusion:
Bullish scenario: A bounce from $124 could lead to $152+ targets.
Bearish scenario: A break below $112 might push the price lower.
Recommendation: Wait for a bullish confirmation before entering.
Would you like further analysis or modifications in risk management? 🚀

SOL - LONGSOL has fallen 50% from its ATH, it looks risky but it's a good opportunity to trade. I think it's a medium-risk trade, it's worth taking.

SOL (SOLANA) at a critical point - DON'T MISS OKX:SOLUSDT
Solana is my favourite crypto
You can see all my ideas related to SOL are always valid and realize regardless of the time factor involved.
Just like Weeknd says I can proudly state the obvious:
SOLANA is timeless.
Let me give you another vision (The mind stone is intact here in this vibranium built 🤣)
First Target 230
Second Target 257
Third Target 280
Thats it. If the institutions don't buy from here then get ready for an ass whopping of 149 then 131
Which I'm pretty sure is not what bulls want the bears to drag the price down.
Much Love 🌺🪢

Solana: Poised for a Breakout Towards a New All-Time HighSolana (SOL) is currently trading at the expanding channel support level of $163.69, a critical demand zone that presents a strategic entry point for long positions. A successful rebound from this level could drive the price toward the initial resistance at $206.38.
If SOL manages to break above and sustain momentum beyond this minor resistance, it could confirm a bullish continuation, targeting the expanding channel resistance. A breakout at this level would pave the way for a potential rally towards a new all-time high at $327.32.
However, if SOL fails to hold the expanding channel support and experiences a breakdown, selling pressure may intensify, pushing the price toward the major support level at $124.29. This level could serve as a crucial re-entry point for buyback opportunities.
Fundamental analysis :
On March 1, 2025, approximately 11.2 million SOL tokens—equivalent to 2.29% of the total supply—are scheduled to be unlocked. This event could introduce significant downward pressure on SOL's price, potentially triggering a bearish movement as market participants anticipate increased sell-side liquidity.

Sol turning bearish!Sol swept the highs but failed (which was a short signal). Marked zones are the bounce levels, first zone has been tapped already with bounce, now it is showing weakness in the zone, next zones are untapped, so a bounce at marked levels is highly likely, however if first zone breaks, I will look for swing short.
In short, marked zones are good for long, if broken, we can look for short at the bounce.

SOL 4 hr breakout coming 2 Patterns ConvergeLook at my busy chart, been keeping it all for the run...
But SOL on 4hr is ready to breakout. may be a retest to 198.5 but both a falling wedge pattern with the red arrow and the measured move from the W pattern both break north somewhat like the Lark lines in yellow, to 216 not much in the way to 230, may snap north
Stop loss below the base of the W
Download the chart if you want and look at the greater trend lines on the 3-5 day time frames

SOLUSDT 1DSOL ~ 1D Analysis
#SOL Re -testing this support and so far continues to maintain this support. Bullish again holds control as long as this support continues to be maintained. Minimum target of 15%++

SOL/USDT Bullish Breakout Loading ? Key Levels & Confluence SOL/USDT Technical Analysis
Price Action & Key Levels
Price is consolidating inside a descending channel, typically a bullish pattern if broken to the upside.
Key breakout level
$195–$196 aligned with Fib 0.382 and trendline resistance.
Critical support: $186 lower channel boundary.
First bullish confirmation
A close above $198 (1H 50 EMA + Fib 0.5).
Target levels
First target: $202–$203 (Fib 0.618).
Second target: $210+ (previous high).
Stop-loss placement : Below $186 to avoid fakeouts.
RSI Analysis
If RSI is currently below 50, it suggests weak momentum, meaning price could still consolidate before a breakout.
If RSI crosses above 55–60, it confirms bullish momentum supporting a breakout.
A hidden bullish divergence (higher low in RSI while price makes a lower low) would strengthen the case for upside movement.
Volume Analysis
Breakout needs strong volume confirmation. If price moves above $195 with low volume, it could be a fakeout.
If volume spikes on a breakout, it signals institutional participation, increasing the likelihood of a sustained move.
Decreasing volume inside the channel is a good sign this indicates sellers are getting exhausted before an upward breakout.

SOL BULLISH EXPECTED TRADESOLUSDT took previous high and did MS which is marked as X on the chart. Also market created imbalance which has been tested many times to trap the traders, Now I am expecting price to sweep that liquidity then go upside. I have also DCA plan marked.

Support and resistance zone: 202.68-211.77
Hello, traders.
If you "Follow", you can always get new information quickly.
Please click "Boost" as well.
Have a nice day today.
-------------------------------------
(SOLUSDT.P 1D chart)
Since it is a coin that has renewed its ATH, it may be natural for it to fall.
The key is whether it can receive support near the current support and resistance zone of 202.68-211.77.
-
This applies to coins where the gap between the HA-Low and HA-High indicators is unusually narrow.
Therefore, if it is supported and rises within the box range of the HA-Low indicator (173.33-218.71), it is expected to rise above the Fibonacci ratio point of 1.618 (297.94).
Otherwise, if it falls, it is expected to re-determine the trend by touching the M-Signal indicator on the 1M chart.
-
(SOLUSDT 1D chart)
I think it is also good to hold SOL coins as a long-term investment.
However, I think it is wise to increase the number of coins (tokens) held by increasing the number of coins (tokens) corresponding to profits, if possible, for all altcoins.
The reason is that the volatility is quite large.
I think the only way to stabilize your psychological state in this volatility is to increase the number of coins (tokens) corresponding to profits.
-
Thank you for reading to the end. I hope you have a successful transaction.
--------------------------------------------------
- Big picture
I used TradingView's INDEX chart to check the entire range of BTC.
(BTCUSD 12M chart)
Looking at the big picture, it seems to have been in an upward trend since 2015.
In other words, it is a pattern that maintains a 3-year upward trend and faces a 1-year downward trend.
Accordingly, the upward trend is expected to continue until 2025.
-
(LOG chart)
Looking at the LOG chart, you can see that the upward trend is decreasing.
Accordingly, the 46K-48K range is expected to be a very important support and resistance range from a long-term perspective.
Therefore, I expect that we will not see prices below 44K-48K in the future.
-
The Fibonacci ratio on the left is the Fibonacci ratio of the uptrend that started in 2015.
That is, the Fibonacci ratio of the first wave of the uptrend.
The Fibonacci ratio on the right is the Fibonacci ratio of the uptrend that started in 2019.
Therefore, this Fibonacci ratio is expected to be used until 2026.
-
No matter what anyone says, the chart has already been created and is already moving.
It is up to you how to view and respond to it.
Since there is no support or resistance point when the ATH is updated, the Fibonacci ratio can be appropriately utilized.
However, although the Fibonacci ratio is useful for chart analysis, it is ambiguous to use it as a support and resistance role.
The reason is that the user must directly select the important selection points required to create the Fibonacci.
Therefore, it can be useful for chart analysis because it is expressed differently depending on how the user specifies the selection point, but it can be seen as ambiguous for use in trading strategies.
1st: 44234.54
2nd: 61383.23
3rd: 89126.41
101875.70-106275.10 (when overshooting)
4th: 134018.28
151166.97-157451.83 (when overshooting)
5th: 178910.15
-----------------

#SOL/USDT #SOL
The price is moving in a descending channel on the 1-hour frame and is adhering to it well and is heading to break it strongly upwards and retest it
We have a bounce from the lower limit of the descending channel, this support is at a price of 187
We have a downtrend on the RSI indicator that is about to break and retest, which supports the rise
We have a trend to stabilize above the moving average 100
Entry price 203
First target 219
Second target 234
Third target 250

SOLUSDT Perpetual Swap Contract (30-Min Chart) - Analysis🔍 SOLUSDT Perpetual Swap Contract (30-Min Chart) - Analysis
📉 Trend Analysis
Current Trend: Bearish to Neutral
Price is recovering from the Demand Zone (228.21 USDT).
EMA 20 is crossing above price, acting as a short-term resistance.
Break of Structure (BOS) detected, indicating a shift in momentum.
Key Support & Resistance Levels
Major Resistance: 236.48 - 238.14 USDT (Fibonacci & EMA 100)
Key Support Levels:
Short-term: 228 - 232 USDT (Demand zone)
Major Support: 224 - 222 USDT (Lower demand zone)
🎯 Trading Strategy
1. Short-Term (Scalping / Intraday)
Long Entry: If price stays above 228 USDT, targeting 234.53 - 238 USDT.
Short Opportunity: If price fails at 238 USDT, a pullback to 232 - 229 USDT is likely.
2. Swing Trading
Long Setup: If price breaks above 238 USDT, next targets are 241 - 244 USDT.
Bearish Scenario: If price falls below 228 USDT, next support is at 224 USDT.
⚠️ Risk Analysis & Recommendations
✅ Stop-Loss Strategies:
Long Position SL: Below 224 USDT.
Short Position SL: Above 244 USDT.
✅ Risk Management:
EMA 100 & 200 act as dynamic resistance.
High volatility expected around 234 - 238 USDT.
✅ Final Thoughts:
Bullish Bias if price stays above 228 USDT.
If price fails to break 238 USDT, expect a rejection and possible retest of 229 USDT.
Manage risk carefully and monitor key levels!
📉 Conclusion: SOLUSDT is showing short-term recovery, but resistance at 238 USDT remains critical. A break above could lead to 244 USDT, while failure might trigger a drop to 228 - 224 USDT.
