SOLUSDT 2DSOL ~ 2D
#SOL the price got a pretty good reaction at this support block area.
This is also the Golden Fibonacci area.
Buy gradually on this support block,. with a minimum target of 20%++
SOLUSDTPERP

sol usdt long futures"🌟 Welcome to Golden Candle! 🌟
We're a team of 📈 passionate traders 📉 who love sharing our 🔍 technical analysis insights 🔎 with the TradingView community. 🌎
Our goal is to provide 💡 valuable perspectives 💡 on market trends and patterns, but 🚫 please note that our analyses are not intended as buy or sell recommendations. 🚫
Instead, they reflect our own 💭 personal attitudes and thoughts. 💭
Follow along and 📚 learn 📚 from our analyses! 📊💡"

$SOL - AnalysisCRYPTOCAP:SOL 4H
1. Harmonic Pattern:
- A potential harmonic pattern is observed, consisting of points X, A, B, C, and D.
- Point D is located at the 0.952 Fibonacci level, indicating the completion of the pattern, and there is an expectation of correction or reversal.
2. Order Block:
- An "Order Block" area is identified near the price peak (range of 156 to 160). This area could act as a strong resistance, with a likelihood of price reversal from this level.
3. Ascending Trendline:
- The price has reacted to an ascending trendline multiple times. This line can serve as strong support, and if broken, it could lead to further price declines.
4. Retest Area or Rise from Here?:
- Two potential scenarios are illustrated in the analysis:
- Bullish Scenario: After reaching the trendline, the price could pull back and move upward.
- Bearish Scenario: If the trendline support is lost, the price may decrease further and move toward lower areas (around 140).
5. Strong High Area:
- This area is marked as a very strong resistance above the price, which, if broken, could lead to significant upward movement, potentially reaching the range of 164 and above.

SOL pumping?🔼 Climb to $204.46: This level acts as a key resistance. A breakout above this confirms a bullish continuation.
🎯 Next Target at $364.43: After surpassing $204.46, the next profit target offers a 160% potential gain at $364.43.
🔴 Support Zone at $190: This level is currently holding as a strong support to prevent further downside.
⚠️ Downside Risk: Breaking below $190 could lead to a drop toward $138 or even $116.
✅ Buy Signal: If the price stabilizes above $204.46, it signals a bullish entry.
🚀 Profit Potential of 75%-160%: The chart suggests great upside opportunities if the upward trend continues.
📊 Summary: A breakout above $204 triggers a valid buy signal 🎉, but caution is needed if the price dips below $190 ⚡.

Where To Buy SOL MartyBoots here , I have been trading for 17 years and sharing my thoughts on SOL here.
SOL is looking very good here as it builds pressure before this next move up, very strong chart for more upside
Very similar to SUI which is up 30% + this week
Do not miss out on SOL as this is a great opportunity
Watch video for more details

Is Solana (SOL) Setting the Stage for a Historic All-Time High?Solana (SOL) Ignites a Bullish Fire: Is a New All-Time High Imminent?
Solana (SOL), a high-performance blockchain platform, has recently showcased remarkable bullish momentum, captivating the attention of both seasoned investors and crypto enthusiasts. With a significant portion of traders holding long positions, SOL appears poised to break out of its consolidation phase and potentially reach new all-time highs.
A Technical Analysis Deep Dive
A closer look at SOL's technical analysis reveals a compelling bullish narrative:
• Breaking the Bearish Trend: SOL has successfully broken out of a two-week descending trendline, signaling a shift in market sentiment. This bullish breakout has propelled the price towards its all-time high.
• Strong Demand Zone: The price's reaction to a previously identified demand zone has further fueled the bullish momentum. This indicates strong underlying buying pressure and a potential catalyst for further price appreciation.
• Key Resistance Level: The $251 level represents a crucial resistance zone. A successful breakout above this level could pave the way for a significant upside move, potentially towards the $300 or even $500 mark. However, a rejection at this level could lead to a temporary pullback or consolidation phase.
Why is SOL Attracting Bullish Sentiment?
Several factors are contributing to the bullish sentiment surrounding SOL:
• High Performance and Scalability: Solana's innovative proof-of-history consensus mechanism enables it to process a high volume of transactions at a low cost, making it a compelling choice for developers and users alike.
• Growing Ecosystem: The Solana ecosystem is rapidly expanding, with a growing number of decentralized applications (dApps) being built on the platform. This increased adoption and utility can drive demand for SOL tokens.
• Institutional Interest: Institutional investors are increasingly recognizing the potential of Solana and are allocating capital to the platform. This institutional interest can provide significant support to the price of SOL.
• Positive Market Sentiment: The overall bullish sentiment in the cryptocurrency market has also positively impacted SOL's price. As investor confidence grows, more capital is flowing into promising projects like Solana.
The Road Ahead for SOL
While the current bullish outlook for SOL is promising, it's important to remember that the cryptocurrency market is inherently volatile. Factors such as broader market trends, regulatory developments, and technological advancements can influence SOL's price.
Investors should conduct thorough research and consider their risk tolerance before investing in SOL or any other cryptocurrency. It's also advisable to diversify one's portfolio and avoid putting all eggs in one basket.
In conclusion, SOL's recent price action and strong technical indicators suggest a potential for significant upside. However, investors should remain cautious and monitor market developments closely. With a strong foundation, a growing ecosystem, and increasing institutional interest, SOL has the potential to continue its upward trajectory and deliver substantial returns to its holders.

Target between 950$ to 2397$ ! wow"The good days of altcoins have started recently, and the fourth most famous altcoin, Solana, has not been left out. Solana, which was once trading at $0.90, is now above $200. However, this is not the end, and based on the pattern it has formed and broken upwards, Solana's first target could be around $950, with higher targets reaching up to $2397. It could easily take Ethereum's place. Low fees and high transaction speed are some of the advantages of this cryptocurrency. Do you have it in your portfolio?"

SOLANA!! - Should you Short or Buy?Well as with my contrasting BTC analysis, Sol shal fall right? Made head and shoulders and also people will short from the orange line as said :/ naturally if btc falls they also fall and everything falls,
BuT
NO
Historically, i can be right depicting what can happen so will initiate buys from here as previous sma was sthrang (strong - made a uk accent) enough to catch it. CMP buys eyeing for 246 and 250, sl just 15 points

SOL road to 500+Solana can lead the alt coin market. Do not miss this one. Price discovery mode can lead to higher prices very quickly.
NOT A FINANCIAL ADVICE
ALWAYS USE STOPLOSS AND MANAGE YOUR RISK

SOL’s Dip = Your Opportunity?SOL/USDT has shown some bearish tendencies in recent days, but it’s essential to remember that markets can change rapidly, and this trend may not persist. The previous rallies may have seemed calm, but that doesn’t necessarily mean SOL will continue to move without surprises.
Currently, there are two potential demand zones to watch for SOL. Identifying these zones early is crucial, as they can serve as strong entry points for those looking to capitalize on future movements. Much like the analysis of XRP/USDT( XRPUSDT.P: Entry Zones ) shared earlier, focusing on these key levels is more meaningful than analyzing after the rallies have already played out. There's little value in hindsight if we can’t use it to plan ahead.
Let’s make the most of this opportunity and use these insights wisely. Remember, patience and preparation often yield the best results. Wishing everyone the best of luck and success in their trading journey!
I keep my charts clean and simple because I believe clarity leads to better decisions. Trading doesn’t have to be overly complicated, and I enjoy sharing setups that have worked well for me.
My approach is built on years of experience and a solid track record. I don’t claim to know it all, but I’m confident in my ability to spot high-probability setups. It’s all about learning and growing together as traders, and I’m here to share what I see.
The markets can confirm what the charts whisper if we’re paying attention. I hope these levels help you as much as they’ve helped me in the past. Let’s see how this plays out!
My Previous Hits
🐶 DOGEUSDT.P: Next Move
🎨 RENDERUSDT.P: Opportunity of the Month
💎 ETHUSDT.P: Where to Retrace
🟢 BNBUSDT.P: Potential Surge
📊 BTC Dominance: Reaction Zone
🌊 WAVESUSDT.P: Demand Zone Potential
🟣 UNIUSDT.P: Long-Term Trade
🔵 XRPUSDT.P: Entry Zones
🔗 LINKUSDT.P: Follow The River
📈 BTCUSDT.P: Two Key Demand Zones
🟩 POLUSDT: Bullish Momentum

Solana’s Next Big MoveSolana is at a crossroads, and the charts are starting to sizzle with potential. After consolidating within a tight range, SOLUSDT looks primed for a breakout that could send it soaring—or will it fake out and catch traders off guard? Here's what to watch:
Key Highlights:
🌟 Strong Support Zones: Solana has been holding critical support levels, signaling buyer strength and resilience.
📈 Breakout Watch: SOL is approaching key resistance levels—keep an eye on the volume for a confirmation of the move.
⚡ Momentum Building: Momentum indicators suggest buyers are quietly stepping in, waiting for the right moment to strike.
Solana’s ecosystem strength and recent technical setup could make this a high-reward opportunity for those ready to act. Don’t miss this chance to see if Solana becomes the star of the charts!
I don’t clutter my charts with a mess of indicators that look like a toddler went wild with crayons. Clean, simple, and effective—that’s my style. Don’t believe me? Check out my hits below. 🎯
When it comes to trading, I’m all about confidence backed by experience. I’m not claiming to be the best (yet), but my results do most of the talking. Keep an eye on these levels—sometimes the charts quietly suggest what the markets will shout later. Let’s see how this ride unfolds together! 🚀
My Previous Hits
🐶 DOGEUSDT.P | 4 Reward for 1 Risk (or more if you’re bold).
DOGEUSDT.P: Next Move
🎨 RENDERUSDT.P | HTF Sniper Precision
RENDERUSDT.P: Opportunity of the Month
💎 ETHUSDT.P | Buyer Zone So Accurate You’ll Double Check
ETHUSDT.P: Where to Retrace
🟢 BNBUSDT.P | Buyer Zone Mastery (CZ vibes).
BNBUSDT.P: Potential Surge
📊 Bitcoin Dominance | Called it Like a Pro
BTC Dominance: Reaction Zone
Now sit back, relax, and watch the market do its thing. Or don’t, FOMO is real. 😉

Most bullish asset on the planetGo and take a look at SOLBTC chart and tell me if you rather be in Solana or Bitcoin.
Sol is usable, something that ETH lost when it became expensive and elitist...

SOL - What To Expect NextMartyBoots here , I have been trading for 17 years and sharing my thoughts on SOL.
SOL is looking good still , into a huge level
Very similar to BTC which moved up hard from this level
Do not miss out on SOL as this is a great opportunity
Watch video for more details

#SOL The most noteworthy support zone📊#SOL The most noteworthy support zone❓
🧠From a structural perspective, we reached the weekly resistance zone and then fell back, which is very reasonable, and a 4h-level short structure was built near the resistance zone. The target area of this structure overlaps with the neckline support area, so this will be regarded as the heaviest support area (200-212). If the price can reach here, we intend to buy back the reduced spot positions again.
➡️ So, after such a decline was expected, we closed all the long orders held on the 17th yesterday. Congratulations to friends who followed the Wolf King to print money.
💕 Follow me so you don't miss out on any signals and analyze 💯 BITGET:SOLUSDT.P

SOL to mooooon 500$📌SOLANA signal:
Signal 1: Bullish Confirmation with Key Breakout 🚀
Solana has showcased a strong first pump followed by consolidation and another breakout at the second move. The chart suggests the potential for continuation to higher levels. A critical pullback entry zone lies between $235–$237, offering a safer opportunity for buyers to join the trend. Targeting $270 and beyond is now a bullish outlook! 🎯
Signal 2: Target Open Beyond $270 💰
The breakout above $270 could signal the next leg up toward the $500 target. Current price action suggests a healthy pullback structure, aligning with the big pump setup. Keep your stop-loss tight around $212–$222 to protect against market volatility. 📈✨
🔥 Plan your entries carefully and ride the wave toward $500! 🚀

#SOL/USDT Ready to take off upwards#SOL
The price is moving in a descending channel on the 1-hour frame and sticking to it well
We have a bounce from the lower limit of the descending channel, this support is at a price of 244
We have a downtrend, the RSI indicator is about to break, which supports the rise
We have a trend to stabilize above the moving average 100
Entry price 254
First target 261
Second target 269
Third target 278

SOLUSDT Bullish Flag PatternSOLUSDT Technical analysis update
SOLUSDT has been forming a bullish flag pattern over the last 230 days. The price is now moving toward the flag resistance line for a potential breakout. Once the breakout occurs, we can expect a price move of 50% to 150%. Additionally, the price is trading above the 100 and 200 EMA on the daily chart.
Buy level: After confirmation of the breakout from the flag pattern.

SOLUSDT: Bullish Momentum Building for a Potential All-Time HighSOLUSDT is demonstrating strong bullish potential after bouncing off a key support zone and breaking through a descending trendline. This breakout suggests a shift in momentum, indicating that we could see a significant upward movement in the near future. With the price gaining traction, traders should monitor the market for opportunities to enter positions as SOLUSDT approaches recent resistance levels.
To capitalize on this potential uptrend, consider placing entries on confirmed breakouts while managing risk with stop losses below the recent swing low. As bullish indicators align, the prospect of SOLUSDT reaching new all-time highs becomes increasingly likely. Stay vigilant, as this may be the beginning of an exciting phase for SOLUSDT traders!
SOLUSDT Currently trading at $146
Buy level: Above $146
Stop loss: Below $135
TP1: $152
TP2: $160
TP3: $175
TP4: $195
Max Leverage 3x
Follow Our Tradingview Account for More Technical Analysis Updates, | Like, Share and Comment Your thoughts

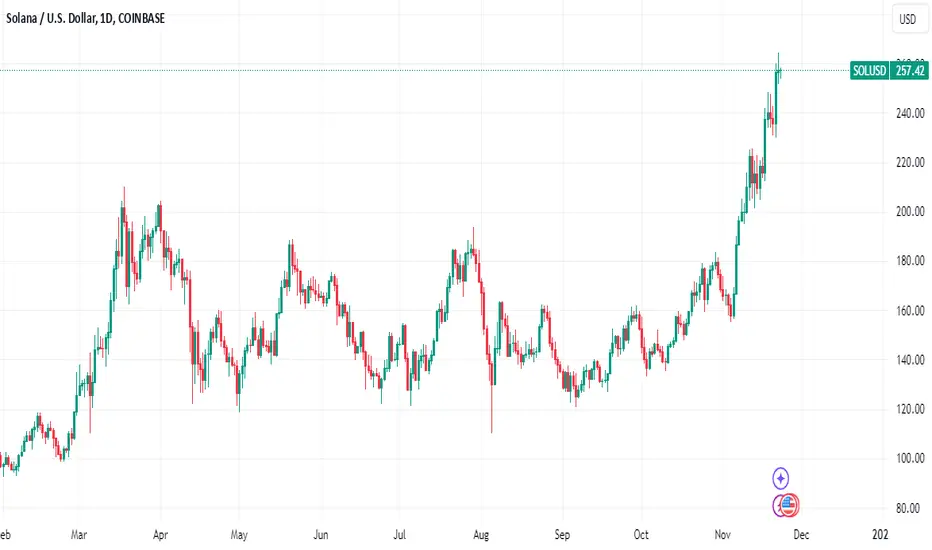
Understanding Solana: The Potential for Continued GrowthSolana's native cryptocurrency, SOL, has recently hit a new all-time high, sparking excitement and speculation among investors. This surge in price can be attributed to several factors, including the broader cryptocurrency market rally, increased institutional interest, and the growing popularity of Solana's blockchain network.
The Memecoin Mania Factor
One of the key drivers behind Solana's recent price surge has been the memecoin mania that has swept the cryptocurrency market. Solana has emerged as a popular platform for launching new memecoins, attracting significant trading volume and investor interest. The rapid growth of the memecoin ecosystem on Solana has led to increased demand for SOL, the network's native token.
Bitcoin's Influence
Bitcoin's recent price rally has also had a positive impact on Solana. As the dominant cryptocurrency, Bitcoin often sets the tone for the broader market. When Bitcoin's price rises, it tends to lift the prices of other cryptocurrencies, including Solana. This correlation between Bitcoin and Solana has contributed to SOL's recent upward momentum.
Increased Institutional Interest
Another factor driving Solana's price surge is the increasing interest from institutional investors. Many large financial institutions are now exploring opportunities in the cryptocurrency market, and Solana has emerged as a promising platform for building decentralized applications (dApps). Institutional investors' growing adoption of Solana could lead to further price appreciation in the long term.
Solana's Unique Value Proposition
Solana's unique value proposition, including its high throughput, low transaction fees, and fast block times, has attracted a significant developer community. The growing number of dApps being built on the Solana network has increased the demand for SOL, as it is used to pay transaction fees.
Potential Challenges and Risks
While Solana's future looks promising, it is important to acknowledge that the cryptocurrency market is highly volatile and subject to significant price swings. Several factors could potentially impact Solana's price, including regulatory uncertainty, network congestion, and competition from other blockchain platforms.
Additionally, the recent surge in Solana's price has raised concerns about the sustainability of its momentum. Some analysts believe that the current price levels may not be justified by the underlying fundamentals of the network. As such, investors should exercise caution and conduct thorough research before investing in Solana.
Conclusion
Solana's recent price surge has been impressive, but it is important to approach the future with a balanced perspective. While the long-term potential of Solana is significant, short-term price fluctuations are inevitable. Investors should focus on the underlying technology and the long-term growth prospects of the Solana ecosystem, rather than short-term price movements.
As Solana continues to attract developers, users, and institutional investors, it is likely to remain a major player in the cryptocurrency market. However, it is essential to manage risk and diversify investments to mitigate potential losses.
#SOL/USDT Ready to go up#SOL
The price is moving in a descending channel on the 1-hour frame and sticking to it well
We have a bounce from the lower limit of the descending channel, this support is at a price of 230
We have a downtrend, the RSI indicator is about to break, which supports the rise
We have a trend to stabilize above the moving average 100
Entry price 236
First target 242
Second target 248
Third target 254

What is next for SOL?Hello everyone,
CRYPTOCAP:SOL has been one of the best-performing altcoins up to today.
According to the chart, what can we expect for CRYPTOCAP:SOL in the coming weeks?
Firstly, CRYPTOCAP:SOL is forming two patterns: a double bottom and a descending triangle, with a potential target hitting the previous all-time high (ATH) at $260.
After breaking the ATH, you can hold your CRYPTOCAP:SOL until $457-$521, which could become the new ATH this bull market. However, in a bull market, it's unpredictable, so if CRYPTOCAP:SOL trades successfully above $521, it could potentially make a historical run towards $3800-$4366.
CRYPTOCAP:SOL is one of the altcoins that you should definitely keep in your wallet.
The resistances on the way after the ATH are:
$328
$393
$457
$521 as a final target
Feel free to ask about anything.
Have a nice day.

Sol Swing ShortStarting to scale into swing short position.
Entry DCA above 258.
Looking for 180 and 120 if deviated and rejected from range.
Invalidation breaking above 268.
Note: Not a Financial Advise.

Analyzing Solana's Bullish Surge: Is a $250 Rally on the Horizon
Solana (SOL), the high-performance blockchain platform, has recently embarked on a significant upward trajectory, surpassing the $220 resistance level. As the cryptocurrency market continues to exhibit bullish momentum, Solana's price action suggests a potential rally to the $250 mark.
Key Factors Driving Solana's Rise
Several key factors are contributing to Solana's bullish sentiment:
1. Enhanced Network Performance:
o Solana's robust network infrastructure, capable of processing thousands of transactions per second, has attracted developers and users alike.
o Recent upgrades and optimizations have further improved network performance, reducing transaction fees and latency.
2. Growing DeFi Ecosystem:
o Solana's DeFi ecosystem has witnessed substantial growth, with a diverse range of decentralized applications (dApps) emerging.
o Projects like Serum, Raydium, and Orca have gained significant traction, driving demand for SOL tokens.
3. Institutional Adoption:
o Institutional investors are increasingly recognizing the potential of Solana as a scalable and efficient blockchain platform.
o This growing institutional interest could lead to increased capital inflows and price appreciation.
4. Positive Market Sentiment:
o The broader cryptocurrency market has been experiencing a period of bullish sentiment, with Bitcoin and Ethereum leading the charge.
o This positive market sentiment has spilled over to altcoins like Solana, fueling its upward momentum.
Technical Analysis: A Bullish Outlook
From a technical perspective, Solana's price chart exhibits a bullish outlook:
• Breakout Above $220: The recent breakout above the $220 resistance level is a significant bullish signal, indicating a potential shift in market sentiment.
• Consolidation Phase: Solana's price is currently consolidating gains, which could be a precursor to a more substantial upward move.
• Target Price of $250: The next major resistance level for Solana lies at $250. A successful break above this level could trigger a further rally.
• Bullish Indicators: Technical indicators such as the Relative Strength Index (RSI) and Moving Average Convergence Divergence (MACD) are signaling1 bullish momentum.
Potential Risks and Challenges
While Solana's future looks promising, it's important to acknowledge potential risks and challenges:
• Network Congestion: As Solana's popularity grows, network congestion could become a concern, leading to increased transaction fees and slower processing times.
• Regulatory Uncertainty: Regulatory uncertainty surrounding cryptocurrencies could impact Solana's price and adoption.
• Market Volatility: The cryptocurrency market is inherently volatile, and sudden price swings can occur without warning.
Conclusion
Solana's strong fundamentals, growing ecosystem, and positive market sentiment have positioned it for a potential rally to $250 and beyond. However, investors should exercise caution and conduct thorough research before making investment decisions. As with any investment, it's crucial to diversify your portfolio and manage risk effectively.
Disclaimer: This article is for informational purposes only and should not be construed as financial advice. It's important to consult with a qualified financial advisor2 before making any investment decisions.
