SOS-did you buy too high -what to do next ? SOS
So let's talk technicals :
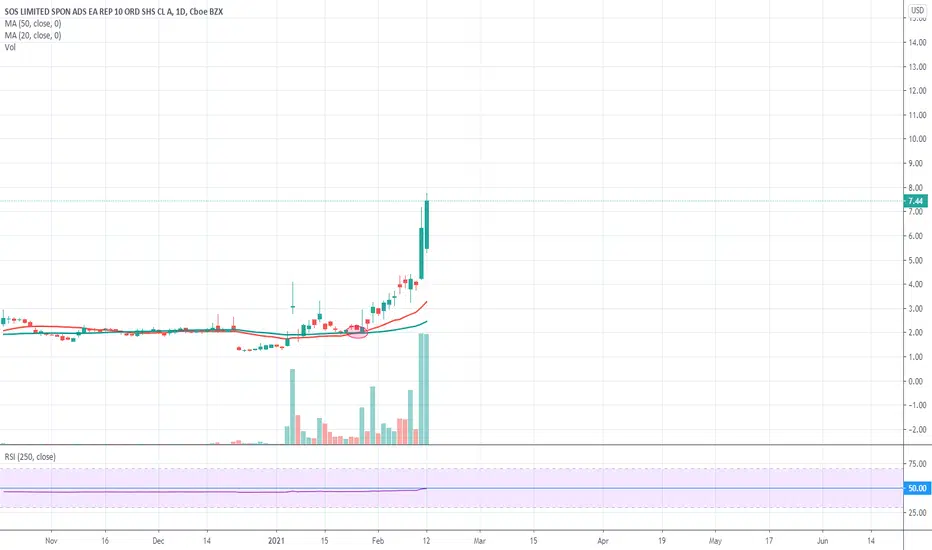
The stock shot up 263% (red trend line) in 6 days. It did it in 2 waves of impulse.
The stock got massively dumped on the 17th of Feb – this is a big drop in a 2-hour time frame with over 50% retraced. Not a good behavior of an asset with a catalyst on it as it looks like a pump and dump which is not the case but traders took it as a flip!
Correction on the drop of 50% up from 10.5$ to 13$ -then stock lost traction several dojis in a row.
Guess what comes after several dojis in a row – a drop😊 that’s usually the case if you have an igniting bar followed by Dojis.
The stock touched below 10 – notice 10.5 is a KEY number on this trade!
Volume of entry is bigger than the volume of exit meaning the cycle is completed and now we wait to see where the second cycle takes us (opening volume vs closing volume)
RSI showing more room on the downside on 1H meaning on a 4H we are on the mid of the RSI level
What's the play?
Simple :
If the stock crosses 10.5 below and hits 9 this could be a convergence level where the stock will slowly travel downwards…. We must watch out for 10.5 level and 9 levels!
on the Other hand, if the stock bounces off the 10.5 to the 11.5 line and CROSSES it – we are good to go to the previous high at 16$ and potentially get a new higher high.
Notice accumulation is needed above 11.5 so we may get a side trend on that level before we go to the 16$
Volume Analysis :
3-month average: 23.5M
1-month average volume: 48M
Volume that drove the first wave up 70M
Volume that drove the price down 60M (good means we still have a lot of traders in on this one)
Current volume: appx 10M -keep an eye if crosses 30M we may get another wave up
FDGT will wait to see whats the stocks next move and if we get 11.5$ + we may jump in
Please do your own DD on the stock and trade safe!
We expect a correction on BTC soon that may correlate with the stock
Trade safe and be safe
FDGT the traders union
SOS


SOS continueSOS as you know is a bitcoin and ethereum mining company so the price of those two assets will influence SOS a lot.
Tuesday ill be watching for a pullback to enter in to SOS and catch the next wave assuming BTC is still bullish

SOS: Bullish TrendWaiting for additional data...
- Golden cross confirmed.
- RSI moving upward.
Any input welcomed.
SOS! I've been in since 2 dollars!bullish pennate with an exaggerated bull div! lets fly to the moon!

HUT - Cup and Handle pattern on dailyThis canadian bitcoin miner has formed a nice cup and handle on the 4 hour and daily chart. I prefer handles that do not go past the 50% Fib retracement. Potential catalyst would be uplisting to Nasdaq exchange from OTC for US traders and the OTC symbol is HUMF. I like MARA RIOT and HUT here in bitcoin mining sector. HUT has $48 mill net cash , while Mara and Riot have less net cash. HUT uses natural gas and Wind farms for energy, so a little cheaper production cost compared to MARA and RIOT. HUT has 3000 BTC inventory, MARA 4812 and RIOT 1053. *I live 2 hours away from their mining facility. Go Bitcoin! :)

Long Playlook and the news what this company is doing. Mining BTC and ETH using hydropower and expected to make 250K a day once operation is running in a few weeks. Look at MARA and Riot both were this cheap months ago. don't miss this train. Had a offering today that was NOT PUBLIC do not be fooled. Volume picking up very good. options moving around quite a bit today as well. #SO Disclaimer: This is not investment advice just my opinion


LTC Change in MSLTC long time going down, moving sideways and starting to change in market structure.
see 2 wicks to the left and then finally big bearish engulfing that pushed through, looking for;
A bullish engulfing to push through
2 closes above the EQ line
Limit Entry and SL set.

ETHM20 Bitmex RetracementConsolidation then drop to previous resitance.
Fibs from High to Low
Looking for entry on the previous supports for a short

Eos hitting triple bottom good for a long....little bit riskyEos hitting low on the daily, lots of support at this area I'm seeing a big long position, my stop loss is a bit tight.....
Lets see what happens???

BCDBTC
BCDBTC
Still in an overall bullish downtrend.
4hr consolidation zone, forming a squeeze in a bullish formation descending triangle.

BATBTC 4 out of 10 daily morning chartsBATBTC
Still in an overall bullish downtrend.
4hr consolidation zone, historically after LH forms these zones with a fast bullish movement off the bottom to be rejecter on another LH and fast bearish movement down to create a Lower low.
in the middle of zone ATM.
possible long from the bottom and short from the top.
both stop-loss are clear of previous market structure.

ATOMBTC 3 out of 10 daily morning chartsATOMBTC
still in an overall bearish downtrend. At the moment in a 4hour sideways consolidation period.
historically box consolidations have entry - 2 top touches and big bearish movement.
the missed ideal entry into short, Darvas box entry could play out and a stair down.
Low 4hr volume, MACD looks to flip bearish, histogram looking thin, BB narrowing, RSI midway with now divergence.

ALGOBTC 2 out of 10 daily chartsalgo in a sideways consolidation period.
midway in zone, possible 4% trade to the swing high failure if 1hr trend line is respecter.
SL tight under trend.

ADA MORNING 1 OUT OF 10 CHARTS PER DAY.ADA in an upwards bullish channel.
MACD + histogram cross, wait for a retest of the trend to get the best entry and long to top of ascending triangle within the channel.


THETABTC - potential long opportunityLong opportunity has presented itself with THETABTC
Been on a uptrend forming higher highs.
Recently broken out of the downwards wedge, and looking to retest the trendline
Could be 8 - 9% trade. Looking at some of the wicks to the left I will leave the last 25% of my trade as a trailing take profit, so see if I can catch it if it does wick up

XBTUSD short term bearishDISCLAIMER: This is TA from a beginner learning to trade. I take all trades I publish unless otherwise stated. However, I use very small position sizes for the purposes of learning. Follow my journey as I cut my teeth in trading.
I have noticed throughout btc's short term consolidation, it has been following fib levels relatively well. I have no long bias even though it has broken a downtrend. On higher timeframes, until it creates HH (higher than 7450), we are consolidating. Price has wicked up but failed to cut through supply zone at the 7230-7300 region.
I am betting on a short down to 61.8 which has also acted as support.

USD/CHF Potential ShortUSD/CHF has hit a strong resistance which intersects with the current downtrend. I am looking for a short position here with a tight stop loss


BCH/BTC Double Bottom on the 1 hr and break in downtrendDouble Bottom on the 1 hr and break in downtrend, potential long opportunity
