Broadcom Middle of Range RisksI like Broadcom if it gets down to $178. Right now it's still floating from the AAPL news. I wouldn't be inclined to sell here, but if looking to buy (like myself) I'd wait in hopes for $178.
Target (Potential Next Support) $302.
Good luck!
SOX

Nvidia Just Under Major SupportNvidia seems to have been pulled down by the Dow just like Apple as both are just under major support. I'm sorry for my previous Nvidia chart that drew support near 140, I recognize where I screwed up, but this chart should be good. Fortunately actual 117 support wasn't that far below and my NVDA isn't too in the red.
NVDA has the lowest revenue multiple in years right now. I know it's well off it's long term trend line, but it's growth rate is unlike anything it's ever been so expecting a steeper trend line to appear makes a lot of sense. Eventually I would imagine we'll get back to that trend line, but not anytime soon.
The Dow hitting major support should finally lift NVDA and the others that have been dragged down like AAPL and AMZN.
Good luck!

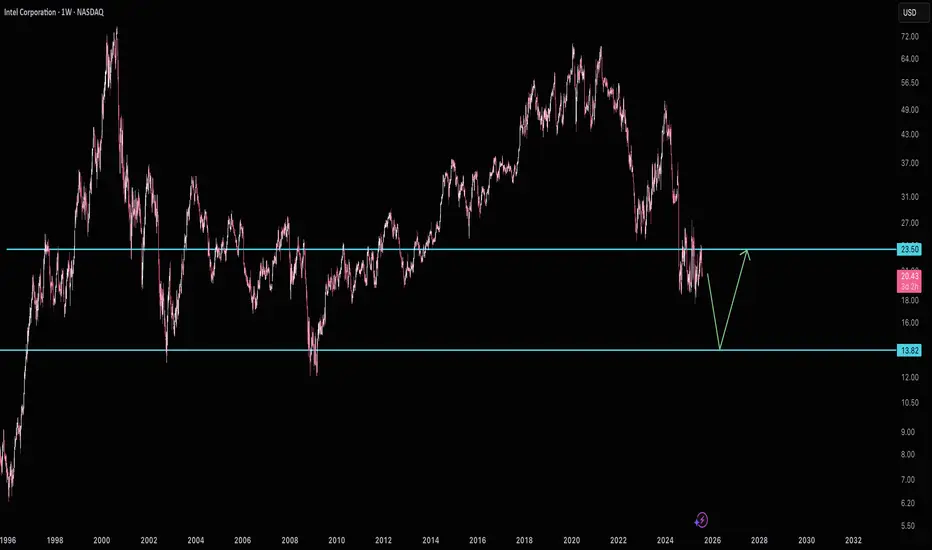
Intel looks to want $13Intel looks to be waiting below $24 resistance for $13 support. I wouldn't short it at it's current price, but I would be patient and wait for $13 if you're looking to buy. Good luck!
CHIP SECTOR TO CRASH SMH The chart posted is the SMH we are now in the final 5th wave and it is a classic 5th wave Diagonal in the 5th wave wave to form a double top into fib cycle peak .From here we should see a major break down in All chip stocks into Oct 2025 but we should see the first leg down low march 10/20th 2025 this should be a Very Bearish action world wide see spy and qqq as well . This is the warning to All traders EXIT INTO RALLIES THE BEST OF TRADES WAVETIMER

$SOXL $SOXX BOTTOMED (ASCENDING TRIANGLE)An ascending triangle is a bullish breakout pattern that occurs when the price breaks through the upper horizontal trendline with increasing volume. The upper trendline is horizontal, showing nearly identical highs that create a resistance level. Meanwhile, the lower trendline slopes upward, indicating higher lows as buyers gradually increase their bids. Eventually, buyers become impatient and push the price above the resistance level, triggering further buying and resuming the uptrend. The upper trendline, which previously acted as resistance, then becomes a support level.
Semiconductors NASDAQ:SOXX are crucial to the United States for several reasons:
Technological Backbone: Semiconductors power essential technologies like smartphones, computers, cars, and medical devices. They are integral to almost everything with an on/off switch. The semiconductor industry aka NASDAQ:SOXX significantly contributes to the U.S. economy. It supports millions of jobs and drives innovation in various sectors, including artificial intelligence, biotechnology, and clean energy.
Semiconductors are vital for national security. They are used in military systems, aircraft, weapons, and the electric grid, making them critical for defense and infrastructure. Maintaining a strong semiconductor industry helps the U.S. stay competitive globally so BUY AMEX:SOXL , $SOXX. The CHIPS and Science Act, for example, aims to revitalize the U.S. semiconductor industry, create jobs, and support American innovation. Strengthening the domestic semiconductor supply chain reduces dependency on foreign sources, enhancing the resilience and security of supply chains.
BUY NOW AND HOLD

Semiconductors Market Cap vs Equal weightAs NVDIA and Broadcom expand their domination in Semiconductor sector the Market Cap weighted Index is making an ATH against equal weighted index.

Philadelphia Semiconductor Index (log)Hello community,
A quick update on the Sox in weekly, in log.
We are at the top of both channels, the medium term and the short term.
It would be desirable that it does not go too far out of the regression channel.
In any case, the trend has been bullish since 1995, and will be for many years to come.
Make your own opinion, before placing an order.
► Thank you for boosting, commenting, subscribing!

SOX INDEX WAVE B LOW SOON The chart posted is the Sox index We should find support 4588 to 4496 for wave B low and then see a final wave C up before we the BIG decline . As long as we hold 4480

7/11/2024 Three major turns focus three spiralsJuly 11 is the same date as Trump Sentencing date The spirals are ALL from peaks . I would tend to think This is a date we will see real issue at each one of these dates the markets began declines . Even thought I will be moving back into march 2025 puts rather soon if we are in any rally into this date I will most likely be 100% long PUTS

$INTC has its biggest run in a long timeNASDAQ:INTC has hit the 1st level.
We are being strategic and locking in some gains. We are over 10% profit mark in a few days & Intel is above the gap fill area, which was the 1st tranche of selling.
Still have a good sized position and wrote covered calls on 1/4 of the position.
NASDAQ:SMH NASDAQ:SOX

Semiconductor Bull Run: more steam ahead, but take cautionSome industries are notoriously cyclical. Semiconductor is a prime example. It swings to the extreme on both bullish and bearish sides. While the industry is in a bull run, investors can still participate in its rise but with caution.
The PHLX Semiconductor Index (“SOX”) is a modified market-cap weighted index. It is composed of semiconductor firms involved in the design, production, and distribution.
This paper dives into the factor’s driving SOX performance. It expounds on the cyclical nature of the industry, and its outlook fuelled by AI frenzy.
Finally, this note posits a hypothetical spread trade to gain from index outperformance relative to the broader market. The spread has been found to be more resilient that an outright position in SOX ETF or futures.
UBIQUITOUS AI
AI here. AI there. AI everywhere. AI by far is the single most driver of SOX outperformance. VANTAGE:NVIDIA , the AI darling commands ~10% of the SOX. Other AI majors include Broadcom (9.3% weight) and chip equipment maker ASML (4.5% weight).
The strongest profit harvester of AI boost is Nvidia. Expectedly, it has strongly outperformed SOX. AI-driven demand is evident in its financials. In 2023, its revenues rose by 125% YoY while Net income spiked by a jaw-dropping 580%.
Consistent earnings beat-and-raise has propelled its stock prices to more than 500% gain since the start of 2023. Outsized impact of Nvidia’s earnings is from AI data centre sales.
AI NOW, AND MORE IN THE FUTURE.
Nvidia is clearly benefiting in the near-term. Other majors are ramping up their AI offerings. Notable among them are NASDAQ:AMD (9.8% weight in SOX), VANTAGE:INTEL (6.75%), and $Qualcomm (7.5%).
These firms are yet to witness a major AI driven boost. 2023 data centre revenue for these firms remained underwhelming relative to AI winners such as Nvidia and Broadcom.
Broadcom’s AI driven demand for its networking solutions led to revenue of USD 2.3 billion in Q1 2024 which represents a four-fold increase YoY, reported MarketWatch. For 2024, they forecast AI-driven sales to reach USD 10 billion.
Data Source: TradingView
Meanwhile, Intel, AMD, and Qualcomm are in the process of launching their own AI offerings.
Qualcomm’s updated Snapdragon X Elite chips runs on ARM architecture. These offer enhanced AI capabilities, energy efficiency & performance compared to current platforms from Intel and AMD.
AMD updated its guidance for AI graphics offerings to USD 3.5 billion this year (v/s two billion previously). Although, below expectations, the raised outlook signals that sales ramp up is yet to materialize.
Intel is planning to launch AI PCs. Uniquely, in such PCs, AI inference will be localized on the user’s machines rather than on the cloud. Like Qualcomm, Intel’s AI PCs may revive its faltering PC sales.
NEXT TO AI, REBOUND IN MOBILE PHONE SALES IS HELPING THE INDUSTRY
Beyond AI driven demand, rebound in smartphone sales highlighted by Counterpoint Research has helped change the fortunes of this industry. Final quarter of last year marked the first quarter of annual growth after 7 straight quarters of declining sales volume as per their report .
Smartphone sales rebound benefits not just mobile chip makers like Qualcomm but also manufacturing service providers like TSMC.
SEMICONDUCTOR INDUSTRY IS NOTORIOUSLY CYCLICAL. FORTUNATELY, BULL CYCLE FOR NOW.
Semiconductor industry is prone to cyclicality. It is impacted by idiosyncratic consumption patterns. As a result, industry runs into large inventory buildups resulting in gluts for outdated products and shortages for new ones. Due to the rapid innovation rate, production sizing is hard. Even harder is for manufacturing output to adjust to shifting demand dynamics.
Cyclicality is on over-drive these few years. Pandemic disrupted chip production while demand remained robust. Subsequent shortage impacted not just semiconductor firms but also various other industries reliant on chips.
Manufacturers ramped up production to meet high demand. Soaring inflation drove central banks to raise interest rates. This caused consumer spending, especially on discretionary electronic items to nose-dive. This dynamic rapidly drove chip inventories from a severe shortage to demand crushing glut. What followed was painful mark-downs and profit crushing unit sale declines.
Cyclicality is ingrained in this industry due to its consumption, innovation, and growth cycles. As an example, consider VANTAGE:INTEL ’s revenue and profit. VANTAGE:INTEL derives majority of its revenue (54% in 2023) from its Client Computing division comprising of consumer-focused processors.
The impact of seasonality is also palpable in the net income of memory manufacturer $Micron.
HYPOTHETICAL TRADE SETUP
Robust financial performance is evident for some stocks within SOX. Other names within SOX are yet to reap the harvest of top-line and bottom-line growth from AI.
Notwithstanding, SOX continues to rise. It is up +100% relative to the start of 2023 when AI-driven hype came to the fore. Over exuberance and risks of a bubble are clear. A macro slowdown or industry-specific setback could drive a sharp reversal in SOX.
Instead of an outright position in SOX ETF or Futures, spreads between SOX and other equity indices shows that SOX/S&P 500 spread makes for a compelling hypothetical trade setup.
SOX/S&P 500 spread offers improved upside relative to SOX/Nasdaq-100 and SOX/XLK spread. It also offers resilient performance during sharp corrections (August to November 2023).
The SOX/S&P 500 spread is 36% higher since the start of 2023 and close to its highest level seen during 1995 and 2000. For reference, the SOX index is up 80% from 2023 and soaring far above previous all-time-highs. This implies that much of the recent run-up in SOX has come alongside a broader rally in the S&P 500. SOX outperformance is likely to continue while SOX tailwinds remain intact.
A hypothetical spread trade comprising of two lots of long CME E-Mini PHLX Semiconductor Sector Futures (“SOX Futures”) and short one lot of CME E-Mini S&P 500 Futures can offer a reward to risk ratio of 1.5x. Two contracts of SOX Futures are required to match the notional for one contract of E-Mini S&P 500 futures.
• Entry: 0.927
• Target: 0.97275
• Stop Loss: 0.897
• Profit at Target: USD 11,783 (+4.9%)
• Loss at Stop: - USD 7,893 (-3.3%)
• Reward to Risk: 1.5x
MARKET DATA
CME Real-time Market Data helps identify trading set-ups and express market views better. If you have futures in your trading portfolio, you can check out on CME Group data plans available that suit your trading needs www.tradingview.com
DISCLAIMER
This case study is for educational purposes only and does not constitute investment recommendations or advice. Nor are they used to promote any specific products, or services.
Trading or investment ideas cited here are for illustration only, as an integral part of a case study to demonstrate the fundamental concepts in risk management or trading under the market scenarios being discussed. Please read the FULL DISCLAIMER the link to which is provided in our profile description.

Semiconductor Pullback Imminent?The semiconductor index has been one of the best performing areas of the market over the last few quaters, and has continued to be strong since the late October bottom.
The index is coming into overhead fibonacci resistance, and with weakening momentum starting to show up, similar to July last year, a pullback here looks likely.
It seems hard to imagine with all of the AI lead optimism, but this sector could see some retrace back to the 3100s to reset sentiment.
If the indicated resistance region is broken, the next likely targets are substantially higher.
Will be monitoring for a reversal pattern to emerge and confirm the time has come to exit longs and consider a short trade.

SOX and CHIPS TOPPED TODAYhead n shoulders target has been seen the pattern in the sox and amd have reached the projection

SOX dowside MIN targets wave structure formation iThe bullmarket in Sox has reached the 5 th wave TOP as model gave me a new high from oct 2022 as it dropped in clear e wave to perfect fib relationship .50 .618 and 1.618 right at the lows I see this Bull phase Completed see charts 2000 rally phase

SMH ELLIOT WAVE STRUCTURE WAVE 5 of 3 ended165.5The chart posted can now be posted and the ew labeling we have now ended or will end wave 5 of 5 of wave 3 top and begin a sharp drop in thr sox and smh back down for a week or more in wave 4 of 5 of 5 then The last wave up will end the rally from oct 13 th 2022 in super cycle degree and we will then see a drop back to .382 to 50 % from 2009 once more in wave A of the super cycle bear POINT for reference see 1998 to 2000 Internet BUBBLE A.I Bubble

SOX : Trendline to watch!!!!Trendline to watch!!!!
Indeed, the “SOX” semiconductor index, known as a leading indicator, seems to be showing signs of weakness. Although it has returned to its uptrend line, we can still be wary of Wolfe waves which indicate a possible breakout. Not to mention that major components like “Intel” or “Nvidia” are either very high and overvalued (Nvidia), or have experienced a fairly phenomenal series of consecutive increases (Intel). Breaking the uptrend could be a negative signal for technology and especially for the market as a whole.

spy .382 bottom a zig zag in abc donethe chart posted is the spy we dropped in an abc decline into the sept 21/23 panic cycle it has the world so trapped in PUTS see 20 and 10 and 30 p/c I am 100 % LONG 4731

SOX: $250 probably the leading Signal to Emerging Semiconlooks like this has a couple of months head start of how other issues are played out

SPY Update (weekly chart)Quite a bull run, last week we hit the Point & figure (P&F) target of 443 set long ago.
The current run appears over-extended, being at the top of the channel set from the October 2022 low to present. Also, the RSI(9) on daily and RSI(12) on weekly (neither shown here) are overbought. The B to C run at 1.68 % extension also is showing some excess over the theoretical Gartley 1.618 move. Also, SOX and SMH are showing some signs of rolling over.
After touching the 443 P&F target, the week fell back and closed out at 439.46, below the APEX of the volume profile (red arrow on the right). Potential resistance.
I am liking the prospects of a pullback next week from C to D to 412.26, or around the 50% retrace line (drawn from 2022 high to low) at 414.04. That would be about 6% pullback.
Of course, the bull run could continue next week, at which point I would expect an intermediate top out at 454.05, or prior swing high. Given paragraphs 2 and 3 above, I don't expect this next week.
Are we in a new bull market? We are getting there, but I remain cautious.

QCOM LongJust a decent risk/reward trade here on QCOM. Good company that will be around for a long time. I'm going to give it a shot.

Is the bullish run on tech stocks done? check out QCOMAfter taking out the October and November lows, QCOM has surged to activate a Fake Break Down reversal pattern, as well as an odd looking island reversal pattern, leaving behind almost the entire month of May's trading days. It might need a breather here as it runs into some short term resistance, but I'm long.... 🤷♂️

SMH Weekly Update (post split)I'm updating my prior SMH weekly chart, since we had a 2 for 1 split in SMH last week and it totally messed my chart up.
Key points (dates are all weekly):
3/27: 131.79 (most recent peak)
4/24: 118.57 ( most recent low) -10.03% off the peak
5/1 close: 124.38 -5.6% off the peak
Gann confluence line 1: 121.71 -7.6% off peak
Gann confluence line 2: 114.46 -13.1% off peak
The green trend lines indicate an apex forming right along the Gann rays (salmon colored lines) suggesting a directional resolution is near.
After extending to the purple point D, which is almost a 1.218 Gartley extension, support appears to be holding at the 121.71 Gann Confluence support line. This line is also the top ridge of the Ichimoku cloud which can also serve as support. Should SMH rise off this support, then we would have had a 7.6% correction off the most recent high.
Should current support break down, we would see a target of Gann support 2 which is 114.46, or 13.1% off most recent peak.
Pros for upside breakout: A possible rate cut currently being predicted by SOFR futures as early as June or July. Banking turmoil could also call for a pause or cut. A reduction in rates would also signal easier monetary conditions which would benefit growth oriented stocks for a near term spike.
Pros for a breakdown: Further hawkishness in the FED, combined with Bank Solvency fears. Seasonality: from 2004 to 2023 the SMH has finished the month of June higher only 42% of the time, the worst month in the year.
Observation: The 12 month RSI, while positive at 57.16, is declining from a near term double top, and showing some weakness in trend. I would watch for continuing weakness in SMH momentum on the daily chart, as well as the breadth inside the SMH holdings. You can do this with flipcharts on the Barchart.com site. Presently, while I see a few stalwarts, I am also seeing a lot of breakdowns inside the SMH ETF. For example, MCHP, a very well run company with solid financials, just reported good earnings beats, yet it sank below its 200 day MA and has a weak daily RSI(9) of 42.11. Personally, I would not long any semiconductors until late summer and signs of turmoil have resolved.

SMH Semiconductors update (weekly) Key areas to watch Semiconductors finally showing some topping pattern, amidst topping RSI (12) that failed to reach the high 70 channel and a shrinking trend of volume. In effect, weakening momentum.
The first level is 244.71, which is a Gann confluence and also a prior pivot (left yellow circle), and is a 7.1% decline off the most recent peak of 263.57. This would take it to the top of the red cloud which could serve as some support.
The second level to watch is 229.18 (right yellow circle) , which is another Gann Confluence, and also a prior pivot, which would be 13.04% off the peak of 263.57. This would take SMH well into the cloud, which could create some future resistance.
Seasonality is at play, so I would expect a rebound in late summer, although there are many factors which could disrupt any projections any farther out and I do not feel worth making now.
