TLT 4 TH WAVE TRIANGLE ENDING DOWNSIDE 85Iam posting the chart as a new Warning to All traders I see this as nearing it s end . I will state if this wave structure turns down from the time window we are entering into my panic cycle May panic and panic low june 16 to the 23 th 2023 is the next spiral as stated jan 20th 2023 forecast . the Importance of the march 13 /23 spirals back to june 13th 1949 plus the other 3 spirals are a cluster at each cluster of spirals events have occurred MARCH 13 2023 AUGUST 16TH 2022 OCT 13TH 2022 SEPT 6TH 2021 AND MY MARCH 18TH TO THE 21 ST 2020 . .BEST OF TRADES WAVETIMER !!!
SOX

AMD is approaching resistance (daily chart)AMD, like many semis, has been on a rip lately. However, it appears to be in a resistance zone at a Gann confluence line at 100.13 (like SMH and many other semis), which is also where it turned back earlier. The RSI(9) is overbought. I would see it going back to prior Gann line at 91.23. That line is also near the top of a bullish Ichimoku cloud. Perhaps a buy there, but I would be cautious about buying semis after April, since we may be entering some seasonality.

When Chips Are Down, They Rebound Slowly But StronglyWhen Chips are down; invest if you can and hedge if you must. Having soared in 2020 & 2021, semiconductor shares tanked brutally as tremors from geopolitics, sinking consumer confidence and bloated inventory struck.
Q4 overhang is dragging the industry down in the near term, which might have set a bearish outlook in the short-term, but times are changing. Structural forces and business cyclicality are now becoming robust tail winds for semiconductors, bringing a bullish outlook in the medium-to-long term for the sector.
Therefore, this case study argues that an asynchronous time spread in CME E-Mini PHLX Semiconductor Sector Futures ("CME Semiconductor Futures") could potentially deliver a 2.8x reward to risk ratio by first taking a short position in futures expiring in March 2023 followed by a path-dependant long position in futures expiring in September 2023.
INDUSTRY ON THE CUSP OF A SUPERCYCLE
Chips everywhere. Semiconductors are ubiquitous as products become sophisticated. Rapid growth of mobile devices, emergence of EVs, and rising cloud adoption have created endless demand for higher processing speeds and larger memory. Chipmakers have benefited from this trend.
Anticipated exponential growth in consumer durables, IoT, gaming, EVs, and AI/ML will translate into strong sustained demand for chips. Speaking at World Economic Forum, Microsoft CEO Satya Nadella asserted that AI would go mainstream not in years but in months.
Emergence of generative AI will form a fresh stream of demand for chips. EVs require twice as much chip content than traditional ones. Rising cloud usage will amplify demand from datacentres for graphics processing units (GPUs). In short, semiconductor industry is on the cusp of a demand super cycle.
DEMYSTIFYING THE SEMICONDUCTOR INDEX
The Philadelphia Semiconductor Index ("SOX") is a market capitalization-weighted index comprising of the top thirty (30) semiconductor firms listed in the US. Top names include Nvidia, TSMC, and ASML forming 48% of SOX. The top ten comprise 80% of the SOX.
SOX rallied 202% from its low in March 2020 to its high in November 2021. As monetary policy shifted from QE to QT, SOX plunged 46% in 2022 touching its lowest level in October 2022. Since then, it has bounced back 43%, outperforming both NASDAQ-100 and S&P 500 which are up merely 10% during the same period.
A CYCLICAL INDUSTRY
Semiconductors industry is inherently cyclical given the considerable time lapse between spotting fresh demand and matching them with new supply.
In a recent report, JP Morgan cited that semiconductor stocks are close to a cyclical bottom. Each time the industry hits a bottom, it recovers impressively. In one-year and three-years following a cyclical dip, shares in this sector spike 40% and 95% on average, respectively.
While short term demand looks bleak on waning consumer confidence, the USD 600-billion industry's long-term prospect looks resolutely bright.
LET THE AI WARS BEGIN
Revolutionary AI: ChatGPT made its debut in November. It sprinted to a million users in just five days. The excitement in generative AI is palpable. It will revolutionise content generation while delivering vast productivity gains in others.
Inflection ahead: AI is approaching an inflection point. Its usage is going mainstream. Expect tech giants to invest heavily to outcompete. If this marks the start of AI wars, the semiconductor firms that make AI work will harvest outsized profits.
Shovel makers hit jackpot: During the gold rush, it was the shovel makers that got rich more so than the diggers. In this AI gold rush, the shovel makers (i.e., the semiconductor stocks) are set to reap enormous gains.
Nvidia already shining: Nvidia is the market leader in GPUs whose parallel processing capabilities form the core for delivering AI. ChatGPT adoption alone could bring incremental revenues of up to USD 11 billion over the next year, Citigroup estimates.
TSMC & ASML well positioned: Nvidia GPU production depends on two firms - (a) the Taiwan Semiconductor Manufacturing Corporation (TSMC), and (b) ASML Holdings (ASML).
Berkshire stake in TSMC: TSMC recently announced stunning Q4 earnings. Its net sales grew 42.8% YoY, while its net profits & EPS were up 78% YoY contributing to an ROE of 26.4%. Little wonder that TSMC was one of Warren Buffett's recent investments where his firm acquired USD four billion of TSMC shares last November.
ASML dominance: Meanwhile ASML commands a monopoly on key tech (Extreme Ultraviolet Lithography or EUV). EUV is used in producing cutting-edge nano chips that AI requires. ASML is set to secure a windfall on rising AI adoption.
CHIPS ACT TO RESHORE PRODUCTION
Supply chain disruptions caused by the pandemic exposed the vulnerability of over-reliance on globalisation. Russia-Ukraine conflict caused adverse impact with Russia being a major supplier of Palladium and Ukraine being a key source of Neon gas.
To reduce over-reliance in a key industry, US last year legislated the CHIPS Act which is aimed at reshoring production on US soil supported by more than USD 150 billion of grants and tax incentives.
NO PAIN, NO GAIN IN A V-SHAPED PATH AHEAD
Supply ramped-up but a little too late: Clogged supply chains plus demand spike during the pandemic fuelled chip shortage. Ramped up production which always takes a long lead time arrived but at a time of pale consumer demand (PC demand down 28% YoY) late last year.
Frail consumer sentiment: Persistent inflation, recession fears, and uncertain outlook, meant lower consumer durable sales. This has slashed demand for semiconductors resulting in one of the largest inventory corrections in the industry. The sector is cooling faster and getting colder than expected. Firms face a tough market saddled with excess inventory compounded by frail end-markets except for automotives.
Downgraded chips: Intel reported a loss for Q4 last year and expects a weak first half this year with return to growth in second half. Earnings from other industry majors point to significant headwinds. Analysts have downgraded several chip stocks.
Fund flows in ETFs: Fund flows into and out of leveraged ETFs this year show investor activity is moving in tandem with these macro shifts. The Direxion Daily Semiconductor Bull 3x ETF (3 times long exposure to SOX) suffered net outflows of $341 million while the Direxion Daily Semiconductor Bear 3x ETF (3 times short exposure to SOX) gained net inflows of $1.1 billion.
Insiders are Net Sellers: Insider Activity among majors show that they have been net sellers over the last three months except for Qualcomm, Intel and Applied Materials.
Bullish Price Targets: In sharp contrast to this gloomy outlook, analysts covering the top stocks anticipate an average +15% price gain over the next 12-months.
TRADE SET-UP
This case study proposes a two-legged calendar spread as set out below.
Each CME Semiconductor Futures contract provides exposure to twenty-five (25) index points approximating to USD 75,000 in notional with required margin of USD 5,900.
TRADE LEG 1 : A short position in the contract expiring in March 2023 will provide exposure to the short-term correction.
Entry: 2978
Target: 2571
Stop Loss: 3180
Profit At Target: $10,175
Loss At Stop: $5,050
TRADE LEG 2 :
A long position in CME Semiconductor Futures expiring in September 2023 will provide exposure to recovery in the latter part of the year.
Entry: 2710
Target: 3718
Stop Loss: 2410
Profit At Target: $25,200
Loss At Stop: $7,500
Aggregate Reward-Risk Ratio: 2.8x
MARKET DATA
CME Real-time Market Data helps identify trading set-ups and express market views better. If you have futures in your trading portfolio, you can check out on CME Group data plans available that suit your trading needs www.tradingview.com
DISCLAIMER
Trade ideas cited above are for illustration only, as an integral part of a case study to demonstrate the fundamental concepts in risk management under the market scenarios being discussed. They shall not be construed as investment recommendations or advice. Nor are they used to promote any specific products, or services.
This material has been published for general education and circulation only. It does not offer or solicit to buy or sell and does not address specific investment or risk management objectives, financial situation, or needs of any person.
Advice should be sought from a financial advisor regarding the suitability of any investment or risk management product before investing or adopting any investment or hedging strategies. Past performance is not indicative of future performance.
All examples used in this workshop are hypothetical and are used for explanation purposes only. Contents in this material is not investment advice and/or may or may not be the results of actual market experience.
Mint Finance does not endorse or shall not be liable for the content of information provided by third parties. Use of and/or reliance on such information is entirely at the reader’s own risk.
These materials are not intended for distribution to, or for use by or to be acted on by any person or entity located in any jurisdiction where such distribution, use or action would be contrary to applicable laws or regulations or would subject Mint Finance to any registration or licensing requirement.

XLK Update (daily chart)XLK is at a key area of resistance at Gann 145.11. It either breaks through this resistance next week to seek the Gartley 1.618 extension near the Gann line (151.77), or it repels downward to form a short term double top.
I note that SOX index appears to be at a level of resistance, although it's ETF counterpart SMH appears in the clear above the Ichimoku cloud. I would watch the RSI (9) trend, which took a turn downward on Friday, although I'm discounting that observation a little since Friday was a weird day with options expiration.
XLK is worth watching, since it is one of the few S&P sectors that is currently showing strength.

SOX Update (weekly chart)SOX, as well as the broader XLK, has diverged somewhat from SPY, and remains stubbornly above the 52 week EMA. The red D point is a longer term Gartley target based on a 61.8% retrace from point C.
However, it is still in an Ichimoku resistance area, and has potential to reverse.
Key support areas are;
1) 2854 -2794 DOJI, and potential pivot area
2) 2848-2742 Blue Point B, a prior swing high and potential pivot area
3) 2838 Gann Confluence Point and potential support
Should pivot areas 1) and 2) above fail, the final point to watch is the Gann Confluence around 2838. A fail below this point would be bearish. Also, an extended stay below the 52 week EMA would be bearish.
Presently the chart sits above the longer term downtrend set from 1/22 high to 10//22 low and has a ways to go before that channel should continue.

SMH - It's not as bad as you think.....SMH closed today at 234.30, above the Ichimoku Cloud and well above the downtrend channel set from 2022 high to low (grey shaded area). SMH has clearly broken out of this channel, has successfully retested. I see next low at 232.40, which is a Gann confluence line, and then a move back upwards (point D). The reason I see a bounce is that the RSI is approaching oversold on the daily at the confluence line.
Have we broken the bear downtrend? Looks like it to me. In order to resume the bear trend, we would at least need to drop at least to 175 (another Gann Confluence line), which would only take us to approximately the top of the down channel. That would be a 25.6% drop from today's close. If we want to continue the bear trend, then we would need to take out 166.97, the October low, which would be a 28.7% decline from today's close.
Is it possible that we drop another 25 - 28% from here? Of course, anything is possible. However, I don't see it as probable, unless there is a BLACK SWAN event, which no one can predict in any event (by definition). I know that many semi companies have laid off employees, and taken their pill. So future earnings reports may exceed expectations, although product demand remains an uncertainty. But I don't see a 25% drop from here in Semis on organics alone.

VIX Inverse Head And Shoulders.Likely will reach 1.618. S&P500 will likely print between $3920-$3850. Always, long VIX with caution.


SOX Update (daily chart)SOX has been diverging from SPY last couple of days, which is unusual. SOX had 50/200 EMA xover Friday. SOX is extended, could pull back to prior swing high at 2913 (-3.25%) where there is good support. Watch these tech stocks with earnings coming up next 10 days, all daily charts look bullish (except CSCO, which is debatable). All also have positive point & figure price targets (from Stockcharts.com). ADI (2/15), ADSK (2/13), AMAT(2/16), ANET (2/13), CDNS (2/13), CSCO(2/15), KEYS (2/21), NVDA(2/22).
RSI(9) has been trending up since 1/9. As long as daily RSI(9) stays above 50%, trend may continue.

Possible Price Movement For S&P500 Week Of 2/13/2023...Major bounce on Monday is likely and a major price drop on Tuesday is also likely... Happy trading!

Significantly Over Valued Nvidia.. Nvidia along with many other stocks were pumped up over 100% from the recent October low. I believe this is a bull trap and a bear market rally in a really big down trend. I am not biased but I just believe stocks are running up towards a cliff. Right now there are on the edge IMO.

SOX Semiconductors Daily chart updateJust took out prior swing high (point B). Headed for target (D) of 3041.85.
SOX has successfully reversed downtrend channel, sits above Ichimoku cloud, and will aim toward Gann confluence at 3105 (red Line).

SOX UpdateI have no problem with bold predictions, reversals I do well. SOX has historically led out of the gates on reversals. SOX has broken the downtrend, and successfully tested a Gartley retrace. While we still have an Ichy cloud resistance overhhead, I believe the market bottom is in. Will there be another selloff? Likely. However, I believe a new market bottom lower than the October low in SPY is unlikely. We also have financials (XLF) and Industrials (XLI) showing a similar trend reversal. So lets pull for more green shoots.

October rally ready to resume?If you have been anticipating a resumption in the October rally, this may be the trigger. The SMH/SOX is the (I believe) the last of the major indicies to still have a gap left unfilled. If it closes today (or this week), then maybe we can get going to the upside. Some resource stocks have already started their ascent (GDX, SILJ, UUUU, UEC, NXE, etc.)

SOX Valiant effort but a little more downside. 75% retrace upward from A to C, but there is much resistance at the 50% to 38% Fib, as well as 200 MA. However, there is a solid flag forming, which could spring an upward surprise.

SP 500 CORRECTION AT OR NEAR THE END NOW I am moving back into a net short the sp 500 using at or out of the money puts for DEC . as well as PUTS IN QQQ AND SMH .The US $ correction is near its end and should see a very strong advance to above 116 now as the sp now starts wave 3 OF C DOWN INTO NOV 23/DEC 10 .WE should now see the next target of 3160 plus or minus 70 . I will be more detailed as the structure unfolds . BEST OF TRADES WAVETIMER

𝗡𝗮𝘀𝗱𝗮𝗾 𝗨𝗽𝗱𝗮𝘁𝗲: $QQQ Daily. Bullish divergence Bullish divergence and looks like we got a full 5 waves down complete. Move similar to July may be starting. 267 key support
$NQ_F $NDX $AAPL $MSFT $AMZN $SOX $ES_F $SPY $SPX $TLT $TNX $VIX #Stocks 📈

𝗧𝗲𝘀𝗹𝗮 𝗨𝗽𝗱𝗮𝘁𝗲: $TSLA Daily. Bearish Divergence Blue pill or red pill? 💊 First time with bearish divergence on the daily in ~2 years
$QQQ $NQ_F $NDX $AAPL $MSFT $SOX $ES_F $SPY $SPX $TLT $TNX $VIX #Stocks 📉

THE TOP WAVE STRUCTURE AND CYCLE PEAK DUE NOWTHIS is the Top wave structure as stated back about 10 days ago a cycle peak due sept 10/12 I would now look for another drop into the 9/15 /16 and then the LAST RALLY BEFORE THE CRASH Panic cycle as stated in 12/28/ 2021 forecast OCT 4TH TO THE 20TH FOCUS 10/10 PANIC AND ???

SOX IS AT .786 AND AX 1.618 TODAY LOW THE CHART POSTED is that of the sox index if there was support this would be it for a wave B LOW

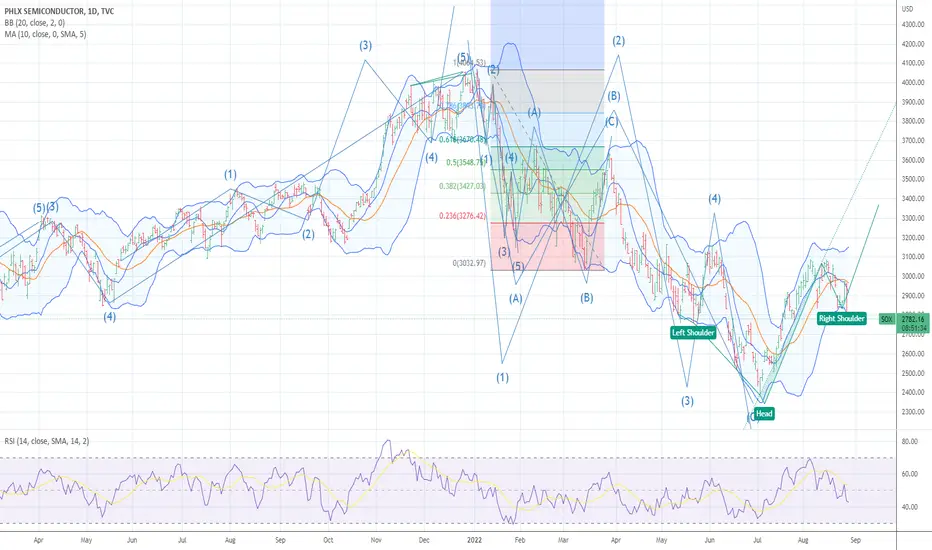
SOX INDEX BOTTOMED MOVE TO 75% PLUS NET LONG MARKET We now have an invented head n shoulder bottom and a wave 4 pullback look for a rally DO NOT BE SHORT ANYTHING
𝗡𝗮𝘀𝗱𝗮𝗾 𝗨𝗽𝗱𝗮𝘁𝗲: $QQQ Daily. Bounce time?Got a full 5-wave move to the downside as forecasted. Now it looks like we may be turning for a bounce (similar to March)
$NQ_F $NDX $SOX $ES_F $SPY $SPX $TLT $TNX $GLD $DXY $VIX #Trading #Stocks 📉

