SOXL — Buying on a Strong Uptrend with 30%+ Profit PotentialDirexion Daily Semiconductor Bull 3x Shares (SOXL) continues to move in a clear uptrend after breaking long-term resistance. Price is consolidating above the breakout level, indicating sustained interest from major market participants.
Long positions remain valid.
Profit targets:
First target — 39.85
Second target — 60.42
The setup offers over 30 percent profit potential. The semiconductor sector continues to lead the broader market higher.
Focus on trading with the trend. Adding on pullbacks is reasonable with proper risk management in place.
SOXL

SOXL 1D — With a base like this, the ride’s worth itOn the daily chart of SOXL, since early March, a textbook inverse head and shoulders pattern has formed and is now in its activation phase. The left shoulder sits at $16.67, the head at $7.21, and the right shoulder at $15.11. The symmetry is classic, with volume stabilization and a narrowing range — all the elements are in place.
The key moment was the breakout through the descending daily trendline around $19.00. Price didn’t just pierce the level — it held above it, signaling a phase shift. There was an attempt to break through the 0.5 Fibonacci level at $19.60, which led to a pullback — not on heavy selling, but on decreasing volume. This wasn’t a rejection, it was a pause.
This pullback serves as a retest of the breakout zone and the 20-day moving average. The overall structure remains bullish: price stays above all key EMAs and MAs, RSI climbs past 60, and the candlestick structure is stable. Volume rises during up moves and fades during pullbacks — classic signs of reaccumulation.
The measured target from the pattern is $32.00, calculated from the head-to-neckline height projected from the breakout point. As long as price holds above $18.40, the setup remains intact. A break above $19.60 with confirmation would open the door to acceleration.
This isn’t a momentum play — it’s a setup months in the making. The structure is there, the confirmation is there, and most importantly — the price behavior makes sense. With a base like this, the ride ahead looks worth taking.

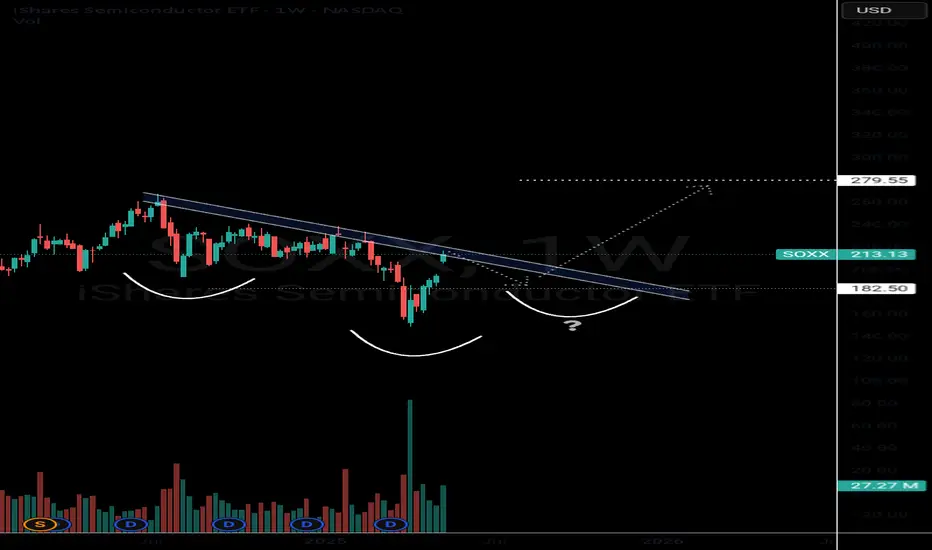
Bullish Semiconductors? SOXX The semiconductors NASDAQ:SOXX definitely tend to lead the market In bull rallies. I still think this saying will hold true for several years.
The NASDAQ:SOXX is flirting with some pretty decent resistance. This would be a perfect spot for sellers to exit and price action to digest recent gains.
If the chart plays out like I think it will, we should have a decent pullback in this area which could create an epic inverse head right shoulder. This pattern would be a very bullish setup that could take us into new All Time Highs in 2026.
This is a weekly pattern so allow the chart some tike to play out.
Chipmaker Stocks DeclinesChipmaker Stocks Declines
According to the charts, semiconductor stocks underperformed the broader equity market yesterday. While the S&P 500 index (US SPX 500 mini on FXOpen) fell by around 2.2%, the drop was far steeper across the chip sector:
→ The bullish semiconductor ETF (SOXL) declined by 15%;
→ Nvidia (NVDA) shares fell by 6.9%;
→ Advanced Micro Devices (AMD) dropped by 7.3%.
In other words, chipmaker stocks dragged down the broader market, raising concerns ahead of the upcoming earnings season.
Why Are Chip Stocks Falling?
The decline stems from corporate assessments of how the escalating global trade war and new tariffs could impact future performance.
According to media reports:
→ AMD expects to face tariffs of up to $800 million on exports to China;
→ For Nvidia, similar levies could exceed $5 billion.
Technical Analysis – Nvidia (NVDA)
The price continues to fluctuate within a downward channel, previously identified in our analysis:
The lower boundary of the channel is acting as support, helping the price close near its opening level yesterday (forming a Doji candle on the daily chart).
Technical Analysis – AMD
A similar picture is emerging on the AMD chart:
The $96 level now appears to be a key resistance zone.
In Summary
All eyes are on today’s earnings report from chipmaker TSMC (TSM), which could significantly influence the currently bearish sentiment in the sector.
This article represents the opinion of the Companies operating under the FXOpen brand only. It is not to be construed as an offer, solicitation, or recommendation with respect to products and services provided by the Companies operating under the FXOpen brand, nor is it to be considered financial advice.

$SOXL $SOXX BOTTOMED (ASCENDING TRIANGLE)An ascending triangle is a bullish breakout pattern that occurs when the price breaks through the upper horizontal trendline with increasing volume. The upper trendline is horizontal, showing nearly identical highs that create a resistance level. Meanwhile, the lower trendline slopes upward, indicating higher lows as buyers gradually increase their bids. Eventually, buyers become impatient and push the price above the resistance level, triggering further buying and resuming the uptrend. The upper trendline, which previously acted as resistance, then becomes a support level.
Semiconductors NASDAQ:SOXX are crucial to the United States for several reasons:
Technological Backbone: Semiconductors power essential technologies like smartphones, computers, cars, and medical devices. They are integral to almost everything with an on/off switch. The semiconductor industry aka NASDAQ:SOXX significantly contributes to the U.S. economy. It supports millions of jobs and drives innovation in various sectors, including artificial intelligence, biotechnology, and clean energy.
Semiconductors are vital for national security. They are used in military systems, aircraft, weapons, and the electric grid, making them critical for defense and infrastructure. Maintaining a strong semiconductor industry helps the U.S. stay competitive globally so BUY AMEX:SOXL , $SOXX. The CHIPS and Science Act, for example, aims to revitalize the U.S. semiconductor industry, create jobs, and support American innovation. Strengthening the domestic semiconductor supply chain reduces dependency on foreign sources, enhancing the resilience and security of supply chains.
BUY NOW AND HOLD

Opening (IRA): SOXL March 21st 29 Covered Call... for a 26.85 debit.
Comments: High IV; starter position. Selling the -75 delta call against shares to emulate the delta metrics of a 25 delta short put, but with the built-in defense of the short call.
Metrics:
Buying Power Effect/Break Even: 26.85
Max Profit: 2.15
ROC at Max: 8.01%
50% Max: 1.08
ROC at 50% Max: 4.00%
Will generally look to take profit at 50% max, add at intervals if I can get in at better strikes/better break evens than what I currently have on, and/or roll out the short call if take profit is not hit.

Opening (IRA): SOXL April 17th 24 Covered Call... for 22.48 debit.
Comments: Starting my run at April, adding at strikes better than what I currently have on.
Metrics:
Buying Power Effect/Break Even: 22.48
Max Profit: 1.52
ROC at Max: 6.76%
50% Max: .76
ROC at 50% Max: 3.38%
Will generally look to take profit at 50% max, add at intervals assuming I can get in at strikes better than what I currently have on, and/or roll out short call if my take profit is not hit.

Opening (IRA): SOXL May 16th 17 Covered Call... for a 15.68 debit.
Comments: Laddering out a smidge here, selling the -84 delta call against shares to emulate the delta metrics of a 16 delta short put, but with the built-in defense of the short call.
Metrics:
Buying Power Effect/Break Even: 15.68
Max Profit: 1.32
ROC at Max: 8.42%
50% Max: .66
ROC at 50% Max: 4.21%
Will generally look to take profit at 50% max, add at intervals, assuming I can get in at strikes/break evens than what I currently have on, and/or roll out short call if my take profit is not hit.
Long SOXL: Longer term trade, but one that has worked since 20164 Trades over 8 years
SOXL 3X Levered ETF on Semiconductors
High to low:
Start 2/12/2016: +1,338%, 763 Days
12/24/2018: +392%, 393 Days
3/18/2020: +1,821%, 651 Days
10/13/2022: +937%, 637 Days
Not a quick trade, but it has been profitable.

OH NO! $SOXS is primed for a significant rise.The concept of a multiple bottom suggests that the stock has already experienced a significant decline, creating a buying opportunity at a lower price over time.
Plus, Trump is coming= BYE semidocutor stocks!
Stricter trade policies and tariffs on imported semiconductors could disrupt global supply chains, leading to higher costs and potential shortages.
During his previous presidency, Trump focused on "America First" policies, which included promoting domestic manufacturing and reducing reliance on foreign supply chains
Additionally, there were concerns about the potential mismanagement of federal initiatives like the CHIPS and Science Act, which aimed to boost domestic semiconductor manufacturing.
AMEX:SOXL , NASDAQ:NVDA , NASDAQ:AMD , NASDAQ:AVGO , NASDAQ:QCOM : Sell now to take the profit.
IT'S COMING

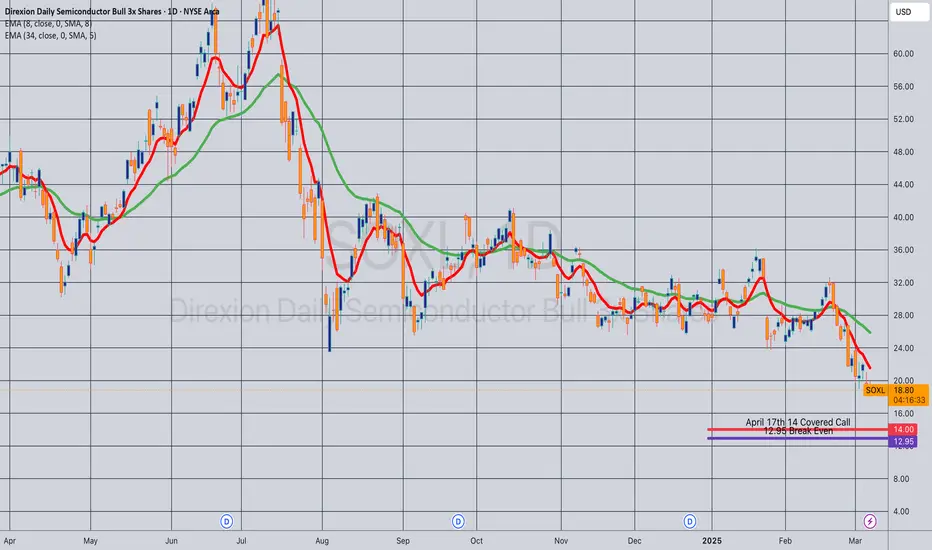
Opening (IRA): SOXL April 17th 14 Covered Call... for a 12.95 debit.
Comments: High IVR/IV. Adding at strikes better than what I currently have on, selling the -81 call against shares to emulate the delta metrics of a 19 delta short put, but with the built-in defense of the short calls.
Metrics:
Buying Power Effect/Break Even: 12.95/share
Max Profit: 1.05
ROC at Max: 8.11%
50% Max: .53
ROC at 50% Max: 4.06%
Will generally look to take profit at 50% max, add at intervals if I can get in at break evens better than what I currently have on, roll out short call if my take profit is not hit.
Weekly Preview on FX & ETFsThis video is a weekly preview into what I am looking at for the EUR/USD, GBP/JPY and USD/JPY as well as ETF's.

DCA Play $SOXL | TARGET 1 REACHEDPrice action moved with good momentum and maintained volume for the trading day.
The original call is good to go:
T2 @ $32.70 to gap fill if momentum is persists (poor spelling when analyzing at 3am - but you get the gist)
I expect a minor pull back before gap fill; depending on price action, may or may not add to position.
A gap up would be signal to close all profits, with a +10% PnL.
gg

Opening (IRA): SOXL March 28th 20 Covered Call... for a 18.91 debit.
Comments: I wanted to take advantage of this little bit of weakness here, but at less risk than what I ordinarily take, giving me more "room to be wrong." Here, selling the -84 delta calls against shares to emulate the delta metrics of a 16 delta short put, but with the built-in defense of the short calls.
Additionally, it's at strikes better than what I currently have on ... .
Metrics:
Buying Power Effect/Break Even: 18.91
Max Profit: 1.09
ROC at Max: 5.76%
50% Max: .55
ROC at 50% Max: 2.88%

Is SOXL ever going to breakout...Have held long on SOXL for about 5.5 weeks now with an average price of $30. I identified a wedge alongside "hidden" divergence on the MACD on a weekly time scale but it's still been pretty much in the same zone/area of consolidation.
When the DeepSeek news broke out, I was for sure ready to cut ties with this one since the Nasdaq was in a complete bloodbath but I gave it some room and glad to see it has been recovering OK for now.
My original target for one is/was $40 but I'd consider taking it off the table if we saw $35+ again. We'll see how this week performs and watch for that gap being filled.
Good Luck & Trade Safe.

Opening (IRA): SOXL March 21st 23 Covered Call... for a 21.09 debit.
Comments: Adding at strikes better than what I currently have on, selling the -75 delta call against shares to emulate the delta metrics of a 25 delta short put, but with the built-in defense of the short call.
Metrics:
Buying Power Effect/Break Even: 21.09/share
Max Profit: 1.91
ROC at Max: 9.06%
50% Max: .86
ROC at 50% Max: 4.03%
Will generally look to take profit at 50% max, add at intervals, assuming I can get in at strikes better than what I currently have on, and/or roll out the short call if my take profit is not hit.

EUR/USD & GBP/USD - Is the Bull still alive...After the Trump tariffs gap last week, the EUR/USD and GBP/USD experienced a significant gap down but recovered nicely. GBP/USD positions were closed at a small profit to protect overall risk but still holding long positions on the EUR/USD and continue to look for 1.0600 as long as price does not exceed 1.0200.
Expecting some volatility this upcoming week especially with Fed chairman Powell testifying on both Tuesday and Wednesday. Will keep an eye on price action and it's development.
Aside from FX, still holding SOXL and looking for the gap to be filled but keeping a close eye on the breakdown below $24.
Good Luck & Trade Safe.

Oh no! SHORT TERM BEARISH- BACK TO 116 AT LEAST. $NVDA SELL NOW!A dead cat bounce refers to a temporary, short-lived recovery in the price of a falling stock. The term comes from the notion that even a dead cat will bounce if it falls from a great height. It is also commonly used to describe any situation where something experiences a brief comeback during or after a significant decline. This phenomenon is sometimes called a "sucker rally."
- Breakdown of the rising wedge pattern.
- SMA 20 & 50 are coming down
- Tariff wars with China and other countries
- Deepseek Shock/ Tech Shocks aka Al Black Monday on
- High inflation (Fed NOT "in a hurry" to push more rate cuts)
- Volume is decresing while price is increasing too fast.
- NASDAQ:SOXX shows weakness
Hopefully, NVDA holds at $116. Otherwise, it might gap down to fill at $95.
Advise selling now and purchasing again at a lower price.

Opening (IRA): SOXL March 21st 20 Covered Call... for an 18.21 debit.
Comments: Adding to my current position at strikes better than what I have on, selling the -75 delta call against shares to emulate the delta metrics of a 25 delta short put, but with built-in short call defense.
Metrics:
Buying Power Effect/Break Even: 18.21
Max Profit: 1.79
ROC at Max: 9.83%
50% Max: .90
ROC at 50% Max: 4.91%
Will generally look to take profit at 50% max, add at intervals assuming I can get in at strikes better than what I currently have on, and/or roll out short call if my TP is not hit.

Opening (IRA): SOXL March 21st 23 Covered Call... for a 20.87 debit.
Comments: High IVR/IV. Adding to my position at a break even better than what I currently have on. Selling the -75 call against shares to emulate the delta metrics of a 25 delta short put, but with the built-in defense of the short call.
Metrics:
Buying Power Effect/Break Even: 20.87
Max Profit: 2.13
ROC at Max: 10.21%
50% Max: 1.07
ROC at 50% Max: 5.11%
Will generally look to take profit at 50% max, add at intervals (assuming I can get in at a break even better than what I currently have on), and/or roll out the short call in the event take profit is not hit.

Opening (IRA): SOXL March 21st 20 Covered Call... for a 17.96 debit.
Comments: High IVR/IV plus weakness. Adding at strikes better than what I currently have on, selling the -75 delta call against shares to emulate the delta metrics of a 25 delta short put, but with the built-in defense of the short call.
Metrics:
Buying Power Effect/ Break Even: 17.96/share
Max Profit: 2.04
ROC at Max: 11.36%
50% Max: 1.02
ROC at 50% Max: 5.68%

Pre-FOMC Week - Bullish run on the EUR/USD & GBP/USD....Like last week's video analysis, I'm currently holding long positions on the EUR/USD and GBP/USD. I'm expecting strong movements in the coming week due to FOMC and Interest Rate Policy.
The ETF SOXL, has been running well although Friday dumped pretty hard but long positions remain solid. I'll remain diligent in observing the price action this week and hopefully book a good 90% profit so far for the 1st Quarter of 2025.
EUR/USD:
•1.0265
•1.0416
•Target: 1.06000
GBP/USD:
•1.2209
•Target: 1.2600 or 1.2700
ETF SOXL:
•$29.01
•Target: $36 or $40
Good Luck. Trade Safe.

FX & ETF Bullish Market ideas for EUR/USD, GBP/USD & SOXLIn this video I share my bullish ideas on two currency pairs (EUR/USD & GBP/USD) along with ETF (SOXL) and reasons for looking at the bullish side.
The markets look a bit flat at the moment however I'm keeping an eye on how we close this week and make preparations going into next week which could spark some volatility as Donald Trump takes office.
Good Luck. Trade Safe.
