TERADYNE (TER) a AI / Chip Sector Stock SHORTTER shown here on a 30 minute chart has asended in a diverging channel to the resistance of
January pivot high shown in the line and zone drawn onto the chart. My idea is to short it
from here targeting first about 106 which is the line drawn from a pivot before the
paradoxical fall with a decent earnings report. The lower target is the support trendline of
the channel or about 103.5. This is about a 6% potential trade and more with margin or
put options. I expect the trade to last two days as falling down is usually quick than rising.
SOXX

MU breaks through ATHs Bullrun does not relent LONGMU on the monthly chart 4 weeks ago crossed above the previous ATHs of 2021-2022 and has
risen without retesting. Adding $9 to the all time highs for 10% inflation since then would adjust
them to $104 and price is now in that range and above. Price is in the uppermost anchored
VWAP bands and thus prone to reversal. However, MU is not as overextended as NVDA. Its
upside is likely there as it competes in the space. Growth will accelerate once the new chip
plant in upstate NY comes online after the construction is completed. NVDA is reportedly
looking at Vietnam. I already have a large sized position in MU. I will add to it now even
if it may be overbought. There is good cause for the overbuying. I want to support the domestic
economy and understand national security interests in chip manufacturing here in the USA
consistent with the recent federal law and stimulus associated with it.

AVGO dips for a buy now $50 under ATH LONGAVGO is asking to be chased. On the daily chart, the price is now $50 below the ATH of
the top of of the month. RSI on the lower TF green line has pulled back to 72 from 85.
The longer TF black line is admittedly in overbought territory. The longterm growth
expectations of the AI stock defy ordinary technical analysis, AVGO is 3-4% below the ATH.
I see this as an opportunity to diversify in AI stocks by getting a small position in BroadCom
to supplement NVDA, MU and INTC. I am looking at TXN as it has a lower price tag and is
about 10% below ATH. ( The growth prospects need a look to see if they are there.)
I expect AVGO to compete well in the space and can see that it is making agreements with
some other companies well situated in AI .

Nasdaq, Semiconductors, Natural Gas, Bitcoin: FOMC reviewDiscussing the sell off in semis today.
Potential reversal in Nat gas
Bitcoin & crypto selloff.
FOMC tomorrow: No rate cut.
Will Powell come out hawkish tomorrow? its looking likely he will based off of the BOJ rate hike. Oil surging doesn't help the dovish case.
Commodities breaking out doesn't help the inflation fight.

AMD Corrected Again- Buy the Dip Idea LONGAMD on the 15 minute chart breakout through anchord VWAP bands starting on February 29th
from the mean anchored VWAP support. Two days later finding itself extended to the second
upper VWAP band, price corrected over the next day down to the first upper band and then
after a few hours reversed and headed back toward the second upper band going somewhat
sideways and getting there two and a half days later. Price was rejected from that dynamic
resistance and fell into the first band which provided support to close the week.
The Luxalgo regression line forecast is for yet another more up to test the resistance of that
second upper band. I will take a long trade here recognizing that the forecast is for a 10-12%
move in the immediate term. If the forecast is accurate a stop loss will not be necessary. I will
set it at 204 to prevent anything other than an insignificant loss.

AVGO Chipmaker in an ascending channel SHORTOn a 30-minute chart, like several other computer chip manufactures has approached or
reached a near-term top. Overall Broadcom has gained 19% YTD. Earnings are in about two
weeks. I see this as a short trade to follow AVGO from the top of the channel down to about
1225 in time to catch earnings at the bottom of the channel to end the swing trade and instead
go long from there. I intend to close the trade two days before earnings and flip sides
hunting the beat on the earnings.

SOXL / SOXS , this ratio analysis shows when to trade eachSOXL is the triple leveraged semi-conductor ETF while SOXS is its inverse. While SOXL
is primarily up trending in its intermediate and full-time history, it does from time to time
have a correction mainly when the technology sector gets challenged. I have found that
plotting the ratio of the share values is a very accurate way of pinpointing those corrections
and temporarily buy some SOXS to offset the downward price action and nullifying any
loss. This is more or less insurance in case the overall position must be closed for one reason
or another or transient hedging. As can be seen, these corrections last 1-5 days . This strategy
is effective risk management as during the correction the SOXS gains some of what SOXL
loses especially if the share dollars are equally balanced. Ever better is the same thing on
a 2-3 hour time frame albeit it with more hedging trades.
I have found that this strategy works on a variety of inverse ETF pairs. Most of them however do
not have one side going up more or less continuously and instead oscillate rather than simple
and shallow corrections like this pair. Please give a like if you this this could be helpful to your
trading.

TESLA & SMCI: the tail of Semis vs EV stocks.Tesla has had a beautiful bounce off support.
This bounce comes on the back of a strong market, charging higher.
If Tesla can hold above $195 it may move for the gap fill. Caution to the wind with Tesla as it has triggered a very bearish breakdown.
SMCI is one of the best performing Semis. Its gone completely parabolic on its earnings.
after gapping up 30% on its pre guide, its now up another 10% in the afterhours.
The semis seem to have an unlimited amount of capital flowing into them.
Look for an intra day short opportunity (day trade) on SMCI

Members Daily Analysis - Jan 28 2024Watching the Yield Curve inversion closely...10's - 2's is narrowing.
Weekly Reversal in the Semiconductors.
Oil massive breakout! Dollar next?
Tesla losing Mag 7 status...its now only 10th largest company.

Members Daily Analysis Jan 25Tesla Pummeled down 12% & Losing Mag 7 status.
INTC poor earning reaction, weighing on Semiconductors
Oil absolute definitive breakout.
Dollar looks ready to pop.
Vix creeping up.

Members Daily Analysis December 3rdDollar Surging Reversal!
Small caps Obliterated
Oil Bullish Reversal.

Has Nvidia finally topped?NVDA just put in a weekly bearish engulfing candle!
This is the first sing of a leading Mega Cap potentially seeing some distribution.
If this bell weather names keeps falling its going to turn the sentiment in the semiconductors slightly more bearish and will weigh in on the QQQ.

Markets Hitting FOMOThe major indices have outperformed over the last couple weeks.
Shorts and put skews are at all time lows.
No downside protection is being bought at this time.
Are stocks going to the moon again?

Nvidia Earnings tomorrow! Place your betsNvidia made a new all time high today.
We will see if it can continue beating its revenue 20% Quarter over quarter.
Resistance & Support is clear.

SOXL - Falling Trend Channel [MID-TERM]💡 Pattern: Falling Wedge
💡 RSI: 57 Neutral
💡 Risk: Extreme
✅ Resistance: 28.4
✅ Support: 22
PERFORMANCE
🔴 ST: NEGATIVE
🟢 MT: POSITIVE
🟢 LT: POSITIVE
*ST: Short-term | MT: Mid-term | LT: Long-term
Verify it first and believe later.
WavePoint ❤️

SMH: Are semis breaking down?Last time we saw the bullish moving average cross of the 7MA & the 590 MA we saw a superb rally over 2.5months.
This time we are seeing a bearish cross of the same 2 moving averages. Could this replicate the move to the downside?
Don't say we didn't caution you!

NVDA Breaking Out from Consolidatiom LONGNVDA has been in consolidation for two weeks. On the 1H chart, yesterday, the MTF RSI
indicator shows that the lower TF RSIc rossed over the 50 level and then crossed over
the higher TF RSI a clear and convincing sign of rapidly increasing relative strength.
Price is in a VWAP breakout now having crossed from the mean VWAP anchored into mid- June
and up crossing over the one and two standard deviation lines.
The zero-lag MACD shows a line cross under the histogram occurred in the after-hours trading
on Tuesday evening. Price has crossed over the POC line of the visible range volume profile yet
another sign of bullish buying pressure and momentum. Overall, my analysis is that NVDA is set
up for a long swing trade which I will take today.

SOXL pullback is ready to buy longSOXL the 3X leveraged ETF of semiconductor stocks has gained 145% for the first half of the
year. As shown on a 2H chart, the price has pulled back but the overall trend of HH and HL
is intact within an ascending parallel channel. Price previously touched the lower
trendline on May 24th while it touched the upper trendline May 30th and then again
June 15th. Between May 31st and June 7th it did a Fibonacci retracement. Price is presently
reversing at the lower trendline and is above the Ichimoku cloud a sign of bullish predominance.
Price is above the mean VWAP anchored to the low of May 24th another bullish sign.
The RSI indicator showing Ichimoku features has an RSI above 50 and above the cloud
affirming a bullish bias. I believe that this is setup for a long trade with about 12-15% upside in
two weeks or less for a much smaller risk. A call option trade could also be entertained
if a setup with a good delta low spread and high volume / liquidity can be found.

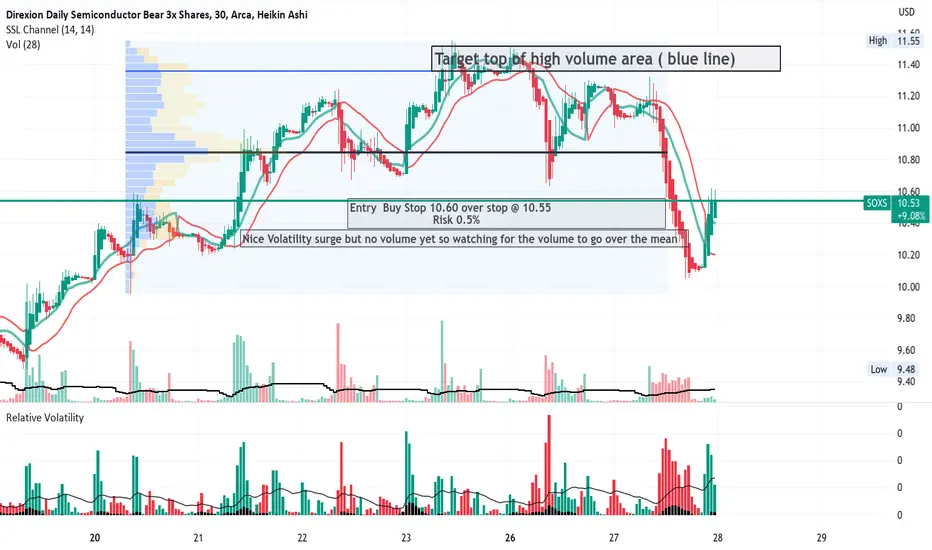
SOXS Bearish Leveraged semi-conductors ETFNVDA turned down today while SOXS rose a bit. On the 30 minute chart is shown to have
have been trending down but then reversed in the after-hours trading period albeit with
the low volumes typical of after-hours. The relative volatility indicator however showed
a dramatic reversal and will be beyond the moving average within the indicator.
Overall, I see this as a day trade for June 27th. I have marked out a tight stop loss to minimize
risk. This trade which I will enter in the premarket is expectant for 8-9% profit and so
a reward to risk of 15:1
Top 3 AI stocks NOT to buy now | Stock Market Price Level Guide - QQQ and SPY still complete full bull control cant remember the last time bears confirm a hourly downtrend.
- TSLA relative weaker to QQQ today
- AAPL and MSFT lead bull leading the market today, ALL time highs
- GOOGL and AMZN weaker of the techs today
- NVDA also weaker with double top from yesterday
- im shorting SOXX so buying SOXS and would like to see AVGO AMD NVDA potentially fall here, if not ill stop out small from todays highs sideways range.

Golden Cross ETF – Strong Bullish Pattern - $1000 Price TargetThis is a once in a lifetime opportunity to go long with SOXX. The arrival of the golden cross is a strong bullish pattern for the ETF. $1000 price target by end of 2025.

Short Semiconductors by Trading SOXS LongThis chart shows the long-term ratio between SOXL/SOXS. The intent is to detect reversals
between semi-conductors long and short. At the pivot high, the price of SOXL compared with
SOXS is at its highest. With a retreat from the pivot high, the price of SOXL is retreating while
SOXS is rising. Historically in 2022 as shown on the chart, pivots were with a ratio of 1,25 to
2,35 while the low pivots were with a ratio of 0.2 to 0.6.
At present SOXL has run up and over-extended as part of the AI breakout phenomenon. The
ratio of 1.8 is in the reversal zone where SOXL price is dropping while SOXS price begins
a significant rise. At present, the mass index is above 27 and awaiting a drop below 26.5.
The second indicator rate of change (ROC) detects spikes in the SOXL /SOXS ratio presumptive
for a pivot. The last time SOXS ran up over a long term ( with SOXL turning down)
was August to October when price increased from $33 to $88 representing a 266% rise.
I see this as a prior supertrend that could now be repeated again.
In conclusion, this idea leads me to take a swing long position is SOXS which I expect to
trend up over a period of a couple of months or more.

SPY & QQQ Bull Break - Can we Trust this Move?- SPY trading double top at FOMC reaction highs from April
- QQQ Clear breakout but AAPL didn't participate that much
- Money rotating from AAPL into GOOGL and AMZN
- NASDAQ rising wedge still in play, but QQQ broke out of the rising wedge
- SOXX semi sector at potential H&S resistance, if it breaks out will give QQQ more fuel for upside.
- NVDA new 52 week high in sell zone now.
