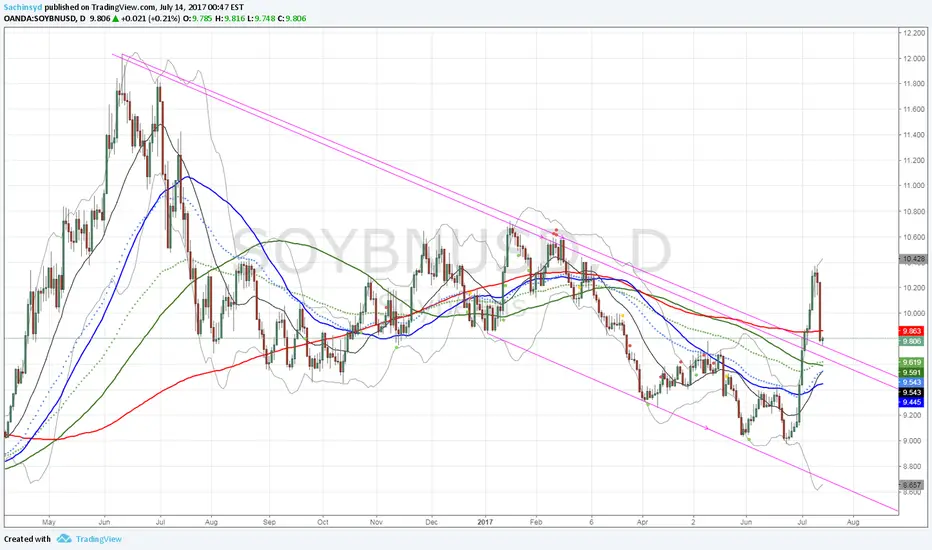
SOYBNUSD SELL FOR SHORT TERM, BUY FOR MEDIUM TERM.Hi there. Price is forming a continuation pattern to the upside. Wait for the price to complete the pattern and watch strong price action for sell. On bigger time frame, price is forming a continuation pattern to the upside. Wait for the price to hit the bottom of the pattern and watch strong price action for buy.
Soybean

SOYBEAN - What kind of pattern should be this one?The #Soybean is developing an interesting structure. What should be the next move? The RSI oscillator could give you a clue.

SOYBEANies - A simple approach to find hidden facts.Here's how I approach the beanies.
It's a simple concept and it "works" over and over again.
But...what do I mean by "work"?
I mean, that this concept (...go by the numbers on the chart) helps me to understand, and to reveille what's obviously, but hidden from my eyes at the first glance.
It's a simple plan what to analyze step by step...from top-down...exploring different types of facts and finally putting them together into a story that makes sense.
That's it...no magic, just pure crafting.
And you can do this too!
Seriously, just start...
P!

Soybean Meal: Long towards the neckline's Resistance.The price has completed a Head and Shoulders pattern on 1W (RSI = 45.662, MACD = -8.520, Highs/Lows = 0.0000). The neckline is within 293.90 - 341.40, a range that Soybean Meal roughly traded in for 540 days (August 2016 - February 2018). This can be used as a basis for a long term sideways strategy of selling near the Resistance and buying near the Support.
** If you like our free content follow our profile (www.tradingview.com) to get more daily ideas. **
Comments and likes are greatly appreciated.

ZS Soybean fut pointing to positive trade outlook with gap up?ZS Soybean fut pointing to positive trade outlook with gap up

Soybean futures - Short to 700; Horizon: 6 monthsSoybean futures in the CBOT will approach the late 2015 levels of 800-850. The last time this downward support was crossed was in 2004 and it was a big downward trend of -35% with good short entry opportunities. This position is correlated with our medium-term view of bearish commodities in the next 6-7 months with a bullish USD and a bearish EUR. Our target is a drop of -18%, approximately at a price of 700.

SOYBEANS BUY (SOYBEANS – US DOLLAR)Hi there. Price is forming a continuation pattern to the upside. Wait for the price to hit the bottom of the pattern and watch strong price action for buy.

Soybean Futures Momentum BearishThis week price closed with strong bearish momentum after hitting the reversal zone.
With production estimated up, and uncertainty with China trade, the bearish momentum may push further to 854 - 820 level in coming weeks.
Looking to complete the downward range to -27.2% level of the weekly Fibonacci retracement range.

Buy Soybean Meal after a small pullbackAccording to Larry Williams if we make a higher low we can be buyers here - targets are 330-335

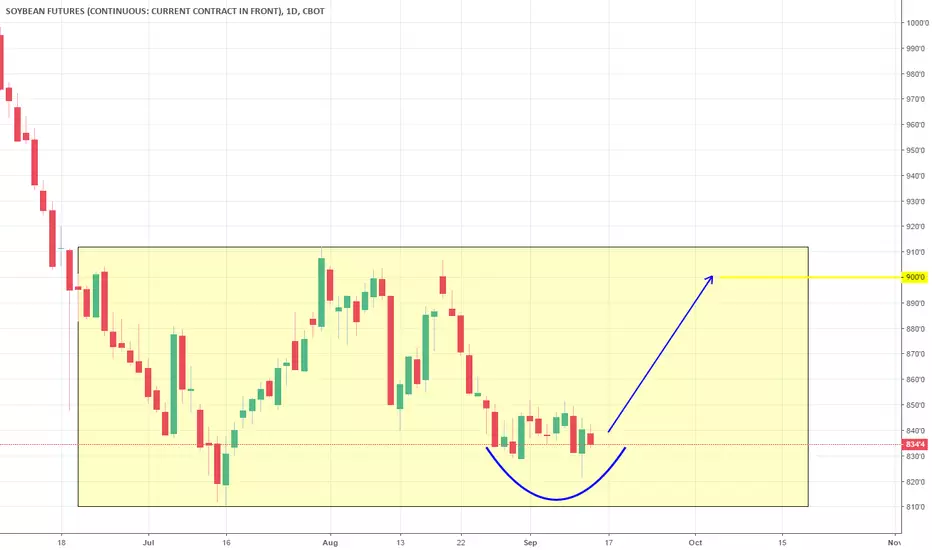
Rectangle Support tested. Reversing towards the Resistance. LongSoybeans (ZS1!) are consolidating (Highs/Lows = 0) near the 1D Rectangle's support (810 - 910). Based on this sideways pattern since late June, the price should now approach the 910 Resistance. We are long, TP = 900.
1D Lower High made. Short.Soybean Meal (ZM1!) made a Lower High on the 1W Channel Down (RSI = 39.076, MAC = -8.620, Highs/Lows = -5.800, B/BP = -25.7200) and should now reverse lower towards a new Lower Low. The first short target is 293.80 as the Lower Low extension since the last bottoms supports there. If crossed, we will continue shorting, TP = 275.20.


Targest hit. Wait for confirmation on breakout points.Both TP = 30.14 and 29.44 hit as the previous bearish Channel aggressively broke earlier and met the targets much earlier than I expected. Soybean Oil has now entered a new Channel Down on 1D, which is coming off a Lower High (hence Highs/Lows = 0, RSI = 51.334). We now need to wait for confirmation from the two break-out points (illustrated by the circles). If the upper point breaks then we will go long (TP = 28.99 and 29.44). If the lower point breaks then we will go short (TP = 26.51).

1D Rectangle. Scalping.Soybean Meal is trading sideways inside a 1D Rectangle (325 - 341) since late June (RSI = 46.257, CCI = -35.7793, Highs/Lows = 0.0000, Ultimate Oscillator = 49.818). Our optimal strategy involves scalping within 326.60 - 338.10.


Channel Down on 1W. Short.Nothing too complicated here. The price is on a 1W Channel Down with a soft Resistance (Lower High on the 1D Channel Down) at 31.04 after having made a Lower High (hard resistance) at 32.04. Our medium term targets are 30.14 and 29.44.

SOYBEAN Buy IdeaSOYBEAN Buy Idea @Weekly Demand Zone (984.0 - 967.6)
Buy Limit: 984.5
Stop Loss: 967.0
Take Profit: 1035.0

SOYBEAN FUTURES Buy ideaSOYBEAN FUTURES Buy idea @Demand ZOne 995.4 - 967.6
Buy Limit: 995.4
Stop Loss: 967.6
Take Profit: 1037


SOYBEAN LT buy opportunity SOYUSD overall in uptrend, looks bullish, waiting for retracement to the marked area and when it gets there pick up some longs as bulls come into the market. SL ideally below swing low. It bounced off 10.7/10.8 tops previously so do not be too gready with targets rather bank sth than end up with a loss.

Soybean Following Uptrend Bullish ButterflyNovember Soybean is following an uptrend. Although today was bearish and probably the next two days next week, we should see another round of buying. Soybeans got hit on the USDA report so not too sure how high this will go. This may be a simple three drives pattern and double top rejection. R1 becomes resistance. Trendline becomes support. Next downside target is at pivot at 955'2, then trend. If trend broken and stays below trendline at the end of the day. S1 at 925'3 will be the next target. Bullish Butterfly is the pattern.
"With production looking a little bigger, futures should battle to hold Aug. 31 lows. The best chances for rallies in the short term come from weather in Brazil, where conditions are dry ahead of the start to planting Sept. 15. "
www.farmfutures.com