Soybean

SOYB - Soybean CornerHmmm....very interesting to me.
Price bounced at the L-MLH.
It produces what I call a corner.
And if I throw a fork on it, it fits the "edge".
Letting it come back and try to hop on to the long side.
P!

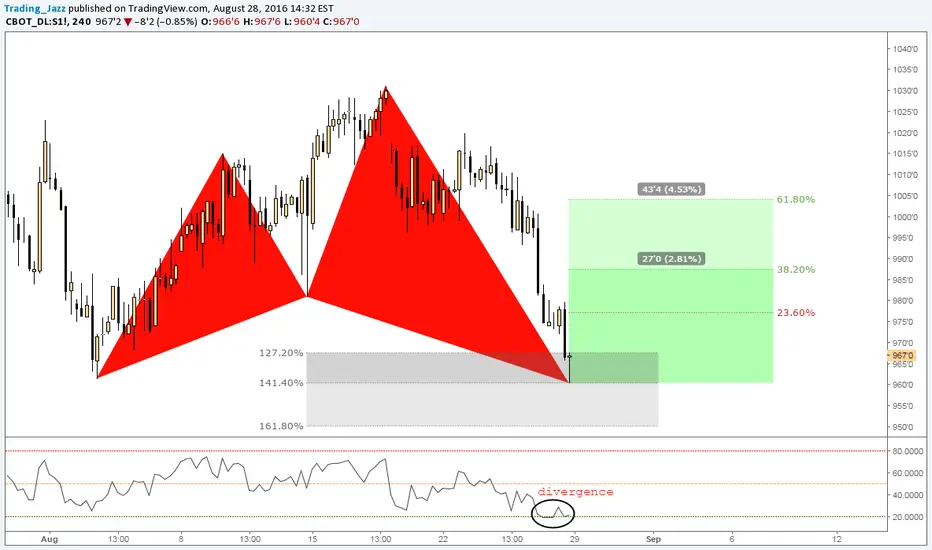
Soybean Futures Bearish CypherJuly Soybeans rising higher. Potential target 990'2 to build out a Bearish Cypher.

Soybeans settle into rangeSoybeans settle into their "normal range". Time to sell straddles or strangles.

Soybean -- good position for medium term longNice position to try long from here (945).
Stop below 935 (daily close).


Soybeans Doji Series with HaramiMay Soybeans has formed a series of long legged dojis at the end of a completed bullish Butterfly that are rising. This could be a rising flag that will create further downside selling, or turn to and upward movement. Waiting for confirmation. Open Interest is slowly rolling suggesting a turn, and RSI is very bearish. Today marked a harami reversal pattern. We are forecasting a Gartley as next pattern to resistance at 1036

Mid-term cyclic bullish setup for Soybean oil - ZL CBOT FuturesLook forward for gain starts in early April

Soybeans closing in on bullish GartleyMay Soybeans is closing in on the final steps for a bullish Gartley. Support is at 1036. Price action could push this lower to trend line. 20 day moving average has rolled bearish. Brazil crop 25% in and sees this crop big. Look for USDA speech on Thursday for 2016 numbers and 2017 projections.

Soybeans Bullish Gartley PatternSoybeans bullish Gartley was adjusted up after making a top on Monday. Higher price was rejected Wednesday. How far this falls is conducive on Soybean sales and the crop being taken off in South America. 1036 would be a good area. Open Interest is rising supporting fall.
"Brazil is harvesting a big crop but rain the next few days could slow that process. USDA expects a 104.1 million metric ton harvest there, but private forecasts are larger with some at 105 million."

SoybeanThere are strong flag signals in a lot of markets for the coming week. May Soybean is creating a bullish flag. Tails on candlesticks are rejecting lows. Look for this market to go up either Monday or Tuesday. Support at 1069

SOYBEAN MEAL TRIANGLE BREAKOUT IS VERY BULLISHSince october we have been moving in a sideway motion. I think this range is coming to an end. The bulls dried out the bears, and are now ready to take the price to the next level higher at 360. The impulsive breakout yesterday is paving the way for more gains to come.
Note the bullish hidden divergence, which also shows the increasingly strong hand of the bulls and the RSI breakout.
The seasonal pattern is also in favor of the bull side, from february until june is the best seasonal phase for soybean price pressure, so this might support this trade idea.
I am personally looking for a small retracement towards 320 and will look at the lower timeframes for signs to enter with a stop at 310 and the plan is to trail this position towards 360.
Please use proper risk management and dont risk too much.
Best of luck.

Soybeans Up SharplyThursdays report came in today. March Soybeans up sharply with a bullish USDA report pushed down production estimates lower than expected. Changed pattern from butterfly to Cypher pattern with extension. Next target for bulls is in the 1060 area.

soybean breakoutFirst of all, this is a late analysis but it shows a simple textbook style breakout therefore we would like to share. 3 days ago price broke the wedge and the 200 ma down. Next day a little pullback (should have sold here) and another strong bearish candle. If this gives another chance we would think about selling this close to 200 dma. For now this is a sell


Soybean staging for another run at resistanceIs soybeans setting the stage to make another run at an upper channel line of resistance started with the August 2012 high? Current weekly and daily action looks like this is the case. Should price continue up, how it responds will indicate if new shorting positions should be taken of existing longs can be held. Another option would be to hold longs with this line as target and then re-enter once price shows direction.
weekly:
daily:

SOYBEAN - Back to support, now what?This weekly chart reveilles what happened after price shoot up...80% to the centerline as we know.
Unfortunately it never gave us a chance to profit from this straight way up. The only potential, riskier entry would have be taking the test/retest at the up sloping A/R.
Price reached the centerline, bounced back down, did a textbook retest of the zoome centerline and fell off the cliff.
New chance to buy?
Well, at least we would have a tiny little structure (green block) which could act as support.
If you wanna be right, look to the left, my mentor always said. By doing this we can see where the real base where in 2007/2008. There we have a huge structure which to me on the longer timeframe is very important, as longterm traders respect and trade upon those mountains and valleys.
Extending it's base to the right, we see where price would land today...right in the zone of
a) the very old base
b) the support of the (green) block and
c) potentially down to the L-MLH of the orange fork
If ones intention is to play the big game, then he definitely would do himself a favor by being patient and observe what is going on from now.
P!

Soybeans anticipating pullback on daily before moving higherI'm watching soybeans for a pullback on stoch and for ADX to move over 20 with +DMI holding. A move up in price after this scenario could be a buy signal.

SOYBEAN OIL UPDATEI was slightly early. Here is the entry.
If you could be in love with a set-up, this is love.
THIS WILL BE A MONSTER TRADE