Soybeans - Short IdeaI discussed this long trade back in may, I now see the short.. it just kept riding up!
There it is.. highlighted on the chart.
Soybeans

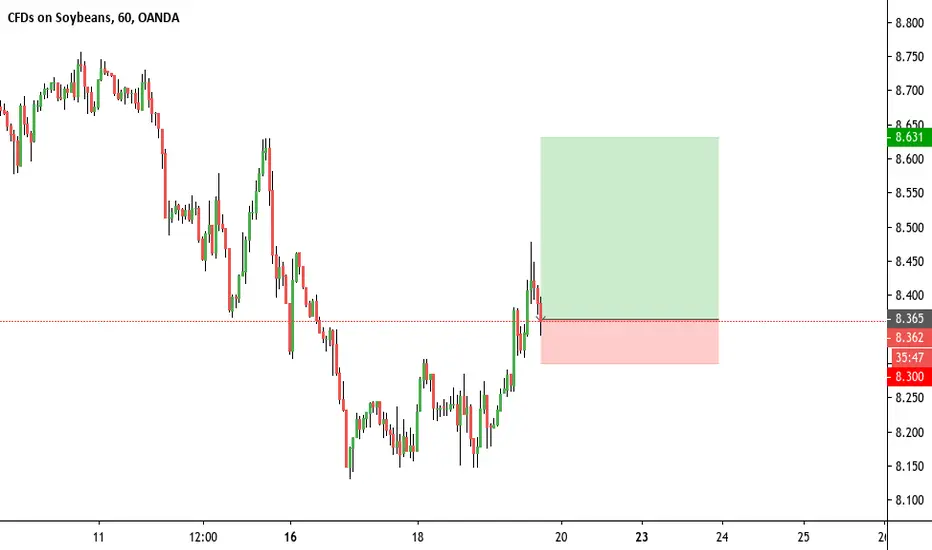
SOYBEANS keeping pushing higher - another great RJT catchCaught using my RJT averages tool this SOYBEANS trade keeps moving higher.
84 points locked in (pink line - 0.8*ATR).
Currently 569 points in profit.
Waiting for exit signal (close cross of upper channel).
Continuation trade also executed and closed (continuation indication - TP white line) for 85 points profit (0.8 *ATR).
DM for more info/access.

Week 36: ZSX 20202 let's do the counter trend!Bullish week for ZSX 2020, the resistance level was breached and no sign of slowing down.
When everyone is having bullish reading, it is a good opportunity for us to Short.
I would split my call today into two sections:
If you are a scalper and speculator, now or today is a good time for you to LONG ZSX 2020.
Not much upside, but you can do a "quicky" as follows:
Buy at market which is now around $964.50
Take Profit at $975 area
Stop Loss at $960
And here is my calculated trade opinion on ZSX 2020:
Sell Limit at $975
Stop Loss at $985
Take Profit at $960
Risk Reward Ratio = 1.4R
Disclaimer :
The analysis above for educational purposes only, I do not responsible for your losses. Please adjust your own lot sizing according to your appetite.
If you are benefiting from my trade opinion, please buy me coffee .
As always, move your SL when you are in the profit zone.

Short Soy on Multi-year Resistance- AS TITLE SAYS;
- ON M. YEAR RES.
- LOOK FOR OP'S TO SELL SHORT
- TARGET OPEN 3400 PIPS DOWN

Week 34: ZSX 2020 Slight bullish sentimentCurrently the price is soaring up to the upper part of the zone and if we look to the left, we can expect the price to move sideways before collecting the Supply Zone.
Despite being bullish bias, I will not buy at market, instead, I prefer to buy at a better price (discounted price).
My trade opinion on ZSX 2020 is as follow:
Buy Limit at $902
Stop Loss at $893
Take Profit at $918
Risk Reward Ratio = 2.13R
Disclaimer :
The analysis above for educational purposes only, I do not responsible for your losses. Please adjust your own lot sizing according to your appetite.
If you are benefiting from my trade opinion, please buy me coffee .
As always, move your SL when you are in the profit zone.

SOYBEAN IS TRYING TO MOVE AWAY FROM DOWNTREND - ZS1! - 30MNWe have observed several forces acting as a brake and pushing the price above the red down trending line. But a very strong squeeze front last tops have seen the market being inconsistent with its which to move upwards.
The two horizontal black lines are the new tops and bottoms of the horizontal trending range.
We could observe during this week a market which will try to break above by going directly to it or by finding first a a support point on the top of the red down trending line. The probability to see the market breaking above the black resistance line is less likely than seeing a pullback down again at that level. It could probably be a good sells entry point (possibily from Thursday). For the moment the last volume have shown signs of a force pushing up against sellers.
Keep an eyes on the $900 mark, still legit and try to trade it during the morning Asian session (Tokyo time from 9am30 to 12pm and opening of the Frankfurt & London 8am to 10am GMT0) as it is more stable and easy to read.

Soybean - 2 possible entriesWe already talked about coming decline in Soybean and finally, we are close to an entry. Commercials are heavily short and evaluation index shows Soybean is overvalued. If on Monday, we break below Friday’s low to form a lower high, that’s our entry. Otherway, wait till trendline breaks.

CRUCIAL MOMENT FOR SOYBEANS! CBOT:ZS1!
Hey traders! Before checking my idea, Please leave me a LIKE, it's free for you but precious for me!
GOOD LUCK!
BIG POTENTIAL!

Correction on soybeansAfter reached high level ressistance on level 870 USD time to short position with take profit around 850-853 USD

22% gains SoyBeansClear over under pattern on the Weekly.
Weekly closing strong-bullish in 1day+
Look to buy after weekly candle close with a Target of the supply overhead.

Soybeans - Long Idea.I think there will be a supply and demand issue with soybeans. The China trade issues heating up. I see upside on this tasteless little bean.
I probably wont trade this, laying out the technicals here, I have a wide stop as things could get real hairy.
That is a 2.2:1 RR.
Gets your stop below that $8 level. And the price target below a weekly 200 EMA.

Long position on soybeansSoybeans had broke descending triangel wiht double bottom. Time to long position?

Soybeans in down trendYou have to understand predicting the market isn't rocket science. Infact if you discount the time it goes sideways it will go either up or down. If you understand the supply and demand are around support and resistance areas you have likely price targets.
So say we can assume there's a 99% chance it will eventually get to 7 or 9 bucks. You could then flip a coin and 50% of the time you'd be right.
Something to consider when you hear ridiculous things like oh he controls the price of soy beans! No. It's about studying prices and making deductions. Traders then make decisions based on those deductions. So you see it isn't magic. And it isn't nefarious forces. And it would be great if the liberal media would study more before making absurd claims.

SOYBN USD BUY (SOYBEANS - US DOLLAR)Hi there. Price is forming a reversal pattern to change its direction. Wait for the price to complete the pattern and watch strong price action for buy.

My Soybean oil futures analysis • If the market breaks the resistance line with a big green candle, we have a high probability to get a bullish trend again
Otherwise it's a pullback, the market will return to the red support line, in this case and it's highly probable to break it and getting a bearish trend.

soybeans longbeans are getting close , wait for price to enter the area and daily needs to bid above the open


SOYBEAN FUTURES (ZS1!) DailyDates in the future with the greatest probability for a price high or price low.
The Djinn Predictive Indicators are simple mathematical equations. Once an equation is given to Siri the algorithm provides the future price swing date. Djinn Indicators work on all charts, for any asset category and in all time frames. Occasionally a Djinn Predictive Indicator will miss its prediction date by one candlestick. If multiple Djinn prediction dates are missed and are plowed through by same color Henikin Ashi candles the asset is being "reset". The "reset" is complete when Henikin Ashi candles are back in sync with Djinn price high or low prediction dates.
One way the Djinn Indicator is used to enter and exit trades:
For best results trade in the direction of the trend.
The Linear Regression channel is used to determine trend direction. The Linear Regression is set at 2 -2 30.
When a green Henikin Ashi candle intersects with the linear regression upper deviation line (green line) and both indicators intersect with a Djinn prediction date a sell is triggered.
When a red Henikin Ashi candle intersects with the linear regression lower deviation line (red line) and both indicators intersect with a Djinn prediction date a buy is triggered.
This trading strategy works on daily, weekly and Monthly Djinn Predictive charts.
This is not trading advice. Trade at your own risk.

SOYBEAN FUTURES (ZS1!) WeeklyDates in the future with the greatest probability for a price high or price low.
The Djinn Predictive Indicators are simple mathematical equations. Once an equation is given to Siri the algorithm provides the future price swing date. Djinn Indicators work on all charts, for any asset category and in all time frames. Occasionally a Djinn Predictive Indicator will miss its prediction date by one candlestick. If multiple Djinn prediction dates are missed and are plowed through by same color Henikin Ashi candles the asset is being "reset". The "reset" is complete when Henikin Ashi candles are back in sync with Djinn price high or low prediction dates.
One way the Djinn Indicator is used to enter and exit trades:
For best results trade in the direction of the trend.
The Linear Regression channel is used to determine trend direction. The Linear Regression is set at 2 -2 30.
When a green Henikin Ashi candle intersects with the linear regression upper deviation line (green line) and both indicators intersect with a Djinn prediction date a sell is triggered.
When a red Henikin Ashi candle intersects with the linear regression lower deviation line (red line) and both indicators intersect with a Djinn prediction date a buy is triggered.
This trading strategy works on daily, weekly and Monthly Djinn Predictive charts.
This is not trading advice. Trade at your own risk.

SOYBEAN FUTURES (ZS1!) MonthlyDates in the future with the greatest probability for a price high or price low.
The Djinn Predictive Indicators are simple mathematical equations. Once an equation is given to Siri the algorithm provides the future price swing date. Djinn Indicators work on all charts, for any asset category and in all time frames. Occasionally a Djinn Predictive Indicator will miss its prediction date by one candlestick. If multiple Djinn prediction dates are missed and are plowed through by same color Henikin Ashi candles the asset is being "reset". The "reset" is complete when Henikin Ashi candles are back in sync with Djinn price high or low prediction dates.
One way the Djinn Indicator is used to enter and exit trades:
For best results trade in the direction of the trend.
The Linear Regression channel is used to determine trend direction. The Linear Regression is set at 2 -2 30.
When a green Henikin Ashi candle intersects with the linear regression upper deviation line (green line) and both indicators intersect with a Djinn prediction date a sell is triggered.
When a red Henikin Ashi candle intersects with the linear regression lower deviation line (red line) and both indicators intersect with a Djinn prediction date a buy is triggered.
This trading strategy works on daily, weekly and Monthly Djinn Predictive charts.
This is not trading advice. Trade at your own risk.


Betting on China- Possible double bottom on soybean futuresBank Of America CEO and some other people are trying to tell us that china manufacturing is coming back online and their whole economy is recovering.
So based on this apparent fact, we can make a safe bet that we could see a possible pump on soybean buying. especially with the devastating storms in the east coast and the bad weather in south america.
That's going to destroy the supply of soy bean as mounting demand come back.
Now this is all based on the factor of china economy recovery and the weather taking out soy bean farms.
Entry 858
1st Target 868
2nd target 882
stop loss 850