SP500 Short Opportunity by ThinkingAntsOkThe Main reasons to think that a bearish movement is about to star are the next ones:
A) Same situation than the bearish movement in October 2018
observe how the price made exactly the same formation that is doing now, we can use it as a guide to develop our setup on this current scenario.
B)The current Technical situation on the 4hs Chart:
-The price is facing a Resistance Zone
-Volume decreasing ( Weakness of the bullish movement)
-On the resistance zone, we can see a Pin bar on that area (reversal pattern)
-On the 15minutes chart, we can see divergence on the last movement that is making.
Based on this, we expect a bearish movement to start at any moment, if that happens we will be looking for short opportunities on the first Corrective structure out from the ascending trendline.
We will cancel this idea if the price keeps rising above the current Resistance zone.
Updates coming soon!
SP


S&P 500/SPY Next level $277.64 - $278.00S&P 500/SPY Next level $277.64 - $278.00
1) We formed a bear flag figure.
2) We have 2 big impulses (Current impulse is 2)
3) We are under two moving averages 60 and 200
4) We are under clouds ichimoku
Target is: $277.64 - $278.00

SP 500 Short PlayI enjoy making charts simply to see how close my ideas are, (disclaimer: I don't trade every chart I make), this one is no different. I am not holding anything in SP 500, but the bigger picture seems clear, headed to a bear market. My best guess is that we fall into a bear flag from here. Watch the RSI for confirmation, we could rally, make a lower higher and a higher low, typical bearish set up.
Short Entry : 2500
Short Target: 1500 - 1200

S&P 500 Index Drops Below Support (Is This It?)Yesterday the S&P 500 Index (SPX) dropped and closed below EMA10 which is an indicator that marks strong support for this index. Trading below it gives it bearish potential.
Today, the SPX tried to move up and was quickly rejected on growing bear volume. We believe this can go much lower.
You can see all the signals and details of this drop before it happened here:
Make sure to hit like to show your support.
Thanks a lot for reading.
This is not financial advice.
Namaste.

S&P500 ALL TIME HIGH IS CLOSE!Hey!
It's time for a brand new S&P500 analysis.
S&P500 is having a very nice bull train going on and It will continue. All time high on S&P500 has been 2940 points but we will take it a little further.
NOTICE:
YELLOW LINE : Broken trendline in the middle of the other two.
RED LINE : The bottom trendline which is the current support IF S&P500 falls.
LIGHT LINE : Current resistance level. It shows that we will probably end up having 2950 points at least on S&P500.
ORANGE LINE : The current goal for every trader there is. Usually when a secure brokes all time high It will go down. If we reach 2940-2950 points I would suggest to short S&P500.
DARK BLUE : The current horizontal support level. ( This is more likely to happen rather than RED LINE )
The only indicator I'm having in this chart is EMA15 which comes from the lower part of the candle which means we're still bullish.
Pst. Click that follow button by the way! ;)
See you soon!
-JJ-


S&P 500 Index Will Crash To 2400 Sooner Rather Than LaterS&P 500 (SPX) has been maxed out for a while now, and I am quite bearish on this index as you might already know from my previous analyses.
The reason I am bearish is because of the signals that I getting from the above chart. So come and read these signals with me, and later share in the comments section and tell me what you think... Let's get started!
S&P 500 Index Prints Additional Weakness
Our main focus for signals in past analyses was mainly a bearish divergence on the MACD and RSI, but now additional weakness is showing up:
On the chart above we can see how the ~2815 level, marked with a purple dash line, has rejected the SPX over and over in a 1,2,3 sequence. On the 13 March, the SPX had its third (sixth) rejection from this resistance after the bounce.
We can see decreasing trading volume, which is a signal that points to lack of momentum for the move that is in play.
The daily candle for the 13 March hit a high at 2821.24, making it higher than the peaks of the 25th Feb. and 4th March. But when you look at the MACD, you can see it going lower and lower; here is the bullish divergence once more. The same can be spotted on the RSI.
In a nutshell, we have a triple top, decreasing volume and strong bearish divergence.
According to the signals above, the SPX will make a strong down move soon. For these signals to be invalidated, the SPX needs to print a high volume candle above 2821 and follow up by breaking its all-time high.
What's your take on the next S&P 500 Index move?
Hit like for more great content and to show your support.
Thanks a lot for reading.
Namaste.


S&P - long to 4000 then dumpI see a bigger wave one with a long wave 2 correction. According to EW theory there is a rule of alterntion where if you see a long wave then you could expect a faster wave 4 for instance. I think that is what we are seeing here. Everyone is talking about recession 2020. This is what it would look like with a blowoff top close to or at 4000. Then just imagine the huge dump that will ensue.

CADJPY bullish plan week 8. w7Overall
on week 7 by Heat meter CAD is dominant, JPY was weakest.
I will long CADJPY
Weekly
Reversal exhaustion
Dauly
Uptrend
4H
Range
Entry Long 83.153
SL 82.146
TP 86.112
RR 3

Short AMAZON @1647Demand is struggling to reach a higher high.
Biggest selling volume since May.
Targets are AT LEAST 50 - 61,8 - 100

SPY January, 2001 Replay?The price action we've seen since October looks a lot like the tech bubble of Y2K. The economy was just a tad more organic back in Y2K so our price action may not have as much drama. Using the first tech bubble as a model, the graph shows what will most likely happen. IF .....it plays out in the same fashion then we have to wait till February before this 'algo driven market' snaps under its own weight. Hey, its an idea. We'll see.

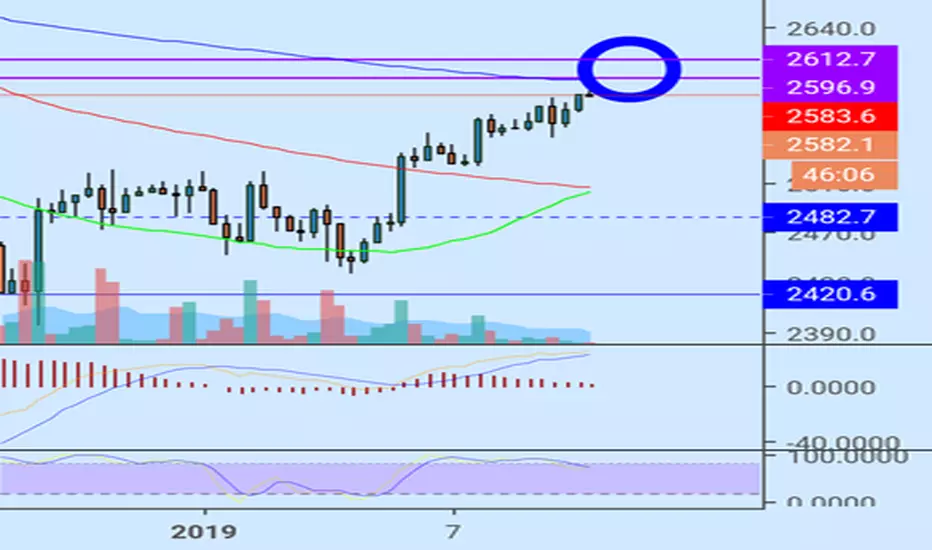
SPY500 - going down from 2600Lots of sell indicators pointed out. The one positive buy indicator is the Trend Meter.
10 year yields are at a matching point, ready to send yields lower.
Yellow trend line is previous support, now resistance.

2600 Goodnight. SPX Short. This is not advice.
2596 maybe 2600 or 2612 tops.
Sell Everything.
TP 2500 or 2420
MacD and STORSI looking OB Honey. All depends on Piggy Bank's breakfast. We'll see.
Good Luck and Goodnight USA
SPY- Futures have broken structure.Since the Futures have already broken structure we can assume that we will get that start of some downside movement. Whether we already topped or if we are simply pulling back is a big mystery in my opinion. In fact, trading bounces, are very difficult as there is an inherent lack of information as the movements are so volatile, not leaving as much room for analysis. I will be watching the horizontal supports closely to see if they are holding price or if we break down from them. If we do break down from both of these horizontals we will be looking at our SPY 233 lows. If that cannot hold then we will impulse down toward 212. The horizntal supports provide oppotunities to exit some shorts and de-risk and wait to see if they hold.

Short the S&P 500!Wave 4 correction appears to be complete.
Got a little help from Todd Gordon, Elliott wave analyst/trader.
Check him out!

SP TO BOTTOM 2508 TO MY ALT 2455 BEAR PHASED ENDING NOW BASED ON MY FORECAST THAT THE TOP IS IN JAN AND THAT WE ARE IN A 2 YEAR BEAR FYI ONE DOWN ALREADY MY FRACTAL WORK LOOKS FOR MY CYCLE LOW DUE NOW INTO DEC 18 AS LONG AS 2445 HOLDS I STILL HAVE A SHARP RALLY FYI I WENT LONG SP 2566AND 2547 ADDING 2510 AND 2483 WE SHOULD SEE A SHARP RALLY BACK TO JUST ABOVE 2815 INTO JAN 14 PEAK

Short Thwarting IncomingThirsty Bears wait for Zombie Bulls in Bollinger Band MA Gulch. IF the Zombies march North there's not much ahead in the way of the walking dead. But OB MacD on Multiple time frames suggest Bearish reversal in momentum.
Entry 2700 ish
TP 2666

SP500 at tipping pointThere's been a lot of FUD going on in the market lately. Multiple days of several hundred point drops will do that.
Ignore the FUD, and read the tea leaves. Here's what the charts say to me:
SP500 remains in the bull wave channel which began nearly 10 years ago in March 2009. As long as the price remains in this channel, the bull market continues.
Red line is long term support. Blue is long term resistance.
Failure of the red support is bad. If 2940 is in fact the market high, then 2460 is the first short target and will likely be the first domino all the way down to 1580 -- perhaps even 1140-1200 if we retrace in a similar fashion to 2008/2009.
Right now, I think the price is more likely to go back up than down, but should the red line fail, GTFO.


Very messy week going towards the midterms elections but currentIf it stays above 2600 this time next week and some good news comes out we could see new record highs by the end of the year?
If bad news is released and midterms go against Trump and the markets starts closing below 2600 we could be in a bear market by December?

