Just some small changes to the chart. Continuation of the previous charts as I learn new things or make corrections.
Sp500analysis


SPX bullish short term (followed by a correction)Expecting SPX to move up from here since the 5 EMA crossed above the upper limit of the latest downwards channel. Target is the upper limit of the red channel (above the 80 EMA). Hereafter expecting price to correct again to the downside after the 5 EMA breaks out of the red channel.
A close back below the last green channel invalidates this idea.

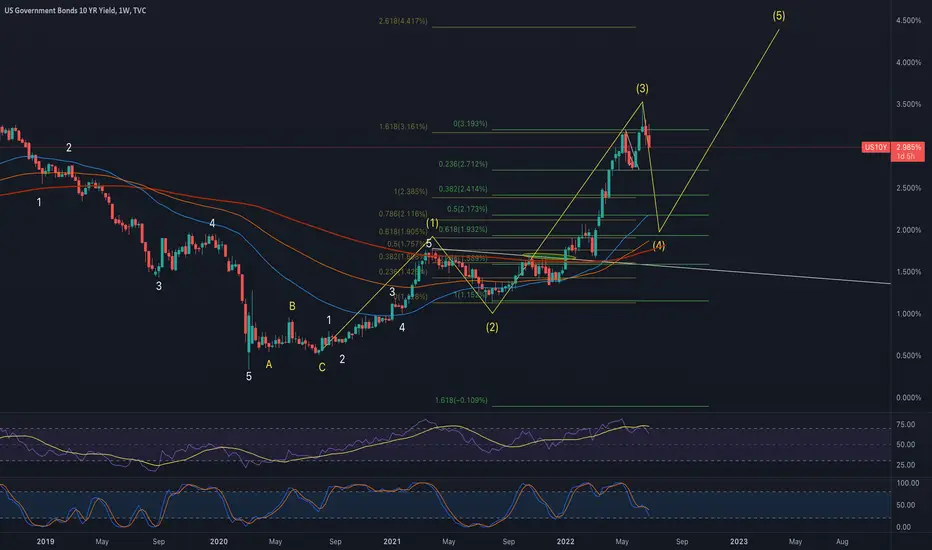
10 yr My W4 on weekly HTF chart is looking likely. If the Fed & ECB are in the debt market trying to stabilize the system via repo swaps then this dump is going to be a normalization process and the markets will chop around in some f**ked up range until W4 is complete around 1.9%-2.2% during this normalization period bullish momo will fizzle out and bears will short all pumps and win , but the greedy bears will get squeezed as all big dumps in markets will get bought up quick and change the direction b4 most traders know what even happened. I suggest only buying your core positions until w4 is finally done projected to finish July-Sept 2022. This would be a good move for the patient investors here to hold and add because once the W4 finishes and markets stabilize (if the fed pivots like I am saying above) W5 will line up on the 10 yr with W5 for stocks & crypto. Conversely If W4 becomes a fear trade (inflation narrative grows momo, war in Ukraine gets worst possibly nuclear war, china invades Taiwan or anything else unforeseeable) then W4 will decimate markets and 3200 SP500 is possible and $12K BTC.
SP500 Bullish move expectedSP500 is ready to move up and give good returns. It will give a good reward with minimum stop loss

S&P 500 Still Bearish in Long TermSetup:
1. we note a d3 Choch
2. OB D3
3. Liquidity D3
4. will wait for 12H LTF Choch
5. Last OB H12 OB creation
6. Then we willSell

S&P500: No LazybonesDespite the holiday in the United States, S&P500 has not been lazing around but has climbed into the middle white zone between 4156 and 4224 points. There, the index should finish wave (3) in white and subsequently start a countermovement into the lower white zone between 4076 and 3999 points. After it has completed wave (4) in white in this region, S&P500 should turn around and head for the upper white zone between 4332 and 4400 points to finish wave (5) in white. However, there is a 38% chance that the index could break through the bottom of the lower white zone, fall below the support at 3855 points and drop into the magenta zone between 3788 and 3683 points.

S&P 500 Still Bearish .
S&P500
It remains bearish,
in the next few days we will have a second opportunity to sell it.
Note: See order block 3D Chart

S&P500 has formed triple bottomS&P500 has formed triple bottom around 3800
shown a minor pullback
Technically, near-term resistance is at 4000
significant support stands at 3800

Gap coveredThere was a huge gap from the last run up, now is covered and creating a new fractal, now everything looks like a real upstair 4300

SP500 from the bottom of the channel upThe long-term trend remains bullish and the current ABC corrective pattern could have been completed.


S&P500: Exhausting 🥵An exhausting time lies behind S&P500! It has been moving up and down with vivid gestures and has paced itself a bit only recently. We expect the index to take a rest in the magenta zone between 3788 and 3683 points, where it should also finish wave iv in magenta. Afterwards, it should be revived enough to rise towards the mark at 4101 points. However, there is a 33% chance that S&P500 could be too nervous to relax and thus could climb above 4101 points immediately.

SPY Long Legged Doji on Daily!!! What's up everyone. Been a rough last few weeks as we know! We ended this CRAZY week in a DOJI and Daily Which looks to be a Long Legged Doji (Trend Reversal)
We do on the other hand a have a gap to be filled at 400 levels highlighted. It could either dump down there and fill or possible gap up monday morning..
From the looks of it though with Bitcoin going down slowly we most likely will fall through 400 anyways... When? I cant tell you!
Anyways good luck everyone! We shall see what happens :)

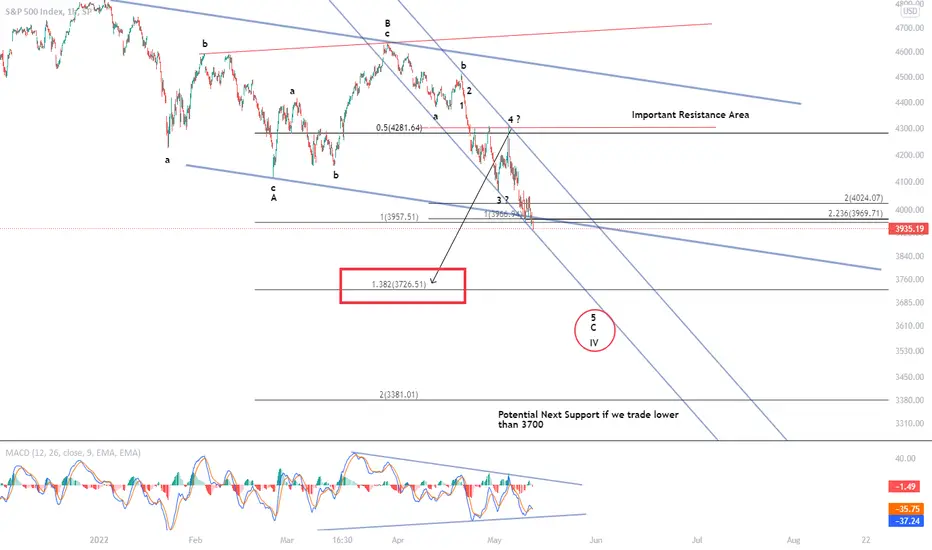
Evening Update: When I say the Bulls blew it...I mean it!Today was disappointing to say the least. When I say I know some of the best Elliot Wave Practitioners on PLANET EARTH, I am not exaggerating. No one was expecting this. The Math at the 1.0 Fib Extension was perfect. WHY GIVE IT AWAY?
The problem with today is we lost positive divergence on the daily chart. What does that mean? We go down...is what that means, and we now need more time to rebuild positive divergence on the daily chart before we can even think about looking up. That's why today's morning update was titled "TODAY HAS TO BE THE DAY".
Therefore I look to the next area of support at the 3700 level. Is it strong support? NO
But for right now there's no power behind the BULLS so this could end up getting far uglier before it gets prettier.
Potential Good News: The breach of the 1.0 was not substantial. To change my perspective on the above I need to see the following.
1) I need a lower Open in the AM.
2) I need to see off that lower OPEN a rally of epic proportion. a Green close above 4084.00
I'll see you all in the AM as we continue our efforts to track a bottom.
Best to All,
Chris
Researche in desctiptionTheory of Rational Bubbles:
www.jstor.org
Testing for Multiple Bubbles:
korora.econ.yale.edu

✅S&P500 SHORT IDEA✅S&P500 is looking bearish on weekly timeframe
✅As per my setup and strategy we are highly expecting price to drop lower my target will be 3581
✅ This could be bad news for crypto
✅Plan risk management according to your requirements.
✅The setup might fail if any external event effects the price or if did not follow the rules
Note :This is my personal opinion ,do not take it as financial advise

SP500- I expect a violent dropYesterday SP500 has risen fueled by the FED.
However, this rise is extremely short-lived and the index is back in support
I expect a break of this support followed by a violent drop.
3.5k remains my target and I think it will be reached sooner rather than later

Recession will push S&P500 down further - Bearish Stock MarketLooking at historic recession losses of the S&P 500 and given the current market conditions pointing to a recession one has can derive more downward movement for the stock market.
Looking at the S&P 500 there is still a lot of room downwards to an overall 20-40% correction down into the recession from the last ATH.
--------------------------------------------------------------------------------------------------------
** Please support this idea with your likes and comments, it is the best way to keep it relevant and support me. **
--------------------------------------------------------------------------------------------------------
!! Donations via TradingView coins also help me a great deal at posting more free trading content and signals here !!

SP500 in sitting on support, breakdown is imminentIn my previous analysis regarding SP500, I said that I expect a drop under the 4k figure and things are getting closer and closer to that moment.
Looking at the price action for the past 4 months, we can see that after a very bad start of the year, stocks have tried to recover, but sellers capped gains in the 4.5-4.6k zone.
A new attempt of recovery started in late March, but again, sellers took control in the same 4.5-4.6k zone.
Going further into last week, we can see that after reaching support again, SP500 rebounded on We and Th, just to sell off hard on Friday.
All this price development, for me at least, is very bearish and I expect a break of support.
In the medium term, my target remains 3.5k, September and October's 2020 highs, and also Fibo 50% for the start of "pandemic" rise, and only SP500 back above 4.6k is bullish in my book.
Of course, also my strategy remains the same: Sell Rallies

SP500 can drop under 4k and enter bear market territorySP500 has started 2022 badly and things look like will get worth.
After an initial drop to 4.1k, the index tried to recover, but 4.5k proved to be a strong ceiling and SP500 rolled back down.
Now the index is trading in February's low and I expect a continuation to the downside.
A drop under 4k would be significant for SP500, both psychological and marking more than a 20% drop (bear market, at least by the book).
In such a case, panic selling is a very probable scenario, and the price can drop fast to 3.5 support.
I'm very bearish SP500 and I will remain as long as the price is under 4.5k

⁉️ S&P 500 Weekly Analysis✅ Here I am looking for a long position if the price take out the liquidity below PWL (previous weekly low) and rejects from the daily bullish orderblock + institutional figure 4200, also the price has to fill huge imbalance left behind.

S&P500 turned bullish A good trader has to adopt for the change in trading environment.
the so long correction in s&p500 index is in a wedge shaped and now broke-out with 5 waves.
the 1st confirmation for bullishness (formation of wave''E'') is set as this BO (5waves)exceeded 62% of wave 'D'.
wait for 2nd confirmation ,a pullback up to 38% of new wave 'A '(4455)this week (FED int rate will be a surprise),buy above 4640 (3rd confirmation)
IF all set, the S&P500 rocket will climb to reach its targets (4930,5400)during this earning season
