SPYI think 1 more push to $469 to test the fib extension lvl 1.618 and complete 5 wave cycle on the daily
Sp500analysis

SPX & OCTOBER 1995-2020 60 % DOWN 40 % UP WATCH FOR TRAPS !!!This month seems another month of H.V . Also, it seems we can not go sideways either up or down 60 - 40 favoring down side .
Another observation is that more than 15 % we get a trap just around the first 1-9 days +- .
BE SMART NEXT SERVRAL DAYS !? BE NIMBLE ! LOSING AN OPORTUNITY, IS BETTER THAN LOSING CASH :-)
wish you all the best.

SPY normally I'd be Bullish, but...
Hello Traders -
I hope your are well. I just wanted to heed some warning, because well, the market looks like we've completed the bounce; but I'm not so sure. We are running up to the 200ema on the 20min. It looks like we could break through, but I'm still feeling we may have some headwinds we'll run into tomorrow with the FOMC. Let me know what you think!
Cheers,
Mike

S&P500: Ready for Take-Off! 🛫🛫🛫The S&P500 has reached its low and is now ready for take-off. We expect the course to rise until the area around 4620 points. Alternatively, the course could turn around before 4549 points with a 35% chance.
Let’s go!

US500 1D: Possible SHORTUS500 1D: Possible SHORT
As we look at S&P500, we can see a possible fall from 4500 to 3400 in the coming months

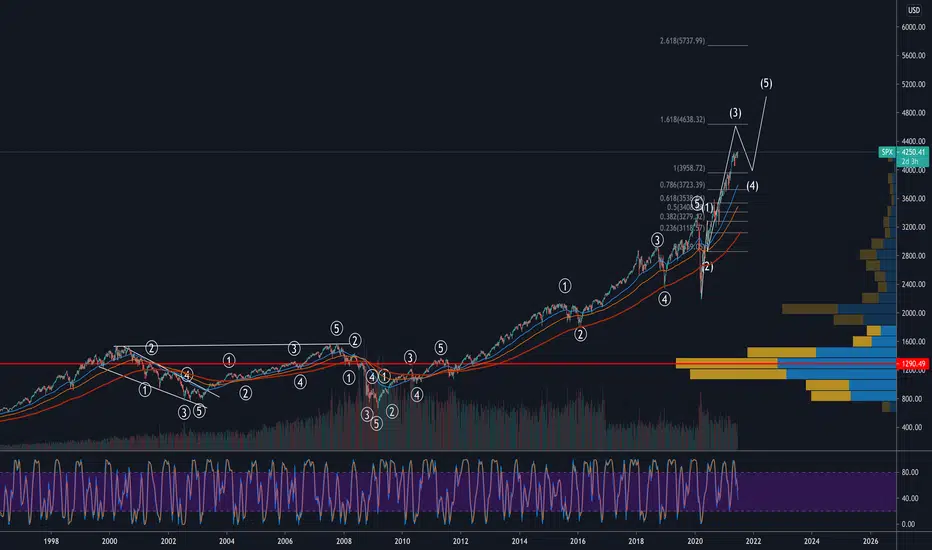
The S&P 500 Over-extended monthly updateI feel it is my duty to take a general picture of the situation regarding the most important financial market in the world, the American one.
The S&P 500, after the 2008 crisis recovered in 2013, then began a real climb interrupted by some "jolts", especially the recent -30% during the first wave of the virus.
However, if we analyze the monthly chart, from 1998 to today, it is very clear that something has gotten out of hand.
The market is extremely over-extended, with + 180% from May 2013 to today.
I was hoping that this summer 2021 had brought a reversal, even a heavy one, ideally, it would have been perfect to return to the pre-pandemic level, and then "prepare" for a fruitful Christmas rally.
So it did not happen.
The market continued to rise, drugged by the FED and liquidity injections, delaying a tapering that would have served, 2 or 3 months ago.
Far be it from me to be catastrophic, but as far as stock investing is concerned, I think the elastic is really too, too, too tight.
The pullback could be more violent than you think, which is why, in addition to cryptocurrencies and commodities, I invest only and exclusively on the shares that I want to keep in my portfolio for the long term, mediating downwards and waiting for "good opportunities" to come.
And next week, after yesterday's statement by the FED, sales could begin.
September is going to be a difficult month in my opinion and it is physiological and also necessary that it be. If not, let's get ready for autumn dominated by uncertainty.
Much better a tear, violent and as fast as possible.
The pullback is absolutely necessary.
Lazy Bull
DISCLAIMER: I am not a financial advisor nor a CPA. These posts, videos, and any other contents are for educational and entertainment purposes only. Investing of any kind involves risk. While it is possible to minimize risk, your investments are solely your responsibility. It is imperative that you conduct your own research. I am merely sharing my opinion with no guarantee of gains or losses on investments.

SP500 hit major fib level from 2008SP500 just hit major fib level from last top of 2008.
As you can see it hit 4545 which is 4,236 extension.
What happens from here?
My bet is down and finally and end of 13 years long bull market.

S&P 500 major breakout levelS&P 500 on major breakout level Of it break the level it will go up and will make new or it go down again If it sustained on above breakout level it will make boom.

SP500: Hot! 🔥🔥🔥Primarily, we expect the SP500 to stay hot and approach 4485 points, before a little cooldown sets in. However, 4530 points should be the overall aim in the mid-term. At around 4463 points, there is a 35% chance that we might take the long way and dip under 4365 points before rising again but that remains our secondary scenario for now.
Stay tuned!

SPX
Same vision, I can't discard any corrective move to 4300 - 4350, is possible, but also is possible reach the next target

Is your money worth reading "maybe´s"Hello Trenders,
Been thinking a lot to or to not publish this signal. Many of you expect a deep on global level, therefore I here show you some mathematic forecast.
This may not be the end of the world, yet it is far worse than the most downbeat forecasts. The evidence to support this outlook is in plain
sight. Some sixth-grade math is a good place to begin the analysis. Make 2019 economic output 100 (the actual figure is $22 trillion; “100” is
100 percent of that number; a convenient way to measure ups and downs). Assume output drops 20 percent over the second and third
quarters of 2020 (many estimates project larger drops; 20 percent is a plausible if conservative estimate). A 20 percent drop for six months
equals a 10 percent drop for the full year, assuming the first and fourth quarters are flat on net. A 10 percent drop from 100 = 90 (or $2.2
trillion of lost output).
Since 1948, U.S. annual real growth in GDP has never exceeded 10 percent. Since 1984, real growth has never exceeded 5 percent. The
highest-growth years since the end of World War II were 8.7 percent in 1950, 8 percent in 1951, and 7.2 percent in 1984. An assumption
that real growth will occur in 2021 at a 6 percent annual rate is a generous if unrealistic assumption. Such growth would qualify as a Vshaped recovery.
If our new base is 90 (compared with 100 in 2019) and we increase output by 6 percent in 2021, this brings total output to 95.4. If we
enter 2022 with the new base of 95.4 and increase that base by 4 percent (so, 95.4 × 1.04), we come to 99.2 in total output by the end of
2022. Here’s the problem. Using 100 as a baseline for 2019 output, and assuming 6 percent real growth in 2021 and 4 percent in 2022 (rates
of growth that have not happened on an annual basis since 1984), the economy does not get back to 2019 output levels. The hard truth is
that 99.2 < 100.
Source : The new great depression (2021).
What about if we really have a second wave harder then the first with mutatied covid?
I want to add, is not my intention to spread panic or "maybe´s" but the study got my attention.
Even the legends will have trouble surviving if this happen.
So how can a trader survive in this case condition by trading as only source of income???
Perhaps agricultural commodities will always perform....

SP500: All-Time High! 🆕🆕🆕Another week, another all-time high for the S&P500 – and it does not stop there. We expect the course to further rise to levels above 4426 points. There, a correction should pull us down under the support line at 4353 points. In the mid-term, the course should rise to levels above 4547 points.
Bull, Bull Hooray!


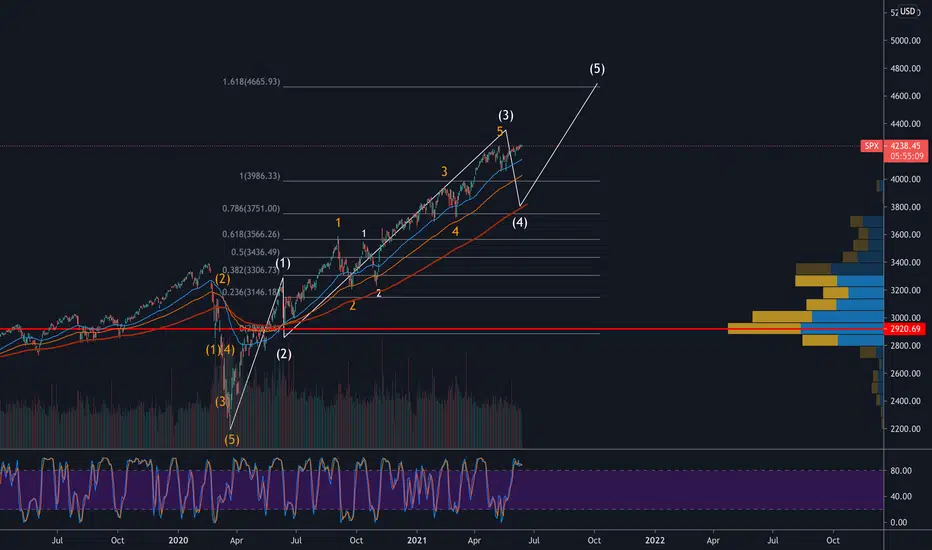
SP500Playing around with this count on the LT weekly chart from b4 2000 dot com bubble. SP500 looks like a very clean 5 up & 5 wave down pattern 1 after another. I am sure that if we dial down into the LTF we could find many complex Flat & zig zag corrections but zoomed out everything looks pretty clean.
The W3 that we are currently in lines up with 4600 rough target. I know a W4 is coming but the fib 1.618 lvl is really a better target for W3. So maybe SP500 continues up for now until 4600 and after that W4 will ensue. Hard to tell but I don't see W4 forming as of yet even with all the bearish inflation narratives.
Great moment for SHORT SP&500 Hello . For some time there was no reason for deal . Here's a good point.

SP500My super smart highly educated fin twit buddy is telling me 4400 is coming b4 any pull back. But IDK TBH I see the waves as complete and W4 should ensue very soon. So Im just open my LT trades and I am trading in and out quickly as we all know from EW wave 4 can be brutal. Or can be quickly bought up so this uncertain aspect of stocks leaves me kinda on the side lines as some FA shows that inflation trade is all about finished and with USA reopening we should cool off and a W4 kinda makes sense. I will say that this dip is a fantastic buying opportunity IMO.
Tech sector looks ready to puke so entries in the coming months can set up sweet portfolio positions in 2022. I will be doing an hourly wave analysis in my newly created group and trying to keep all eyes on the W4 pull back. GL guys.
Ponzi Factor Invisible. Hello Trenders and Volatility hunters.
Scanning hungry for results, I couldn´t belive my eyes when I saw SP500 Volatility Index.
This is unbelivable, the most easy and best ROI with security from Feds in the package included, in my best knowledge.
Here is hidden the "millionaire gentleman club" , wonderful.
I would appreciate every tip as a newbie.
The chart does not require any clarification, is a "no comment" one.
At this point I will say good luck but as you don´t need it I say BE HEALTHY.
M.M.M Make Motherfuc.in Money
Be wise: don´t work for the money, make your money work for you.

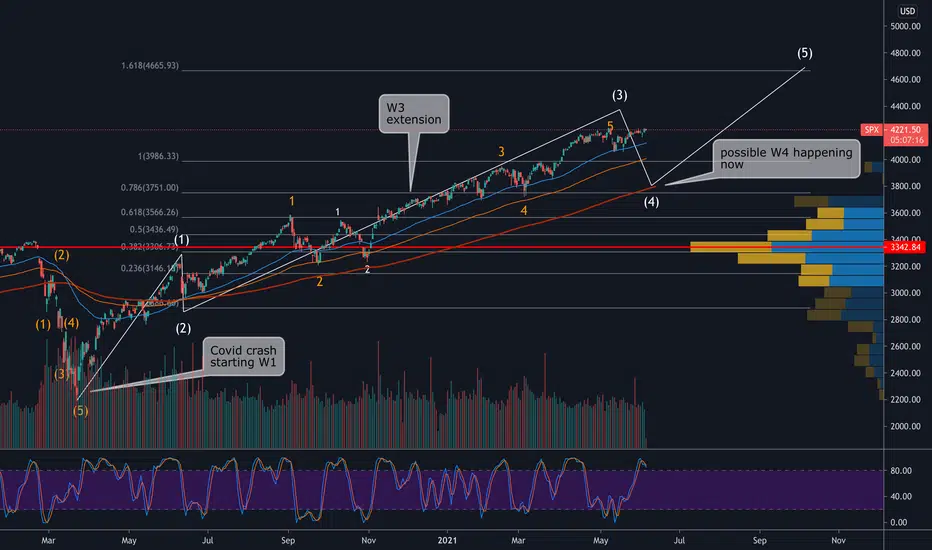
SP500Looks like we are starting the W4 correction which will lead to the final push up to 4700-5000 sp500 EOY TF.
SP500 TOP AT 4,395 JUNE 18 (FIBONACCI)THE SP500 SHOULD TOP OUT AT 4,395 THE WEEK OF JUNE 18TH.
It is an OPEX week, and this level of 4,395 represents the 4.618 Fibonacci Extension taken off the Dot-Com crash lows, 2007 market top, and 2009 crash lows. So far, the Weekly SPX chart has held the green trend line ever since the Covid March lows. Every dip underneath that line has been a bear trap. These Fibonacci extensions have been respected perfectly, seen most notably at Covid lows, and the September top (to the penny). We are currently stalled at 4,230, the 4.414 extension. The last jump is about a 4% "parabolic" blow off top move.
This is NOT the FINAL TOP . Rather, this is wave 4 down within a 5 wave Impulse Wave (Elliott Wave Principle). The bottom for this correction should be no lower than 3,588, the September 2020 highs. Most likely, this bottoms out around 3,700 or 3,800 area in mid July.
It will then make one more push (wave 5 of 5 off the Covid lows) to make new all time highs (or not--it may double top). Expected top for Wave 5 is in September and/or October, during which time another significant correction is to be expected. It is to be seen if that will be a major crash, or simply another correction before more highs in 2022 and 2023 (most likely--the FED is not done supporting the markets just yet).

I'm waiting for such a movement from SP&500 . SHORT . Intraday .Everything can be seen on the graph. We are waiting for the approach to the price to the zone of interest, if it does not interrupt EQL .


#SPXUSD giving more bullish opportunities... 🚀📈SPX is coming back to the bullish area, so it can surpass 4.200 soon this week.
