SPX500 Short Range for Tue Apr 7, 2020Previous Close: 2663
Top range: 2733
Bottom Range: 2409
Bias: Short
12:50:40 (UTC)
Tue Apr 7, 2020
Sp500analysis

#SP500,The declines to where?The SP500 dropped last week and stopped just above the average moving line 100 on the weekly graph, if we look at history in the last two serious price correction, The SP500 fell and did not stop at the 100 moving average line, but continued to the 200 moving average line
According to Stochastic and RSI, the declines have not yet come to an end.
Right now the SP500 is still very technically bullish
Our target will be above the 200 moving average line: $ 2686

E-mini S&P500 index 2020 year forecast by PowerfulTradersTraders we do not like to write more.
The prediction of the price you can find on chart!
Regards, Team Traders "Powerful Traders"

S&P 500 Stock Market Crashed Below 3000.00| 28th February 2020The S&P 500 has being in a bad selling. From starting Monday 24th February 2020 - Friday 28th February 2020. The stock has been free fall.
Stock investor in a fear. Panic. They was selling the stock and the sell out has been in significant by Thursday 27th February 2020.
No buyer in the market this week. Sharp fall down price from S&P to the wall street indices. While the coronavirus reported to be in the climax state of pandemic.
China not buying anything from oil to sugar to wheat. While demand is increasing on the Soy Bean from around the world thus the price of Soy Bean increasing. Soy Bean is among top 5 export item from China. Exporter not export Soy Bean thus making the price in demand. Copper price also did a significant drop since no buyer towards the items.
Thus the exchange money to Dollar has significantly drop. While many other companies in top 500 listed fortune has suffered the major impact in this beginning pace towards the coronavirus due to the exchange trade of China. Many companies was heavily rely towards China in manufacturing mostly in electronic part and spare part.
Referring to the OEC, China import oil almost 9.4% which is the biggest buyer in the world to sustain their 1.1 billion citizen. In the other hand, oil price will keep on dropping since there are big supply on the market which to balance the buying trade in the industry while the oil was producing in the same quantity.
Thus, stock S&P 500 will witness the biggest drop in history.
To be continue..
By Zezu Zaza

#S&P500, Time to sell?The S & P500 is on the rise.
At the moment our sell signal is about the price correction and not about a new trend.
The Stochastic Daily Graph is located in the top third which is a great area to sell.
The RSI is in the 70 area which is Overbought and it is a good time to sell.
Target: $ 3260


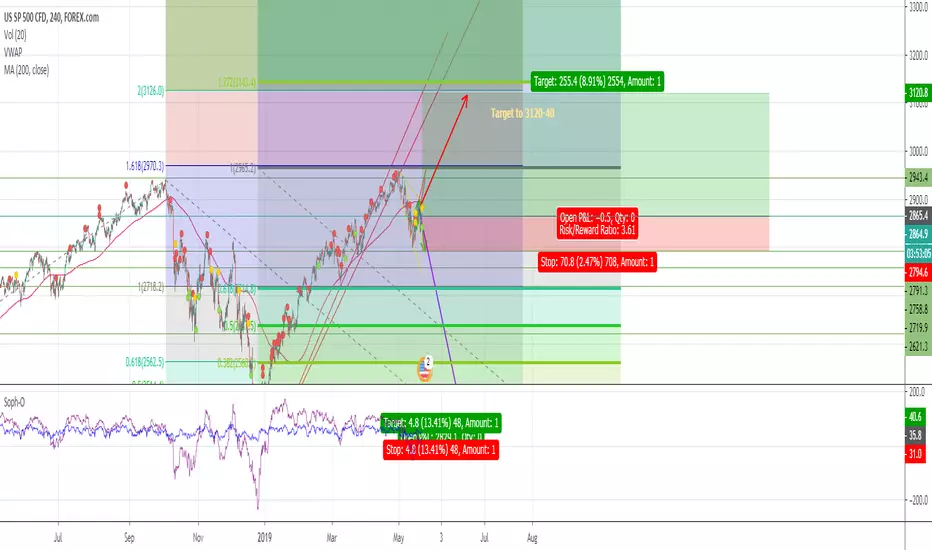
SP500 road to 4500$Most of the expert traders are arguing on the US economy to collapse, however, the charts itself show that the price has always taken a swing after the economy rest.
I may be wrong but as a technical trader, the price is at an important 1.618 level.

S&P 500 RecoverWall Street reversed its three-day sell-off overnight on renewed US-China trade hopes as investors piled back into the global recovery trade.
We think that the market probably goes higher, reaching towards the $ 3,200 level based upon the bullish triangle on the daily chart. Overall, this is a time year the typically works out well for stock markets anyway, as the money managers out there look to pad results for clients.
We're in buying position with the nearest Take Profit at 3,137, followed by 3,200. We putted our Stop Loss bellow 3,030. The price right now is trading above 50-day and 100-day SMAs and RSI indicator pointing higher above its 50 level, which mean that the bullish momentum should continue.
We believe that the 3,030 level underneath continues to be a hard “floor” in the market extending down to the 3000 level.
Remember, that at the end of the day it’s the Fed that supports the market, not the US/China trade situation. As long as the Federal Reserve is willing to step in and help the market along, it will continue to do what is done over the last 10 years - rally.

S&P - New York Session Outlook 02.12.2019 | Support & ResistanceHere the levels to watch Intraday for Support and Resistance. Analysis is unchanged compared to last week. We don't predict the high of the year, but I wouldn't be surprised when we have seen it with 3157. Be humble with Objectives when opening a Long position. In case you want to Short, look for opportunities when we trade below 3130. If we trade above this level I'm still Bullish

short #sp500 at 3148 with 3 TP until 3098 so 50 ptsshort #sp500 at 3148 with 3 TP until 3098 so 50 pts a huge profit but will go more deep later for now i talk only pullback UP TO STRAIGHT SO FAST FOR NO REAL REASON

ES - New York Session Outlook 27.11.2019 | Support & ResistanceLevels to watch Today for the New York Session.
See related idea for Yesterday's levels and how they where sensitive during the Day. Although I expected a deeper Retracement, the Resistance Levels noted where good for the New York Session High and Today's London Open High also bounced from a noted Resistance Level.
Not a good idea to pick the High. We are close to Thanksgiving and normally the Markets become more quiet. My Bias is Bullish and only when we will have a deep Retracement and or 1/2 Down Days a Bearish stance is considered. I would look for 'Resistance turns into Support' ideas for Longs and only would consider Shorts below 3130

Still Caution, Even as Market Has Rallied - S&P 500 analysisAfter U.S. President Donald Trump renewed his tariff threat against China, U.S. futures contracts — including for the NASDAQ, Dow and S&P 500 — retreated from their all-time highs. As well, this morning, exacerbated by the roiling unrest in Hong Kong, global shares are a sea of red. Sentiment itself is fragile and will likely follow prices.
The S&P 500 has initially pulled back during trading on Tuesday but then shot higher to show signs of strength again. By doing so, the market looks likely to try to break out of he current bullish channel that it’s been it for some time, and as a result we could get an explosive move. That being said, there is a certain amount of overextension to what we are doing right now, so don’t be surprised at all to see a pullback in the meantime.
The market could find quite a bit of support near the $3050 level on a significant pullback and will almost certainly find plenty of support at the 3030 and then the 3000 levels.
Looking at this chart, there is an undeniable uptrend going on, so obviously there will be a lot of value hunters underneath to try to take advantage of cheaper pricing. On the upside, the 3100 level decisively is the next resistance (upper line of the channel is around $3137). If we see a clear break there, then the market will make its move towards the targeted $3200 level above, based upon the ascending triangle that we had broken out of at the $3030 level.
Wall Street's main indexes have set new highs this month on the back of a strong corporate earnings season and hopes of a trade deal with Beijing to end the damaging 16-month tariff war. But the main question now is will rally be able to continue without earnings support? What do you think?

#SP500, Great movement on the way? Serious resistance at $ 3030 that succeeded in 3 attempts.
At the moment in H4, a double top template was created
Stochastic at maximum level with the intersection of lines.
For all of the above reasons, we recommend a sell trade with a target of 2940 and a target can grow as the SP progress.

#SP500, Will we have a confirmed Double Top template here?Upward trend.
Currently, the SP500 is in a Double Top pattern that can cause a trend change.
The Stochastic confirms the Double Top pattern by crossing its lines and positioning.
Target: 2830

When next ATH?We test the top of the blue channel: I will short the bounce, and buy, if the price will break up the blue channel with a retest. In case of breaking up, we will go the next ATH.

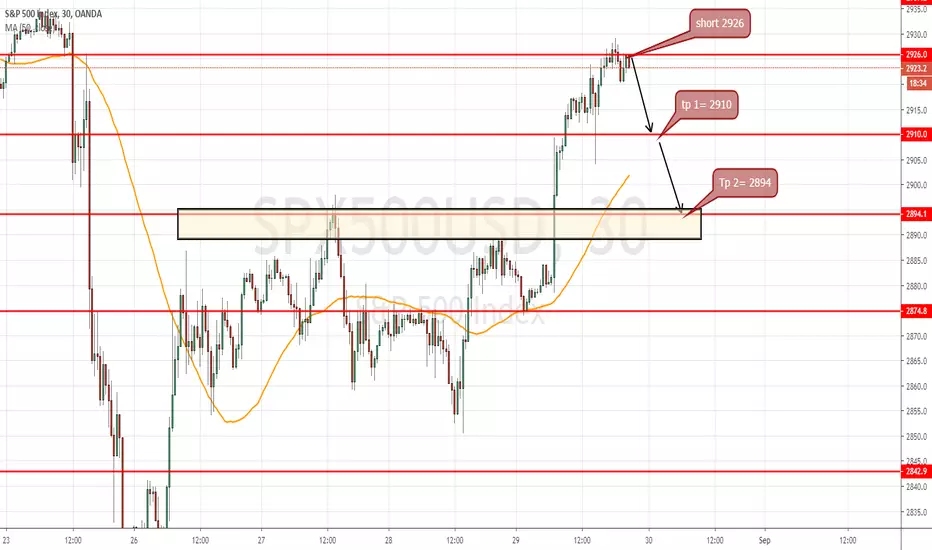
short #sp500 at 2827 with 2 TP short termshort #sp500 at 2826 with 2 TP short term ,the indice is overbought if we read the #tradewars news nothing is bigger or change a lot,i just play a pullback before he go more up or down
when it will reach 2910 i will make a SL at 2920 and down it every 1$ for if he back up before my tp ,i still keep some gain and be safe

#SP500 Short-term opportunityThe graph above clearly shows the support line of the rising channel and the resistance line.
One of the most attractive products currently available in the foreign exchange market.
Ichimoku indicator continues to support further gains in the SP500 price.
Because the index has broken a new record and the Stochastic is at its upper limit and signals a correction soon we will recommend sell signal not as a trend only as a correction.
Target: 2876

Will the big breakthrough be in the coming week? #SP500The last fall came after the SP500 failed for the third time to break the resistance in 2957.
Once the SP500 will break this resistance, the rise will be very sharp.
Stochastic in its very low area for buy).
Support at 2911.
Small target: 2958
The big target: 3000

Short-term analysis #SP500After the double top we had that caused a 7/8% decline from the peak, things changed positively, the Sp500 exceeded the 200 moving average, you can see in the chart above the start of a change in the Ichimoku cloud to a bullish trend.
Our goal right now is 2950

SHORT AT 2898 TO TARGET 2868 in 2 stepSHORT #SP500 at 2898 to target first 2868 and the 38.2 fibo at 23837 who are a big support too, i think it up so much just for mexico and nothing else and #tradewars still blur and on the table

What is the nearest target? #S&P500This review continues our previous reviews, we can see that the model of the Double top happened when the Sp500 reached 2940, since its price only drops, the question is how far will the declines continue?
You can see that according to the Stochastic SP500 has another margin to fall.
You can also see that 2611 is proper support (3 times the support lasted).
We should not forget that the long-term trend is an upward trend, and these are only healthy corrections.