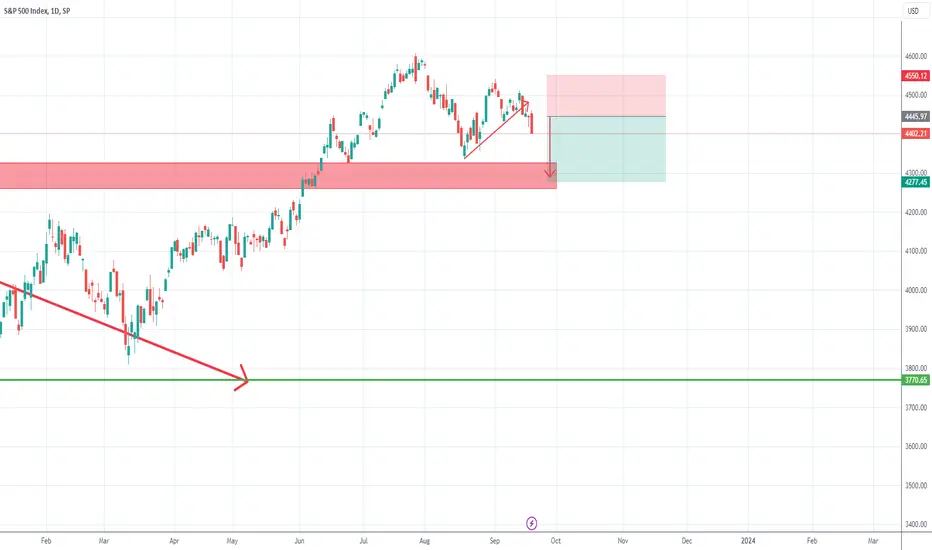
SPX to continue down?As I explained last week, there is a high chance for SP500 to drop to important 4250-4275 zone support.
On Friday the index dropped under the short-term trend line and, after consolidation on Monday and Tuesday, yesterday we had a strong drop.
The overall picture is pretty bearish at this point and another 150 points drop becomes very probable.
In conclusion, as long as the index stays under 4500, traders could look to sell rallies in search of a good risk: reward.
Sp500analysis
SP500 Short Term Sell IdeaH1 - Bearish trend pattern.
Currently it looks like a pullback is happening.
No opposite signs.
Until the two strong resistance zones hold my short term view remains bearish here.

Class A LONG on SPyLong Trigger on SPY for 1 Hr Chart. Will keep an eye on Volume as well for confirmation.
Be aware of Roll Overs this week. So may get volatile before catching some tail wind.

Weekly Roundup - SP500 SPX (September 9, 2023)Bit of wait and see for me. Monthly-Daily telling me price is going to seek Monthly ERL (go higher). Weekly telling me we are heading for weekly ERL first (go lower). Wait and see until things are more clear.

2 Down Days does not a Bear makeIts true but while Bears are salivating on these moves there is still room to hurt them and liquidate some of their accounts.
Bullish structure has not been broken for one.
Yes Price will gap down opening next week. But a possible bounce can be found anywhere around 4556...so keep your eyes 👀 opened.
My advise TP the majority of your shorts and you can watch from the sidelines with a smile on your face either way.

Weekly Roundup: Stock Market Indices - SPX500 US30 NAS100Weekly Bias slightly bearish if H4 price action supports the IRL to ERL bias for SPX & US30.
Weekly bias slightly at odds with monthly bias right now, so will likely wait and see for Weekly-H4 setups.

SHORTING $SPY (MARKETS ARE OVERBOUGHT?)Why I am bearish on the S&P 500?
- WBR Forecast indicator is BEARISH
- We are entering a key zone which we've struggled to breakout from for the past 5 months.
- Jim Cramer is bearish (Usually not a good thing lol) #inversecramer
My personal trade:
Stop Loss / Take Profits:
- Entry: $455.45
- Take Profit 1: $432.24
- Take Profit 2: $412.06
- Take Profit 3: $386.44
- Stop Loss: $464.89
The Plan:
Scale 50% of position at Take Profit 1 (TP1) and move stop loss to TP1.
Scale 50% of remaining position at Take Profit 2 (TP2) and move stop loss to TP2.
Scale rest of position at Take Profit 3.

SP500 Short, Day chart range
Retrace more than upward trend line. Hold for at least a few days to see outcome.
Cut losses early if unconfident, protect gains when market move in your favour.

SP500 - A New Bullish Trend!Hi everyone,
After a LONG LONG LONG bear market, the time is now to share with you some positive news!
Lets see one of my favorite indicator : MA 50 and 200 timeframe 3 days (Usually I use 4 : RSI, Fibonacci, Hash Ribbon timeframe Weekly and MA 50 and 200 timeframe 3 days).
I noticed a new GOLDEN CROSS that appeared very recently... Each time we get this Golden Cross, we has started a great bullish trend. And for more conviction, I'm waiting for a new higher high.
I stay careful until we break the last ATH...
Let's get the ball rolling!
Stay safe!
Take a look to the NASDAQ analysis :
PS: it's not a Financial Advice.

SP500 AnalysisWe got the rejection we were looking for at 4440. We took our first profits at 4420.
Now we are looking for a pullback UP and then enter again with a final target zone of 44.10 or so.

SPX to new highs SPX loves cups and handles.
All the highlighted Cup & Handles on daily have played out beautifully so far, they all have been to the upside so far, but now we are making one to the downside with targets towards 4150. Then how do we reach new highs?
If we zoom out to monthly TF things become clearer. As long as we stay above 0.5 or close above it on monthly, we have a chance to make new highs in a year or so.
I have highlighted several upside targets based on where we bounce from on monthly.

SPX did everything as per the plan, Where to now?I posted this chart just last week as part of my Major short setup going back weeks. Link to previous post in the description, please go through that setup to get the context.
This is going to be a short post, since everything is going as per the plan we just have to wait and watch, Price back to where I expect either a break below or bounce to continue higher.
So as per the plan If it's going to bounce now, I have highlighted two 30 mins demand zones. where I expect a bounce. Those two zones are also confluent with 0.786 and 0.886 fibs of the retracements.
Apart from this chart it pretty is self-explanatory.
Boost this post and leave me comment for any questions on this I'd be happy to explain.

Corrections do not last long. This one might ass well be overJust by simply measuring the previous corrections in the stock market, it is clear that corrections in general do not take long. The average size corrections seems to be between 3 and 5 weeks.
The botom of the current correction is found in week 4. As the price is also holding a critical support level, the probability of this being the bottom is incredibly high.
With Bitcoin finding a bottomg as well (these two markets are correlated), I believe that this is the bottom of the current correction.

Where to from here on SPXI posted this chart few weeks ago as a follow up to my short to show the few paths SPX is going to take after it begins the descent and SPX has followed the one where I explained about a break of the channel into the deviation below. please refer links below the description to look at my previous posts on SPX short idea.
The only difference is that this happened a bit slower than I anticipated, which makes this drop out of the channel less likely to be a deviation now.
As you can see, we are bouncing from the Support zone as I had highlighted in my previous post.
Which brings us to the question of where we go from here.
On The Daily TF we have first hints of a reversal or a decent size bounce from here, we have bounced from a key support and ended the day with right candle stick on the daily, but we need one more day of price action to confirm the reversal. If we get another green day without breaching the low, we are likely to head up.
But if we zoom in to 4h TF things become clearer.
Let's Look at the following chart:
On Friday we broke structure to the upside on 4h and created a strong low at 4336. That number is not random , Will cover this in the next chart.
If we get a pull back and break higher than Fridays high, we will get a full Change of trend on 4h TF. Once we do, we should be able to break all the 4h strong highs until we meet the Daily Strong high at 4502 which is what I think will be hard to break and we will get a strong rejection from there. From there we can do one of the two things, either come back down create a double bottom and try again to break the daily high at 4500 and continue higher. If not, we will continue the daily trend by breaking 4336 low and head lower.
Now let's look at why the price bounced from 4336. The following chart has the answer. If you know VPA, then you know price moves in ranges, just like candle stick patterns are fractals, Ranges can act like fractals as well. In the chart you can see There are 3 ranges R1, R2 and R3 that formed on this uptrend. R3 is the larger range that encompasses R1 and R2 and 4336 is the VAL of this bigger range and as Per VPA theory , price in a range keeps roughly bouncing between VAH and VAL of the ranges .If you look at the VAH of R3 it coincides precisely with the Daily strong high at 4500 which gives us another confluence for a rejection there into the Daily OB shown in previous chart.
Finally, if throw regular old fibs and Gann Fan into the mix we get additional confluence for a rejection at the 4475-4500 region as shown in the chart below. 4475 region is a Gann resistance and 4475-4500 0.5 to 0.618 region of the retracement.
Some Projections:
If we do get a move like the one, I have explained, i.e. move to 4500 area and reject, we will have few patterns emerge like inverse H & S and cup and handle. I have highlighted the targets if they mature. But always remember all these patterns are pure manipulation by large institutions to trap retail traders, it possible that there is a fake out into the pattern where pa comes to lower 4300s and then reverses from there can creating yet another pattern a Double bottom, so only trade confirmations based on market structure change.
Happy Trading App!!!

ES1: Will the bulls come back soon?ES has been following the bullish count almost to the dot for the majority of the year so far. Right now ES is on critical trendline and fib support and RSI has several points of bullish divergence. If the trendline breaks, it is still not the end of the world. But, if 4300 level breaks, then it will be very worrisome. Below 4200, the doom and gloomers may be correct about low 3k levels....but, right now, those numbers below are not in the plans yet. However, the bulls need to show up pretty soon here....

$SPX500USD US500 Continue to Build Upward PressureOANDA:SPX500USD
We will have choppy times ahead.
Target 4600
Above 4600 Vey Low Volume
The sentiment is positive
4060 is support
Technically
Higher Highs Lower Lows
We are slowly leaving the current ange
The ranges are increasing
The S&P 500 has rallied rather significantly during the course of the week to break above the 4200 level, showing signs of extreme strength. At this point, the market looks as if it is going to threaten the 4300 level above, an area that has previously been resistance. We have seen a lot of noise over the last several months, but the resiliency of the market is something that you have to pay attention to. As long as the market stays this resilient, it will be difficult to short anytime soon. The candlestick seems as if it is trying to tell us that the market has made up its mind finally, and that it decided that it’s going higher.
If we can break above the 4300 level, then this becomes more of a “buy-and-hold” situation, but you can see that the gains have been hard won. With that, I think you get a situation where you are probably better off looking for short-term dips that you can take advantage of, as they offer value in what is becoming a very aggressive uptrend.
That being said, if we were to turn around a break down below the 50-Week EMA could send the market lower, perhaps back down to the 4000 level, and even down to the 200-Week EMA which is currently near the 3770 level. However, it’s probably worth noting that momentum is definitely not on your side if you are going to take this position, and therefore you are probably better off looking for a move to the upside but expecting a lot of volatility. Keep in mind that the S&P 500 is not equally weighted, so it’s just a handful of stocks that make the difference.

Weekly Update: Nothing Lasts Forever. NOTHINGI vividly recall a few years back having just finished labeling the above chart of the SP500 from inception. I labeled the chart and included most of the historical events that occurred over the course of that time. As a trader, I wanted to have a quick reference visual picture of price action during war time, innovation, and societal change, juxtaposed on my EWT count.
Afterwards, I plopped on the couch and wanted to “Veg Out”. As a full-time trader and analyst, my mind was kaput. Exhausted... I wanted to watch something on TV that required no more of my brain energy. I turned on the History Channel and subsequently settled on this series called, “Life After People”. As the series progressed, I went from mentally exhausted to engaged. The simple summation of the series was that despite us having built sky-scrapers, cities, bridges, etc., if people we’re no longer around, the sum of the proof we ever existed on earth would eventually get overrun, deteriorate, and the final result would be recycled by the planet into the sum of its elemental parts.
The series referred to this process as Entropy. I wondered if the time I spent laboring over the machinations of price action since pre-industrial America was in fact, the natural order of progression. Birth and death. Start and finish.
I looked up the definition of Entropy and here it is.
Entropy is a scientific concept, as well as a measurable physical property, that is most commonly associated with a state of disorder, randomness , or uncertainty . The term and the concept are used in diverse fields, from classical thermodynamics, where it was first recognized, to the microscopic description of nature in statistical physics, and to the principles of information theory. It has found far-ranging applications in chemistry and physics, in biological systems and their relation to life, in cosmology, economics, sociology , weather science, climate change, and information systems including the transmission of information in telecommunication.
Every known thing, will eventually succumb to Entropy.
I found the concept of entropy, captivating, thought provoking, and I couldn’t help but wonder if entropy applies to what I do. I’m a full time trader. When I am asked what I do for a living, that is always my response. But I also associate with being termed a financial pattern analyst, an Elliotition, or just a plain ole’ analyst. As an Elliotiion, I practice the financial forecasting principles discovered by RN Elliott in the early 1930’s. My association with Elliott Wave Theory (EWT) was a normal one, as I never conceded price action was random. Even as a young investment banker in my twenties, I always had this nagging notion, that however subjective or complex the stock market appeared to be, that eventually a simple construct would emerge that would lift the veil of the random, to allow for a more scientific methodology to answer the movements of stock prices and markets.
My introduction to the principles of Elliott Wave Theory started that quest for answers to seemingly unanswerable.
In Elliott Wave Theory, counter-trend patterns such as waves 2, 4 and B, are areas of potential complexity. It is within these particular wave degrees that some of the most obscure financial price action patterns come into view. From triangles, to WXY's, and the gamut of pattern complexity carves out their shapes here. To even the most seasoned Elliotition these areas can cause confusion, mislabeling and undoubtedly, uncertainty. In the intermediate sense, they mean less. But when observed in the larger cyclical timeframes, these areas are always associated with economic and/or societal change.
The last financial supercycle waves took place on October 1929 wave (I), and April 1932 wave (II). Post 1932, financial prices have advanced seemingly unabated for 90 years. During this 90-year timeline, humanity has advanced in technology, medicine, communication, etc…all of which have impacted living conditions and average life span. These advancements changed migration patterns, mobility and communication.
I can’t help but think, is now the precipice of where our 90 year advance and the natural order of entropy have hit a tipping point and henceforth, entropy now has statistical favor?
Granted I am not skilled to discuss societal matters or medicine, etc…but from an analysts perspective…Is flat to down now the path of least resistance in the markets for the foreseeable future?
Along the way of the 90 year advance in the SP500 you can see the historical events that have occurred and their impact on price action. Those price action sub-divisions were the result of the best and worst of times post 1932. My children, now grown adults, were financially shaped most by the 2008 financial crisis. However, in the grand scheme of super-cycles…you can barely make out those declines on the above chart. The final anecdote I’ll share is in 1991, when my wife and I bought our first home. Making what we believed to be one of the largest purchases we would make in our young lives, we watched mortgage rates as they flucuated. Then, we pulled the trigger to lock in rates, due to a short term dip, and at the time, felt we were wiser than most. So happy with our shrewdness in locking in 9.75% APR on a 30 year fixed mortgage. In retrospect, mortgage rates never went back above 10%. The last two decades, fiscal policy was on a longer term trajectory to 1-3%. We were not the gurus we made ourselves out to be back then. Maybe that trajectory down was a reversion to the mean in the post Larry Summers Fiscal policy of the mid to late 1970’s. Seems so now with the benefit of hindsight. But now it feels like that again…but this time the reversion to the mean is a post Ben Bernake fiscal policy. I can’t say for sure, as I do not posses that kind of foresight with respect to interest rates.
What I can say, is having analyzed 150 years of price action, financial entropy is starting to rear it’s head. If this is in fact starting price action of a supercycle wave (IV). The buy and hold strategy is dead. This will be a traders market for at least the next two decades, or more. Case in point…observe the area in the red box on the above chart. This area is a primary circle wave 4 of one lesser degree within a cycle wave III. That wave 4 consoldation lasted from 1996 until the beginning of 2013. That was manageable. That was also 17 years of price action digestion from the previous 1974 stock market bottom.
Since our previous supercycle events, we have experienced wars, advancements in technology, medicine, migration patterns OH AND WE EXPERIENCED a global pandemic. Mirroring what led up to previous (I), (II) wave degrees.
I don’t post this to scare readers, nor do I seek ANY attention. I do not ever see myself as being referenced as the trader who called the top of some market in some time. I forecast these things to evaluate if I can make money as a trader from the forecasts. In conclusion, I’ll leave you with one of the wisest quotes I ever heard as it pertains to what I wanted to achieve as a trader when I started. Its not from a wise greek philosopher. Its from Cuba Gooding Jr. in the 1996 movie Jerry Maguire.
“I’m already famous…now just show me the money”

Which Path Will Prevail?Time to view all possibilities after a weak Friday of movement. I have developed an indicator that identifies Wave 3s, wave 3 of wave 3, and the end of corrective waves (2, 4, or B) which can be found here: . Some wave 1 and wave A ends will get a signal, but it takes other analysis to identify those points.
Applying that script to the chart at the intervals below, may aid in identifying where the market is. The indicator on the chart is the second row of indicators called EW_3_v2. Here is the 10 Minute Chart:
I have placed all of the locations of data from the macro waves which I will walk through. This chart shows Minuette wave 3 of Minute wave 3 at 1050 (eastern time) on August 2. Next signal aligns with end of Minor wave 4. Next signal aligns with the probable Minuette wave 3 ending in Minute wave 1 inside of Minor wave 5 inside Intermediate wave 5 at 1500 on August 4. Next signal was likely Minute wave 4 inside Minor wave 5 at 1550 on August 8. Next signal was Intermediate wave 2 at 1000 on August 10. The next and final apparent signal was a wave 3 ending at 1350 on August 10. This signal could be Minuette wave 3 inside Minor wave 1 possibly inside Intermediate wave 3.
Next is the 15 minute chart: The first indicator of Minuette wave 3 of Minute wave 3 from August 2 remains. Next signal is Minor wave 4 ending and the currently marked end of Intermediate wave 2 on August 10.
Next is the 30 minute chart: which identifies the same points of interest and Minor wave 3 endpoint is indicate instead of the Minor wave 4 ending.
I use this macro to micro to macro scale of chart viewing to confirm or identify possible points of interest. The main hourly scale only identified the end of Minor wave 3 which was the original job of my wave 3 indicator.
Based on this, the main chart above outlines the 3 paths. The left chart is if we are in Intermediate wave 3. Ultimately the market should move down this week if this is the current location. The middle chart assumes we are earlier on than expected and that the low from August 11 was only the end of Intermediate wave 1. This would mean the market should move up for most of this coming week. The retracement percentiles have not changed and on the chart. Possible top target would be in the 4510-4525 area. The main issue with this theory is based on the location of signals from the 10, 15, and 30 minute charts. They do not align well if all of last week’s movement was only Minor wave 5. This is my skepticism with this chart. The right chart assumes we are in Minor wave C of Intermediate wave 2. This would see the market move up early in the week but top before midday Wednesday. While this path is quite plausible and the prior target zone holds, the wave 3 indicator analysis would have placed wave 3s in the wrong location which is my skepticism for this theory.
Basically, we have three potential paths this week. I will monitor to see which one plays out. I am back in sideline mode in the short-term until the path forward is clearer. Longer-term puts likely remain safe as that is the overall market direction.

SP500Looks like we are in the 5th wave of the Cycle HTF wave 3. My analysis suggests that this move will take anywhere from 6 months to18 months to finish before an aggressive wave 4 bear market on the cycle HTF.

S&P 500, 7/6/23For Thursday, 4393.25 can contain weekly selling pressures, above which 4552.25 remains a weekly target able to contain weekly buying pressures.
Closing above 4552.25 signals 4624.50 within 3 - 5 days, able to contain buying through July, and the formation settle above for yielding the 4808.25 longer-term objective by the end of August or sooner.
Downside Thursday, breaking/opening below 4393.25 allows 4372.00, also able to contain weekly selling pressures and the level to settle below for reversing momentum into next week, 4305.50 then likely by the end of next week where the market can bottom out through July.

S&P500This Is My Anticipation On The S&P500 For Today, We Have SMT Divergence With The Nasdaq On Both The H4 And The Weekly Time Frame So I Believe We May See A Retracement Down And Eventually We Will Trade Up To Take The Buyside Liquidity But For Now This Is What I Believe Might Be The Markets Next Move

S&P 500 Pushing to 6,000 after Wedge BreakFalling Wedge has formed with the S&P 500 since 1 July 2021.
We then recently had a breakout above 3,991 which confirmed upside to come.
With the strong Engulfing up candles, we can expect the price to soar in the next few weeks.
That is if the trend does hold and doesn't cause a fakeout.
Price>200
RSI>50
My first target is at 6,000.
SMC
Below the Falling Wedge, there is a clear sign of Sell Side Liquidity.
This is where Smart Money buys into positions (and sweeps liquidity) from traders who are long (get stopped) and for short traders who enter into their trades.
This causes the price to rocket up each time it touches this Order Block.
Now we'll need a strong catalyst for upside to continue. I am rooting for this one...

S&P500 hits target, Time for a correction?The S&P500 has hit our first target a couple of days ago. Now the price is at the lower level of the resistance zone. This could mean that a correction is due.
I believe that the resistance will be either broken or held at the end of the week. In this case, the most likely scenario is that the resistance will hold, and that we'll see lower prices for the upcoming weeks.
This post gets invalidated the moment the lower resistance level breaks.
